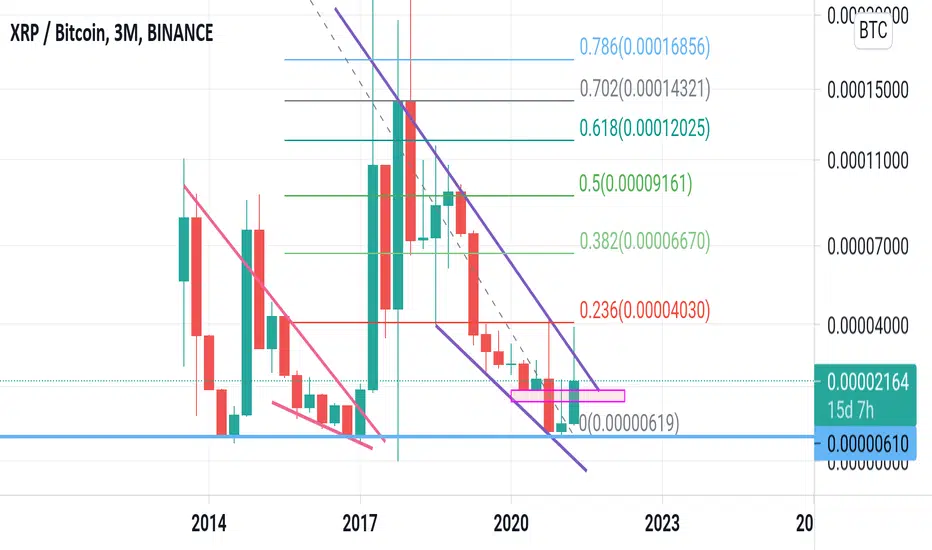
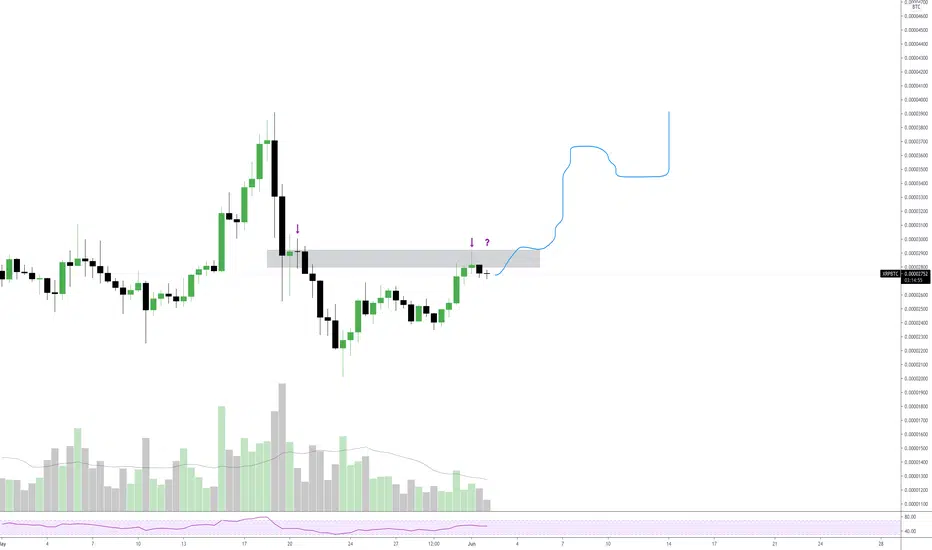
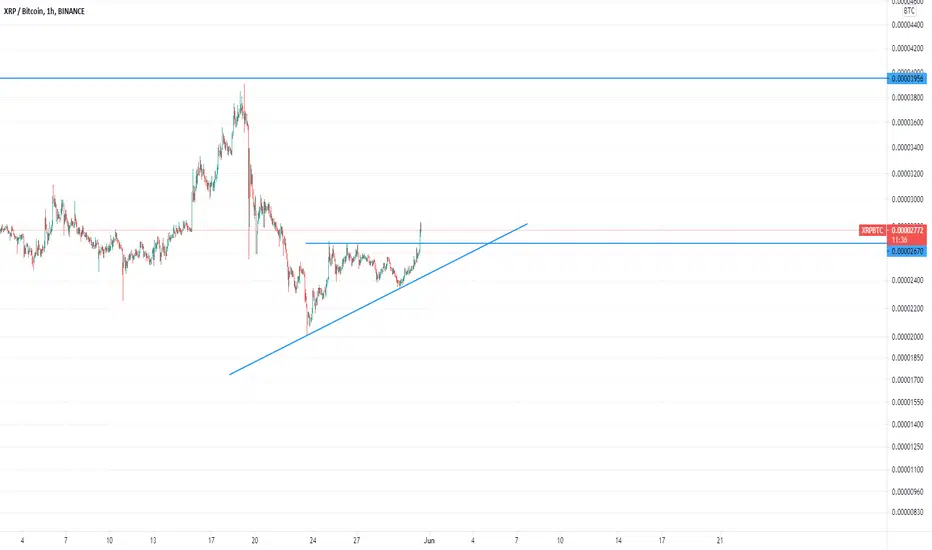
XRPBTC 3 monthsCurrently XRP on BTC pair is above the support area (rectangle box). Kindly note the previous candle is an inverted hammer (bullish pattern) and we have only 15 days remaining to close the current candle. If we close above or within the rectangle box which is a demand area we will see a break out on the trendline and break the .236 fibanocci level. Rest Fibanocc level will be the target.
Not a financial advise but if you like the idea, please support me by hitting the like botton.
Thank you
XRPBTC trade ideas

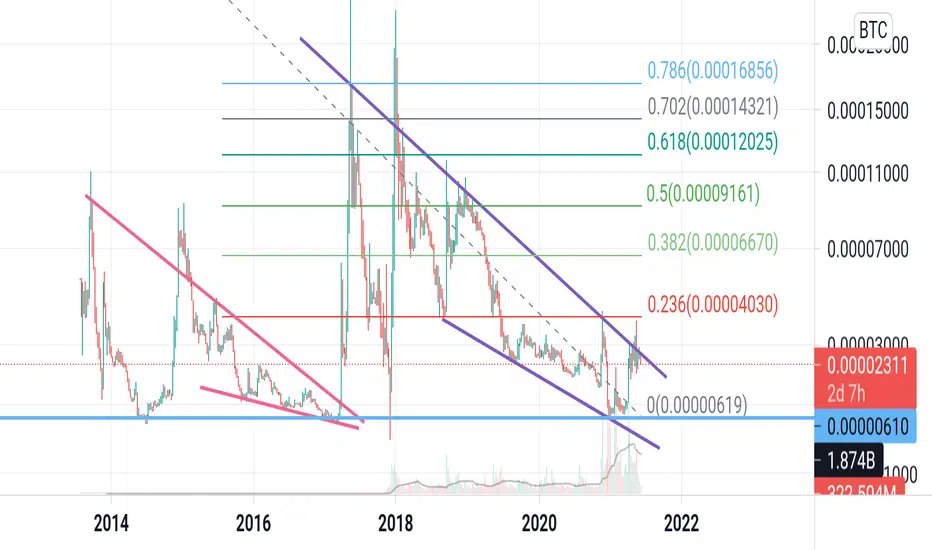
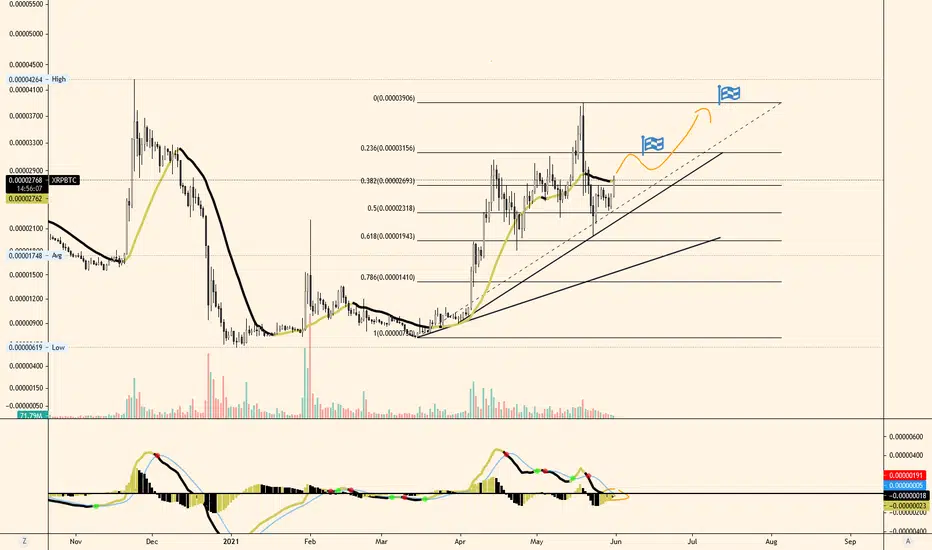
XRP BTC, WeeklyXRP BTC pair is still bullish and try to break out in the falling wedge. The chart speaks it self of the target as per fibanocci level. Once we break .236 fib level we will see the rally upward.
This is not a financial advise. If you like the idea please support me by hitting the like botton.
Thanks you
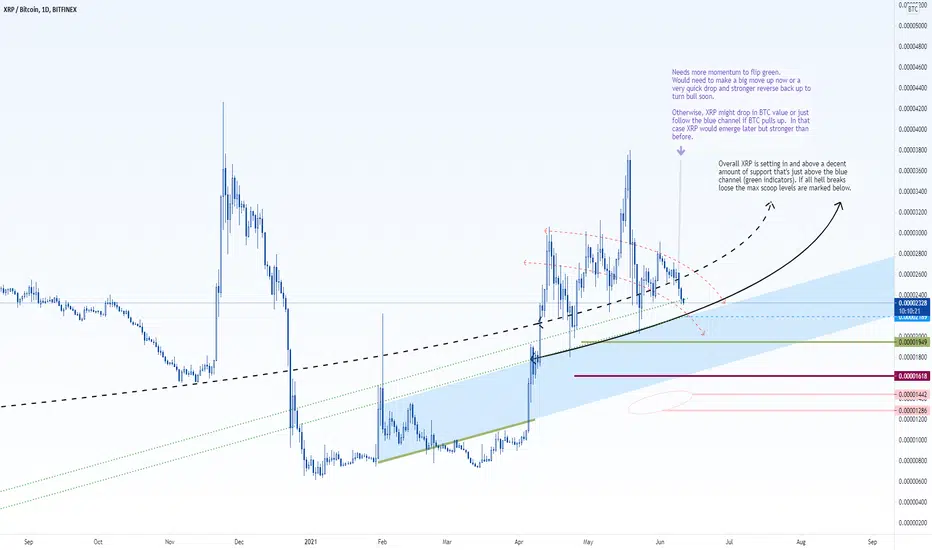
XRPBTC with DWEB indicator
See original above for explanation. I'm greedy with BTC so I rather wait but I will buy if I see strong confirmation of these events . I just set some buy orders at the bottom levels to catch a wick if that should happen.
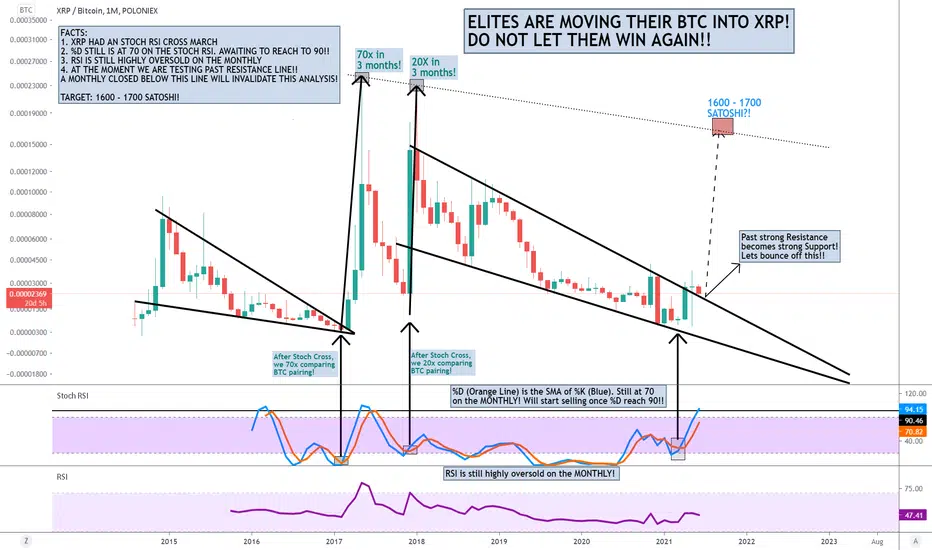
XRP UPDATE - DO NOT LET ELITES WIN THIS TIME!!XRP UPDATE - DO NOT LET ELITES WIN THIS TIME!!
ELITES BEEN MOVING THEIR BITCOIN BACK INTO XRP. THIS HAS BEEN GOING ON SINCE MID MARCH. THEY KNOW WHEN TO BUY AND SELL, AND RIGHT NOW THEY ARE BUYING XRP. I DO NOT FOLLOW ITS FUNDAMENTALS OR NEWS. I DONT CARE IF THEY ARE GETTING SUED. NEWS CREATES WICKS, BUT THE BODY OF THE CANDLES TELL THE FACTS
SEC SUED AMAZON AND TESLA. ALL AVERAGE PEOPLE SOLD WHILE ELITES BOUGHT! THEY ARE NOW THE WORLDS RICHEST PEOPLE. THEY ARE DOING THE SAME EXACT THING WITH XRP!!!
FACTS:
1. XRP HAD AN STOCH RSI CROSS MARCH
2. %D (ORANGE LINE) STILL IS AT 70 ON THE STOCH RSI. AWAITING TO REACH TO 90!!
3. RSI IS STILL HIGHLY OVERSOLD ON THE MONTHLY
4. AT THE MOMENT WE ARE TESTING PAST RESISTANCE LINE!! A MONTHLY CLOSED BELOW THIS LINE WILL INVALIDATE THIS ANALYSIS!
TARGET: 1600 - 1700 SATOSHI!
Good Luck!
"If you can't beat the fear, do it scared!"
"Be fearful when others are greedy, and greedy when others are fearful!" - Warren Buffet.
"Markets are a device for transferring money from the impatient to the patient. - Warren Buffet
"Show me the charts, and I'll tell you the news." - Bernard Baruch
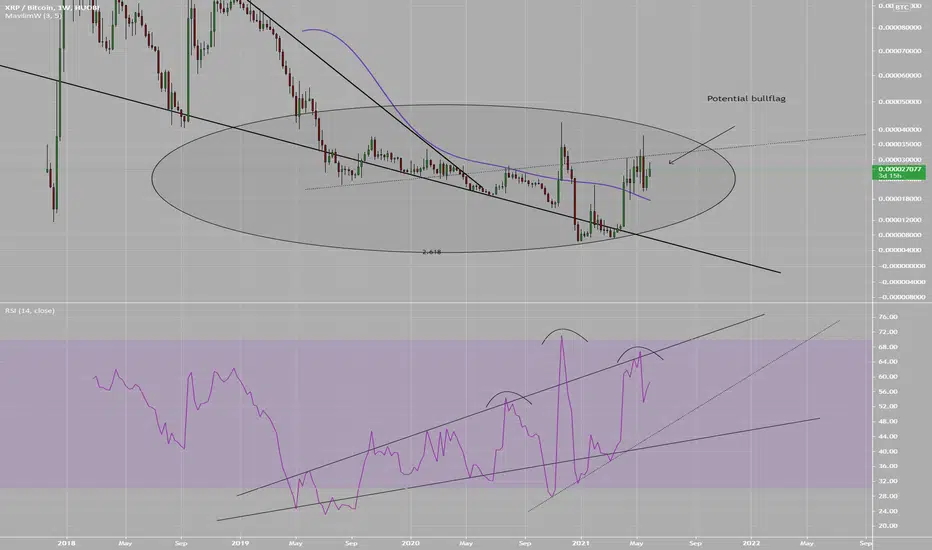
XRPBTC Bullflag to 4.618XRPBTC has formed a nice looking bullflag
Strongest trendline identified (dotted line) and used for a fib circle
It can be recognized as the strongest trend with evidence of price touching or bouncing off the inner circle (in ovals / circles)
Breakout up likely


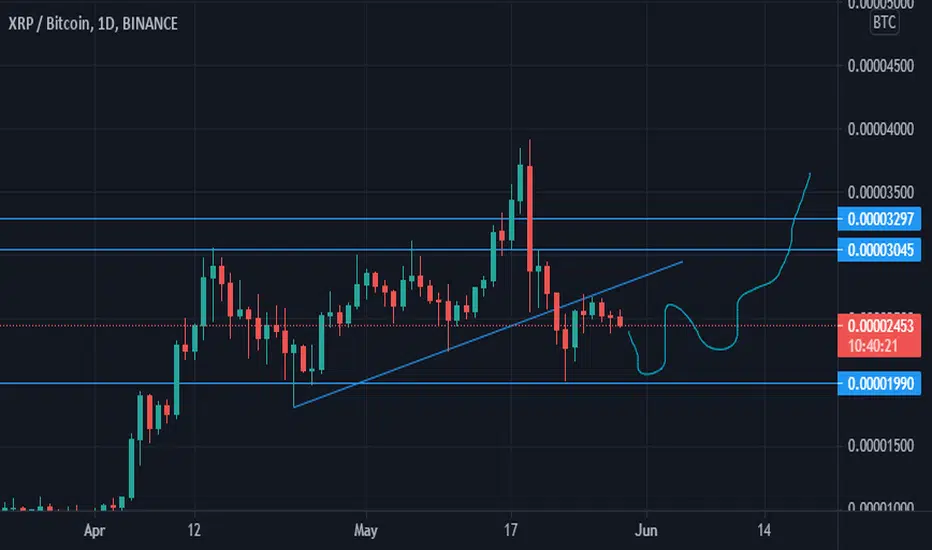
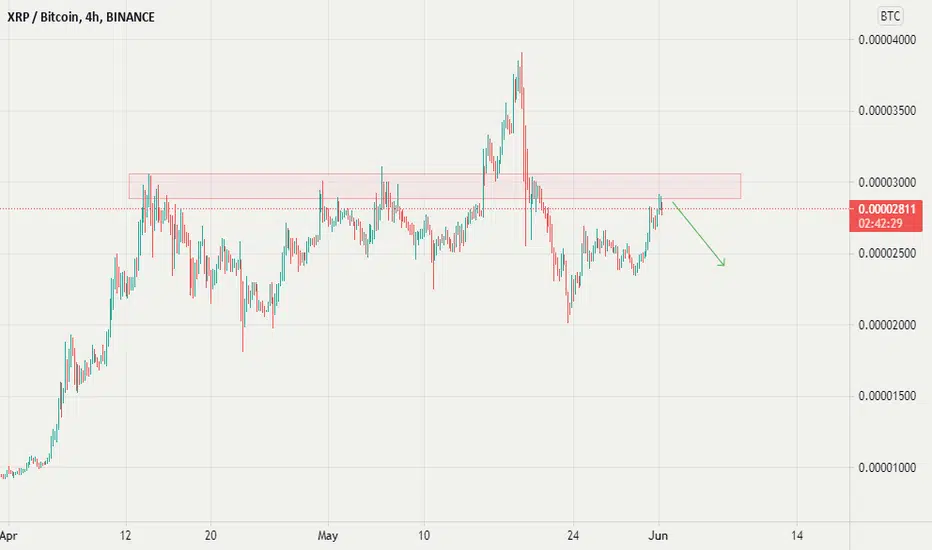
XRPBTC short-term updateXRPBTC pair showing a bearish flag formation, could go down on the short term to test the support level of around 2000 sats.

XRPBTC RSI Vs PRICEPrice looks bullish with a potential bullflag
RSI suggests a downward move with a head and shoulders structure
Regardless XRP is very cheap at these levels and can be seen better on the USD pair of XRP, i will link below
Price at resistance levelPrice at resistance level and possible to bounce back. Trade at your own risk. Use proper money management for better result.
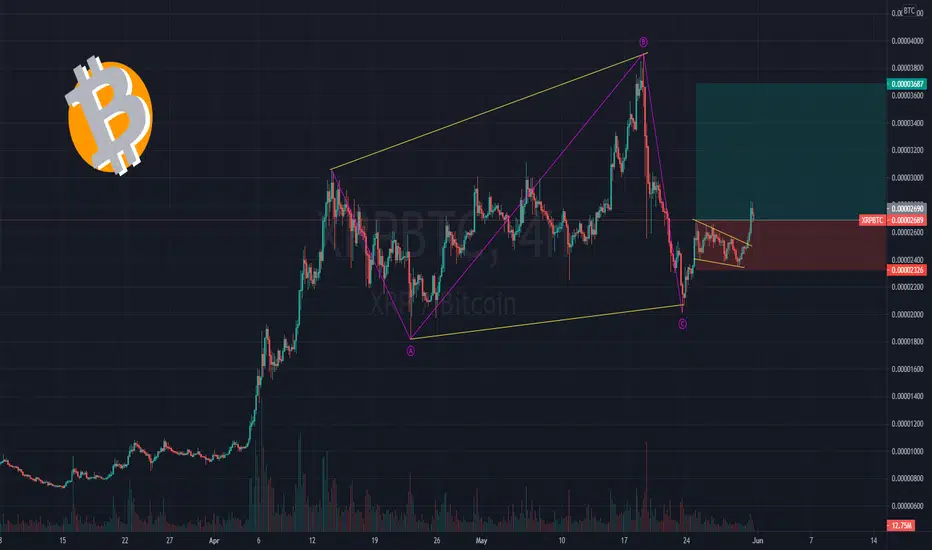
XRPBTC - 12 HWe have a possible bullflag on the 12 H. We need to break the supply zone and we should see a nice rally.
For every new follower i will add a new idea :)

XRPBTCEngineering Robo is bearish, as long as candles above support line no rush to sell. If planning to buy wait for buy signals.
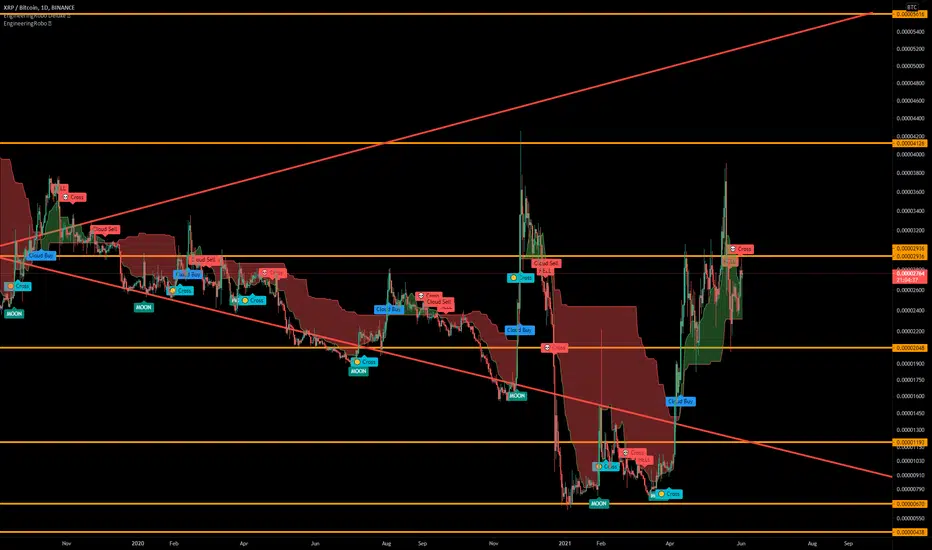
XRPBTCEngineering Robo is bearish, as long as candles are above support line there is no rush to sell. If you are looking to buy, wait for the buy signal.

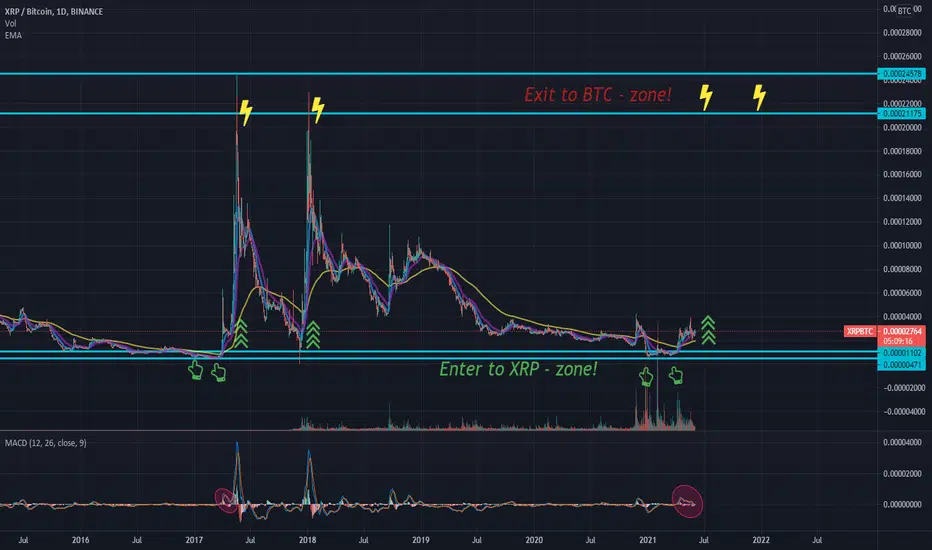
Time for double your Bitcoin! by XRPHello today.
I wanna share with you my prediction and as you see on the chart we are near entry zone, you can double your bitcoin if you enter XRP.
Good luck!
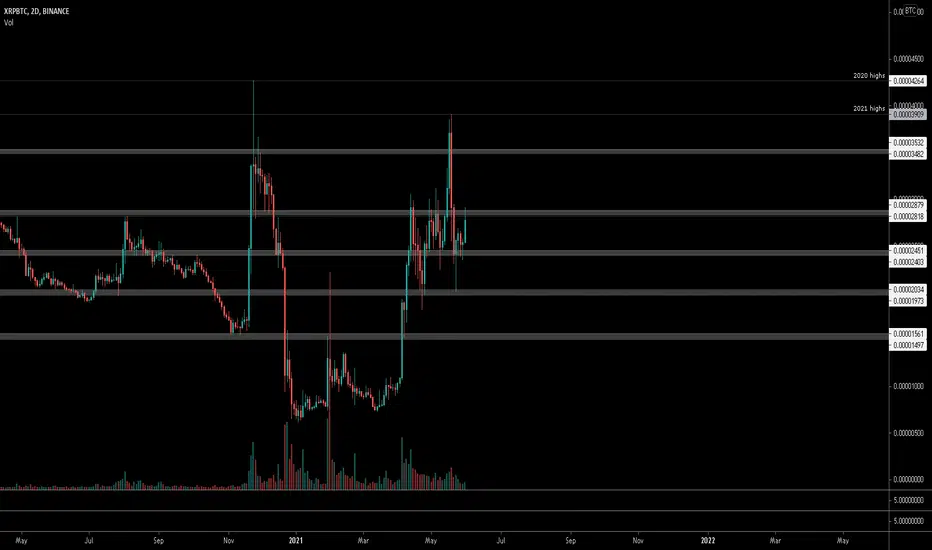
#XRP, hodling/bouncing on the ~2400-2800 range#XRP
hodling/bouncing on the ~2400-2800 range
A break above or below this levels could lead to some new opportunities..
UCTS closed a 1D trade (Buy to Sell signal) on around ~170% while 2D is still 50% up
$XRP
XRP could move quicklyBreaking with confidence trough the ascending triangle, could push XRP to test the previous levels, with a somewhat bullish BTC.
XRP looks like it will run on top the next really! Look at XRP today. We are currently crossing our MA resistance and pumping our way higher to the next fibo resistance.
So xrp has in the lást months a lot of problems with sec. It looks like we will see some news in the near future regarding the lawsuit.
A good conclusion would instantly push the price to new highs. So keep in mind. we are up already 10%. Maybe cost average would be a good way to get the risk away.
As always have a nice day and leave a follow for daily news
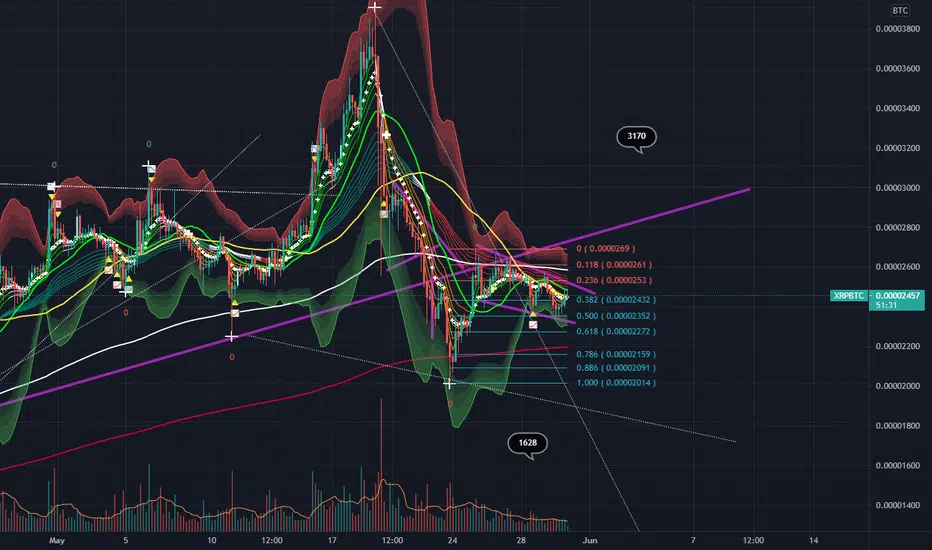
where are we heading? 3150 sats or 1628 sats? Bull Flag formingwhere are we heading? 3150 sats or 1628 sats? Bull Flag forming
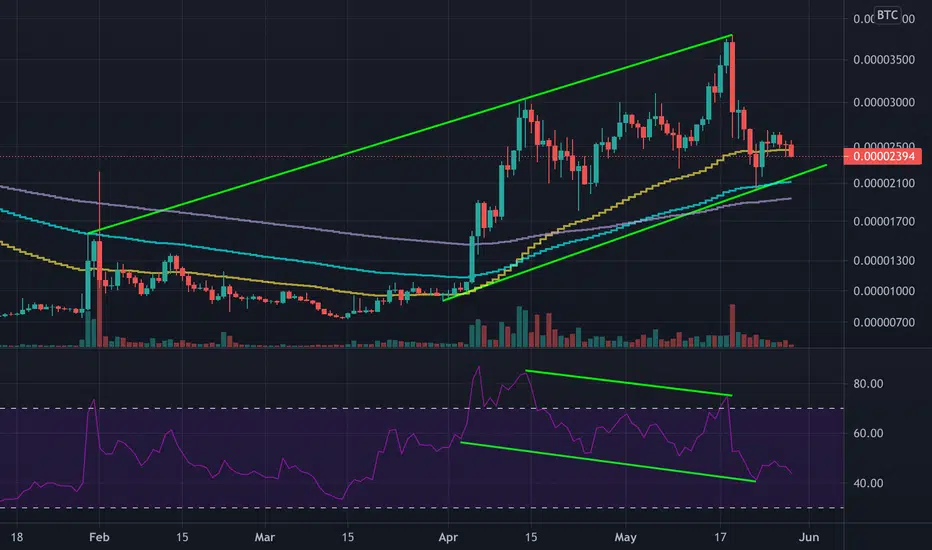
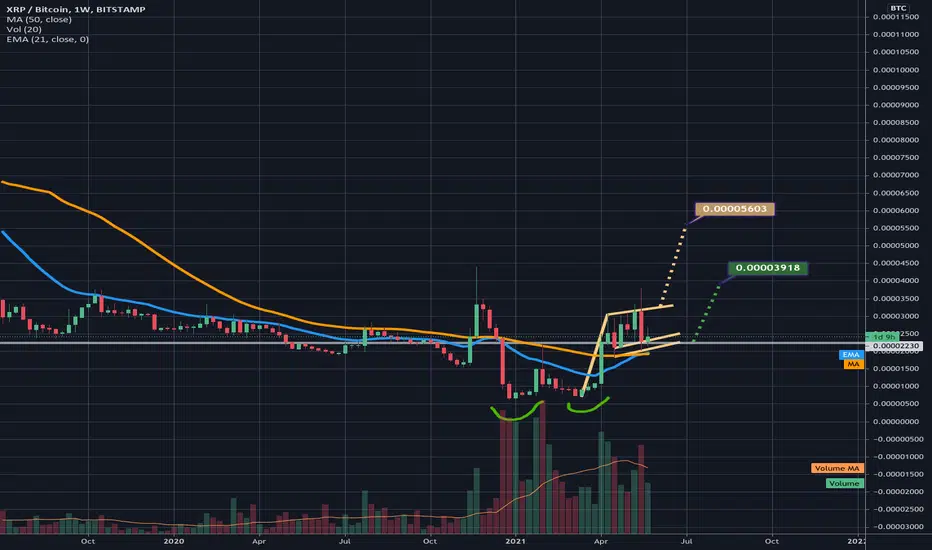
XRPBTC in both a doublebottom & a bullflag pattern on the weeklythe green measured move price target is for if we confirm the double bottom breakout...the tan colored breakout is if we confirm the bull flag breakout...odds arew good if we trigger the double bottom breakout we will in turn then trigger the bull flag target as well. Price action is still currently retesting the double bottom neckline as support whioch increases the probability of a bullish breakout...should we reach the bullflags measured move target xrp will make a 73% gain against bitcoin as well as secure a higher high on the weekly...both would be very bullish developments for xrp.
short term idea for XRPyou can short xrp for short term if it retest our support it can go up then you take long position. If XRP break the support level we can get easily 20 to 30% more droup down in XRP.
Remember
it is a short term analysis so act as short term.
more ideas on this analysis welcome in comment section.