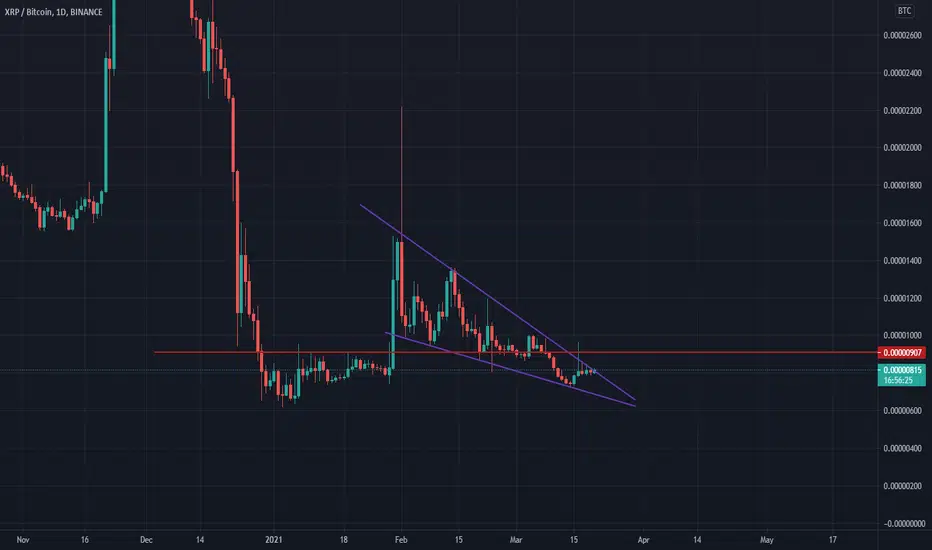
SUPER BULLISH!!! Breakout of a falling Wedge imminent!Hello Traders, this is Ripplayer.
XRP is getting closer to breaking the falling wedge that was created since February.
This is a very very bullish bullish pattern for XRP.
Successful Breakout will take XRPBTC above the redline 0.00000908btc and Price above 0.52cents in XRPUSD.
I will update further analysis!
Please like, subscribe and share your ideas and charts with me!
Have a good day and good trading, all the best!
DISCLAIMER!
Information provided is only educational and entertainment purposes. It should not be used to take action in the market.
XRPBTC trade ideas
[ENG] XRP BREAKOUTOUT COMING. 1 Day Hidden Bullish DivergenceTitle and charts says it all. Hold my hand.


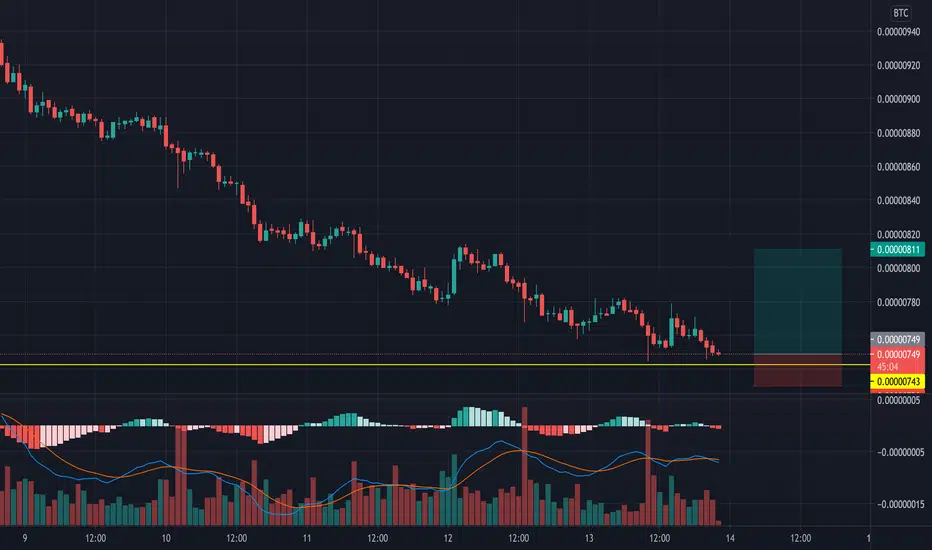
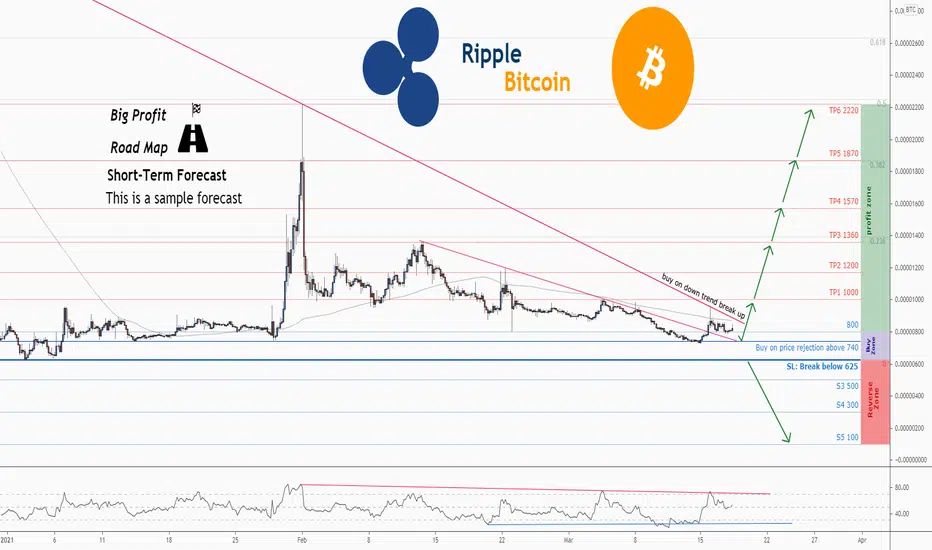
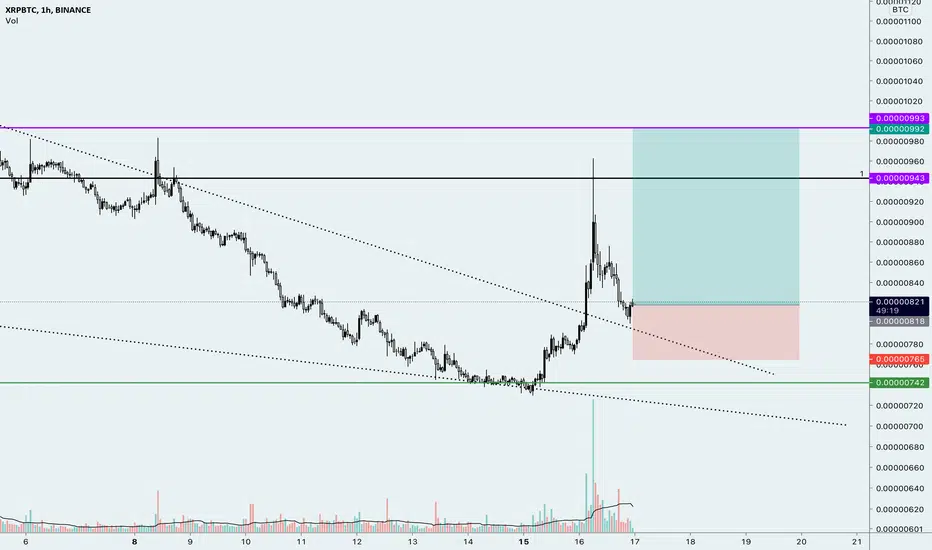
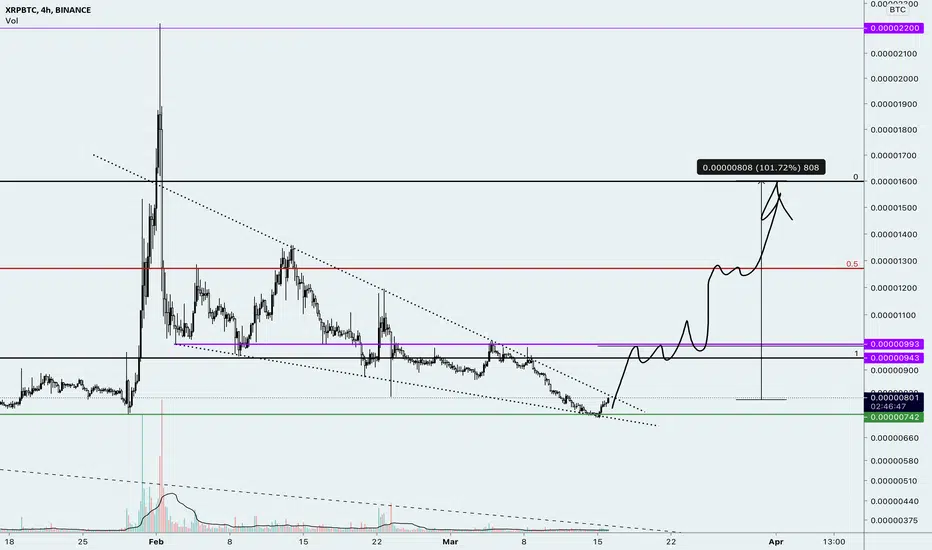
💡Don't miss the great buy opportunity in XRPBTCTrading suggestion:
". There is a possibility of temporary retracement to suggested support line (740).
. if so, traders can set orders based on Price Action and expect to reach short-term targets."
Technical analysis:
. XRPBTC is in a range bound and the beginning of uptrend is expected.
. The price is below the 21-Day WEMA which acts as a dynamic resistance.
. The RSI is at 54.
Take Profits:
TP1= @ 1000
TP2= @ 1200
TP3= @ 1360
TP4= @ 1570
TP5= @ 1870
TP6= @ 2220
SL= Break below S2
❤️ If you find this helpful and want more FREE forecasts in TradingView
. . . . . Please show your support back,
. . . . . . . . Hit the 👍 LIKE button,
. . . . . . . . . . Drop some feedback below in the comment!
❤️ Your Support is very much 🙏 appreciated!❤️
💎 Want us to help you become a better Forex trader?
Now, It's your turn!
Be sure to leave a comment let us know how you see this opportunity and forecast.
Trade well, ❤️
ForecastCity English Support Team ❤️
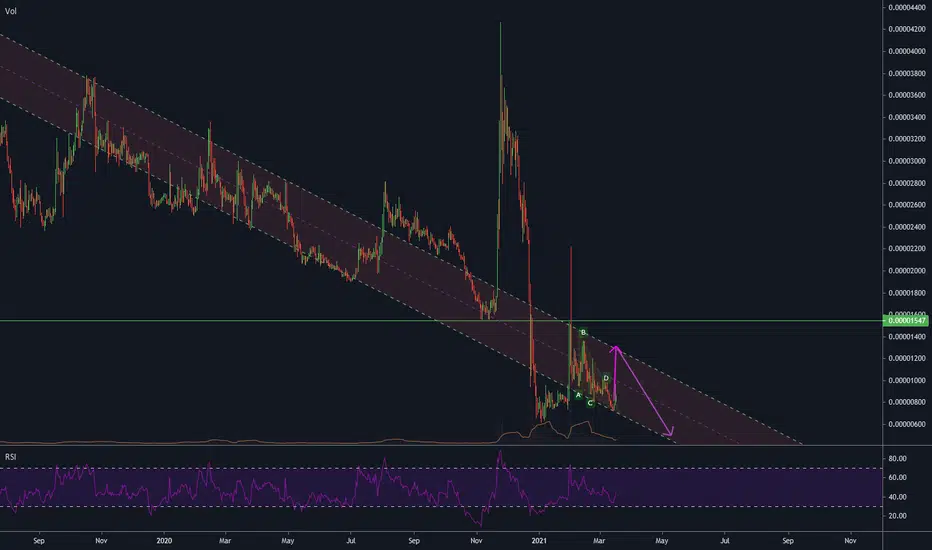
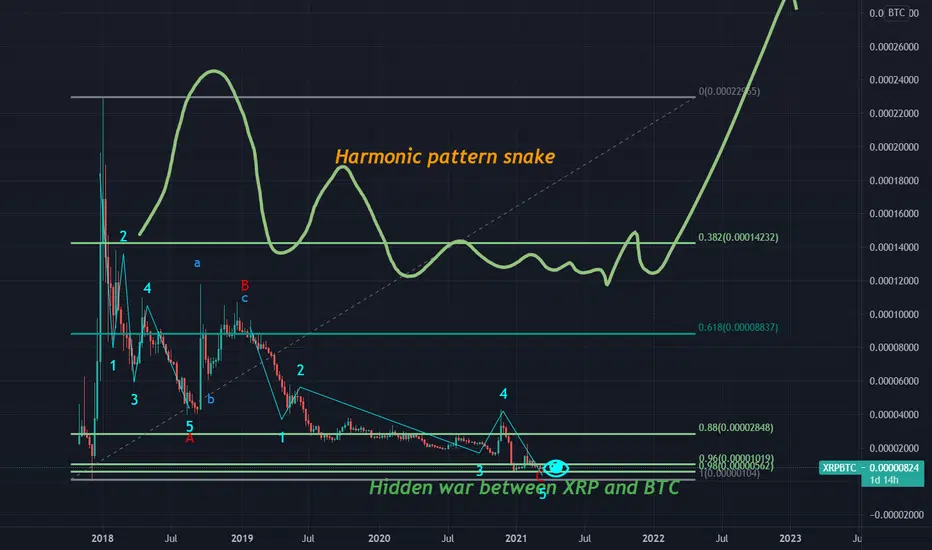
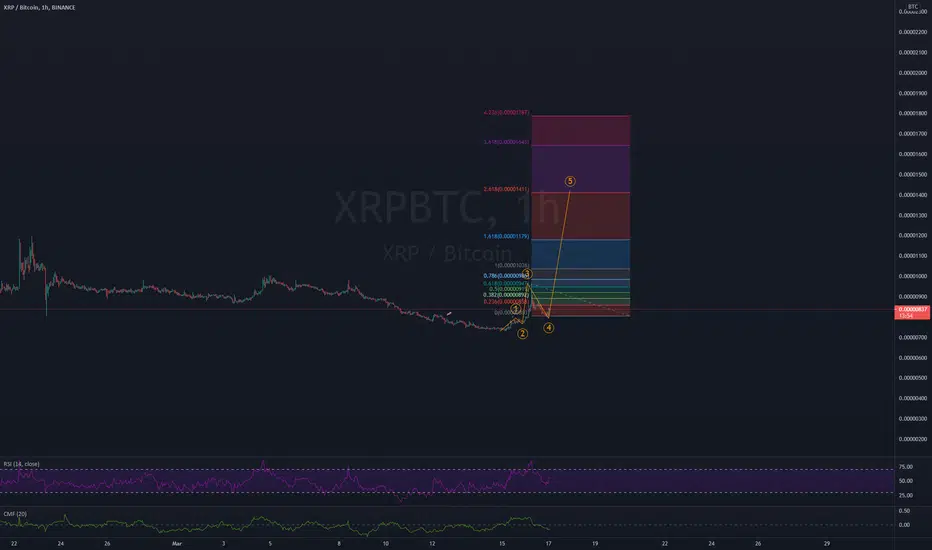
XRP/BTC LONG IDEAElliot wave anaysis of XRP/BTC. , Target just points to a price, not time relevant , although it should be fast if its history is anything to go by
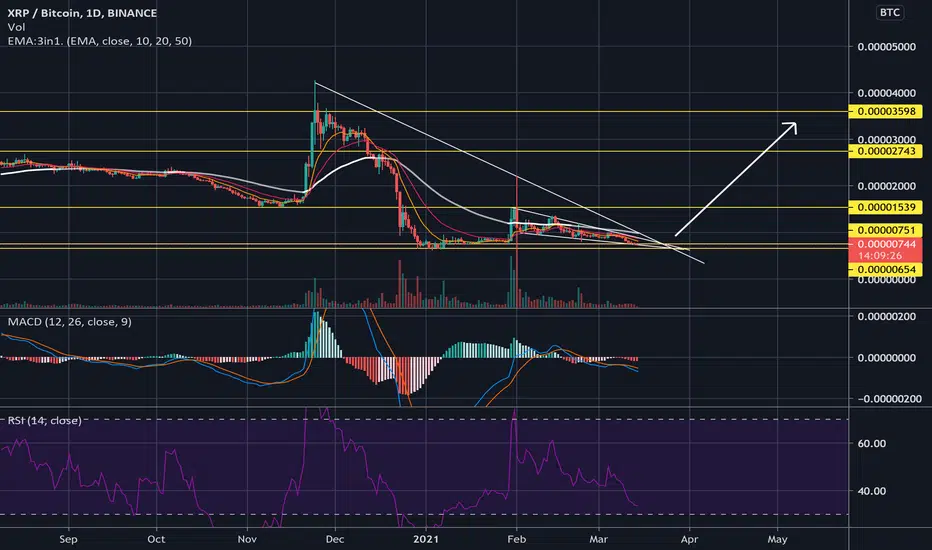
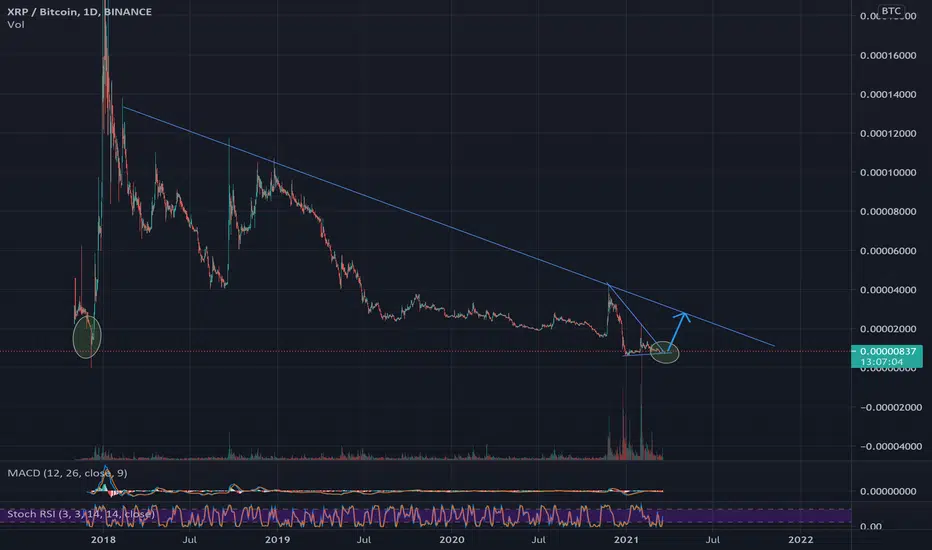
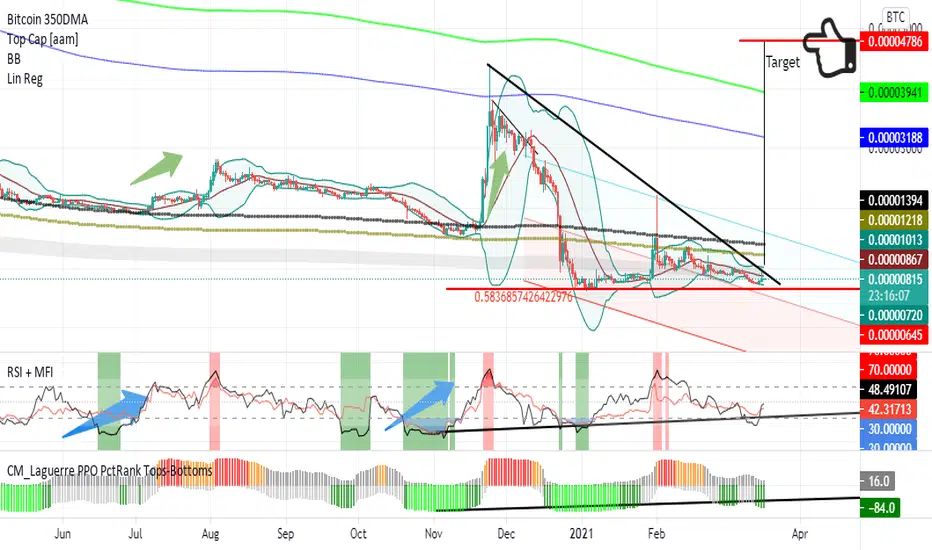
$XRP to break Flag?Following bullish divergence (see post below)
If it does soon target 0.00004800ish
and in fiat terms if BTC Was to stay at $60k = XRP $2.88
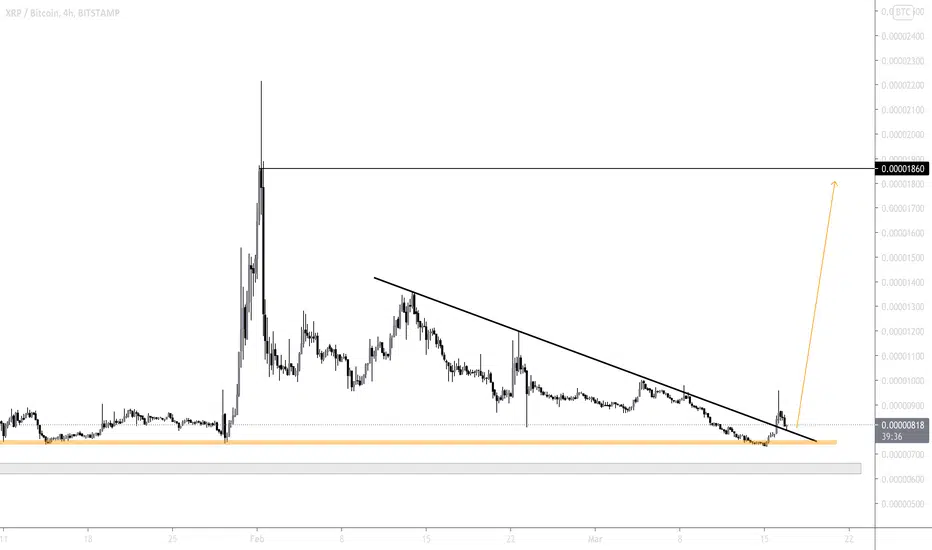
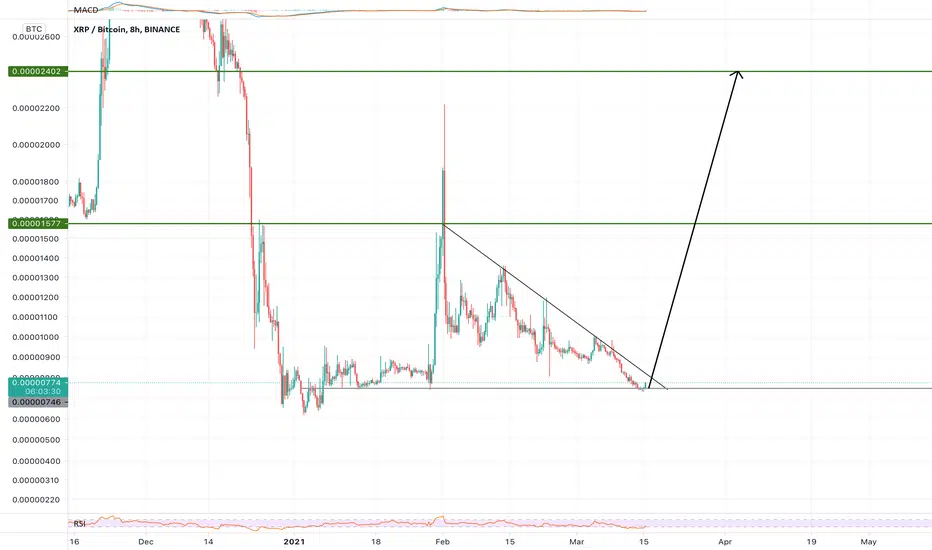
Is xrp next in this bullrun?XRP/BTC chart is looking good.
We found support on the trendline & we can see a 120% increase anytime if we stay above it.
XRPBTC - Quick 20% Trade Anyone?XRP just broke out of a falling wedge and looks like its confirmed it as support. So...
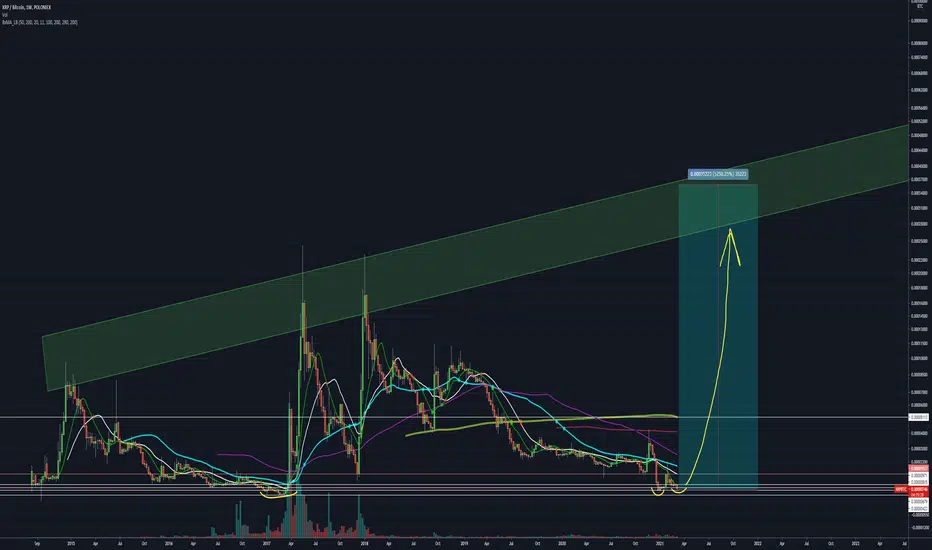
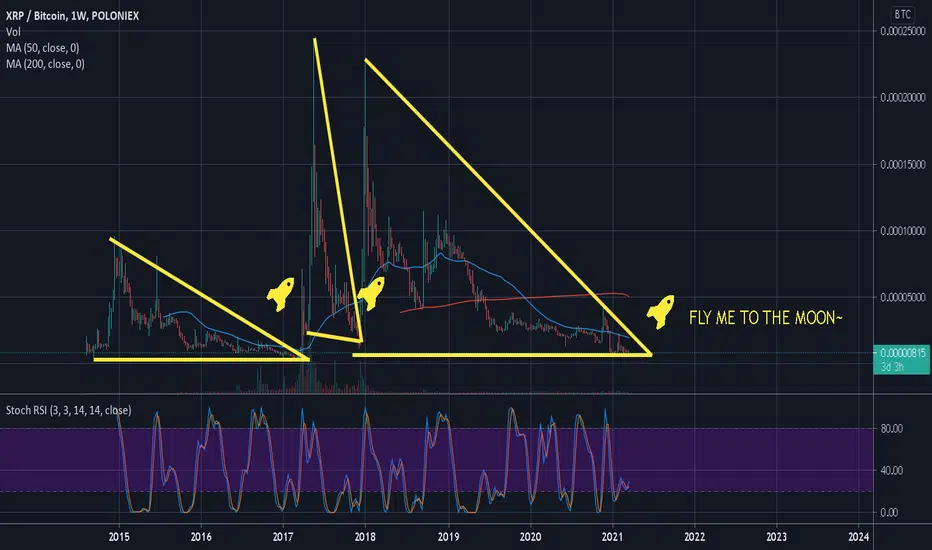
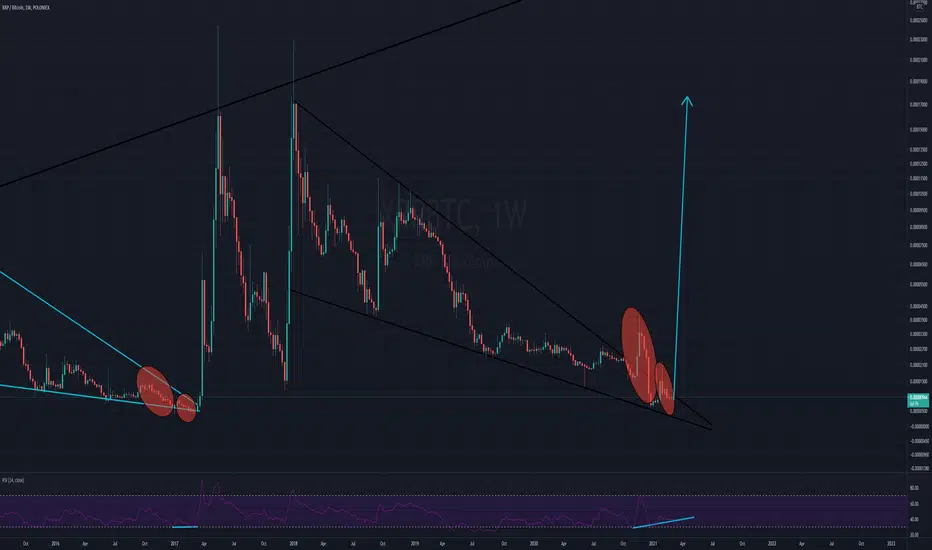
XRP: Breakout time is approachingThere is a massive bullish divergence on the weekly timeframe in the XRPBTC chart.
We can also see a quite similar fractal pattern to early 2017: Two fake outbreaks with subsequent dumps. In 2017 it was more benign that this time, but back then the timescale was also longer.
This was now amplified because of the commotion with the SEC.
But note how fascinating: Despite the SEC turmoil, XRPBTC prints a setup which is remarkably similar to the one in early 2017.
Similar double peak pattern, similar bullish divergence in the RSI.
This time however, the bullish divergence in the RSI is a lot stronger than back then.
The coil has been stretched much further this time, than back then. And a coil that is stretched too far, bears great force within, ready to explode with the utmost imaginable power!
I assume that XRPBTC will now start printing first a small green weekly candle. Then a larger one. Then an even larger one.
How high it will go and how long it will last, of course also depends strongly on BTC.
Will BTC do a 2013 or 2017 repeat? That will also determine if XRP will do one single gigantic rally, or two rallies, like back in 2017/18.
I think the conservative target for XRPUSD is 10 USD in this bullrun, this is a lower limit.
However, if BTC does a double rally, and indeed reaches prices as crazy as 200k, an upper limit for XRPUSD would be, as crazy as it sounds, 40-50 USD.
I will keep a close eye on BTC, and XRPBTC, to determine how high XRP can go this cycle.
Note: I think the entire SEC thing will have no effect whatsoever on the price action.
Maybe some short-term action, but the end price will reach these values no matter what the outcome will be.
The SEC Vs. XRPThis is overall proof of the effect the SEC Lawsuit has had on the Value of XRP when compared to historical data.
It is important to note that this information actually errs on the side of the SEC, meaning the effect is worse than being presented to eliminate any XRP bias.

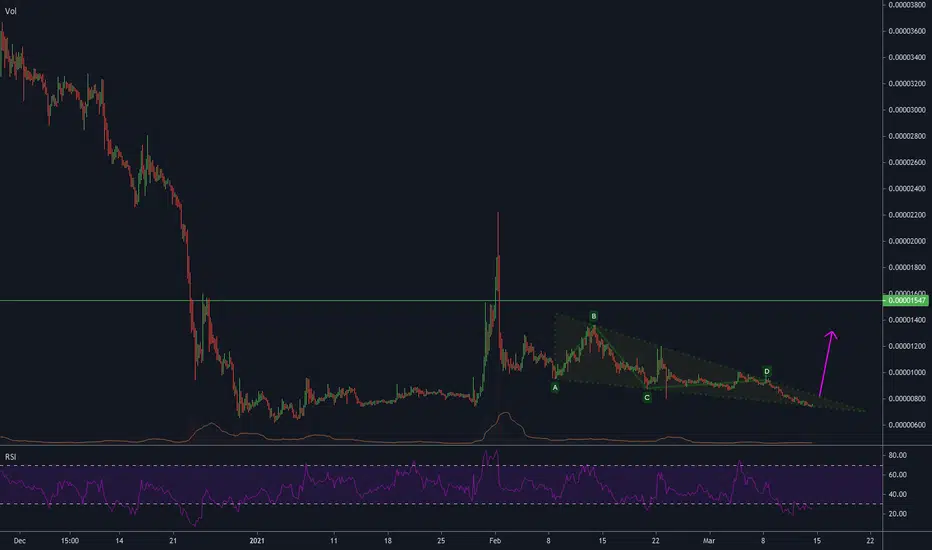
XRP/BTC - Ready For Altseason? Hi, we are in a beautiful triangle right now and we saw yesterday that the support level 742 held very well. Today we got a big push from the support level and if we break the trendline in the next couple of days, then we are ready to takeoff. We are going to see XRP outperforming BTC in coming weeks with RSI around 30, it indicates that XRP is oversold and undervalued. So be patient and don’t panic 🙌🏼
greedy Whales vs XRP army of HOLDERS!!! XRP / BTC 50x gainsAt the moment I don't have and didn't have XRP, but after thinking about the SEC situation, I will create a huge bag of XRP!
this idea only came to me because the SEC filed a case against xrp and now holders are being squeezed out of XRP (XRP has the largest army of holders). This is done simply: the pair to bitcoin always falls, and the dollar stays in place and also falls, while the rest of the ALTA makes a lot of profit, forcing people to sell the asset for a penny in order to buy what is growing.At this time, xrp is accumulating. big players are saving up for a future pump that we can't even imagine in our worst dream. I believe that a very dirty game is being played here in relation to the holders, and I will buy this asset in tons! entry points into bitcoin!
Believe me, if they have a shopping and entertainment center in their hands, then these guys are very serious, I can't believe how influential people play crypt here. They came up with this whole fairy tale just to shake out the holders at the bottom of the market! NOW ALL XRP HOLDERS are at a loss to BITCOIN!
1)745 sat 33%
2)575 sat 33%
3)460 sat 33%
TARGETS -> GREEN BOX!