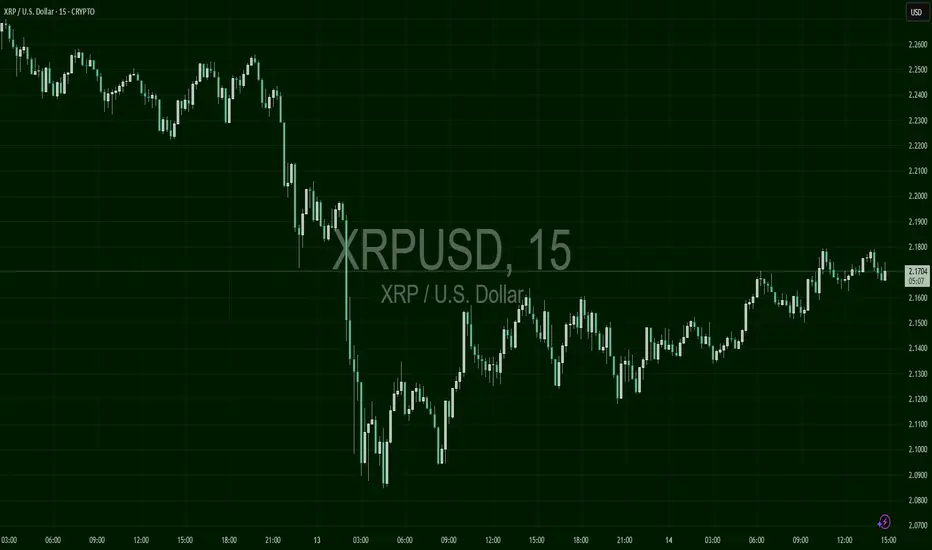
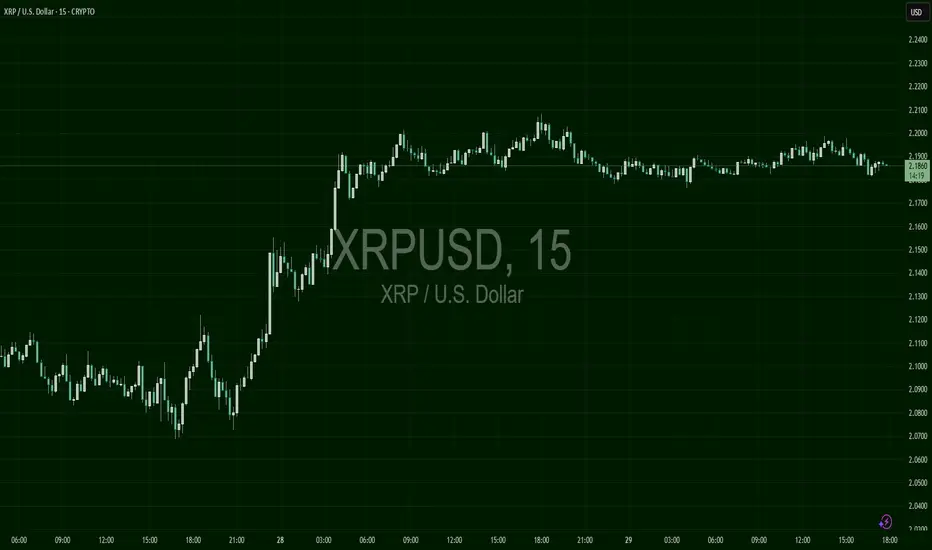
Bearish Setup Forms for XRP Below $2.21FenzoFx—XRP trades around $2.18 after forming a long-wick bearish candlestick above $2.17 support.
Stochastic reads 83.0, indicating overbought conditions. A close below $2.16 with a bearish engulfing candle could lead to $2.08. A close above $2.21 would invalidate the bearish outlook and open the door to $2.33.
XRPSOL_M4KGN3.USD trade ideas
Head & Shoulders Breakdown in Progress, Eyes on 1.83 and 1.61XRP is showing a classic Head and Shoulders reversal pattern, which has now broken down below the neckline, indicating a potential bearish continuation.
🔻 Bearish Structure Highlights:
The head and shoulders formation is well-defined and price has confirmed a neckline break.
The breakout is occurring within a descending channel, aligning with the broader bearish context.
Momentum oscillator (DTosc) is also turning down after a lower high, supporting the bearish case.
📉 Targets:
First target: 1.83580
Extended target: 1.61184
🔴 Invalidation Zone:
A daily close above the right shoulder and key resistance at 2.3589–2.4829 would invalidate this bearish view and signal potential reversal.
📌 Trade Plan:
Favoring short setups below the neckline
Targeting the support levels noted above
Stop-loss suggested above 2.48 for conservative risk control
The setup offers a clean risk/reward opportunity based on a textbook bearish reversal pattern.

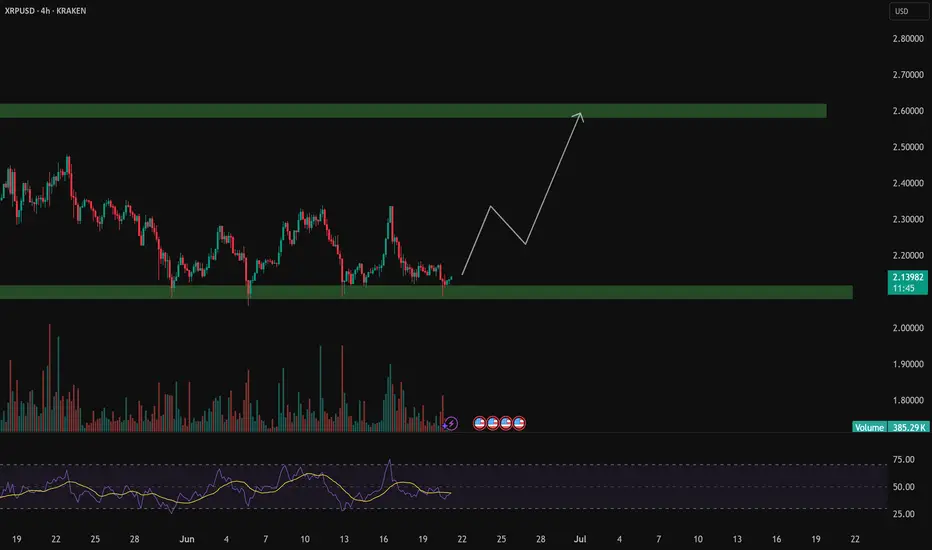
XRP LongOverall the coin is sideways but bullish div in 4H and holding the support suggest upside move from here. Also there is bullish Hammer at this support level.
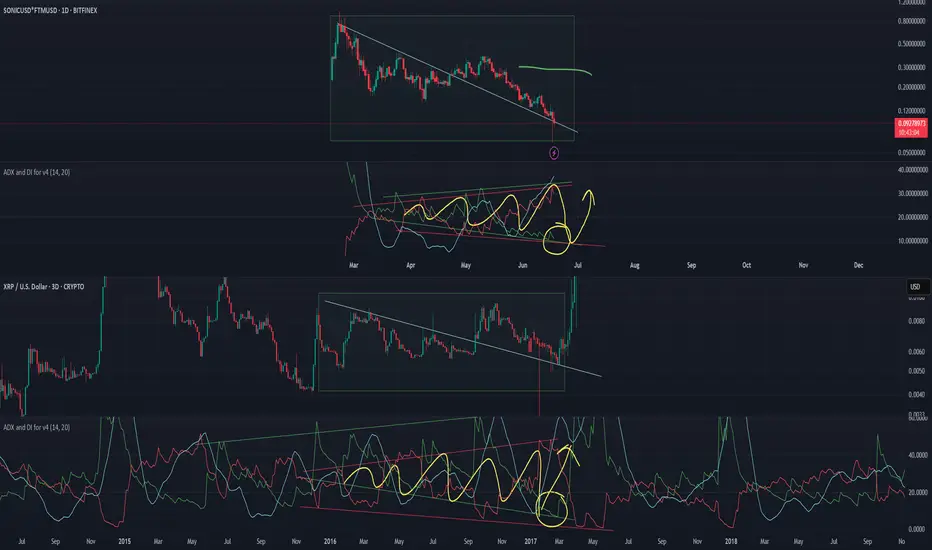
XRP folks, Sonic / Fantom is nextADX reading is identical, just on different frame. This is one of those alts that normally holds its price instead of doing classic dump.
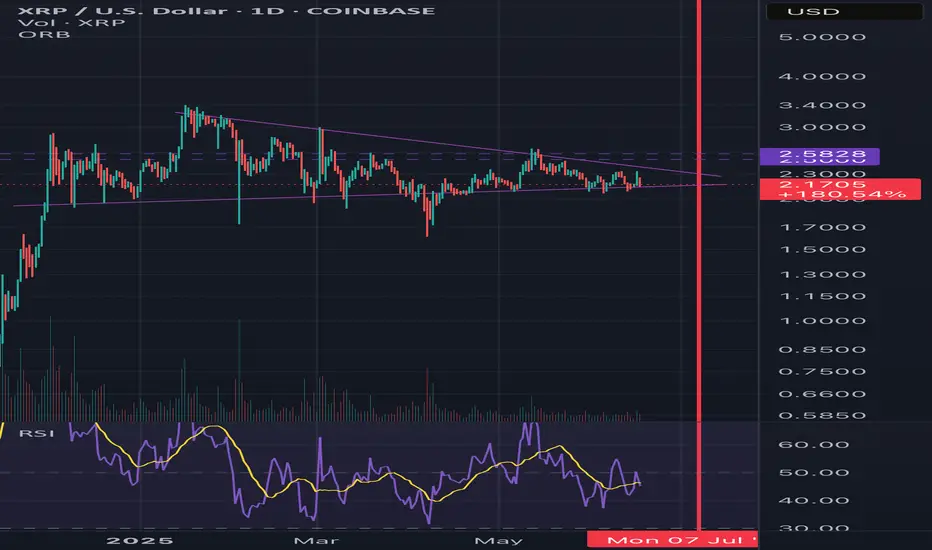
XRP still BULLISH and on track to $8Chart speaks for itself. Huge bull flag. Consolidation! Holding $2 support. RSI looking good with plenty of room to run up!!! Price coiling up for further discovery and ATHs. LFG!!!
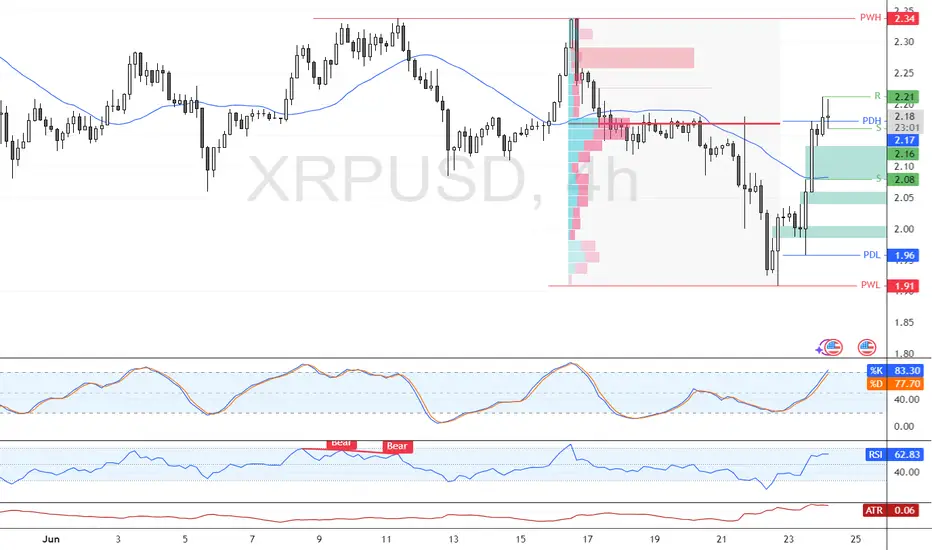
XRP Builds Bullish Outlook as $2.08 Support Holds StrongFenzoFx—XRP bounced from $2.14 and trades near $2.17, approaching resistance at $2.19. The market remains bullish above the $2.08 critical support. A close above $2.19 could lead to targets at $2.23 and $2.24.
The bullish outlook is invalidated if XRP/USD closes below $2.08.
ripple trade 4 i actully had my set up perfectly at my surport line but i forgot to upload it but this looks like its on track anyway belive it will test the highjer resistance level lets keep watching
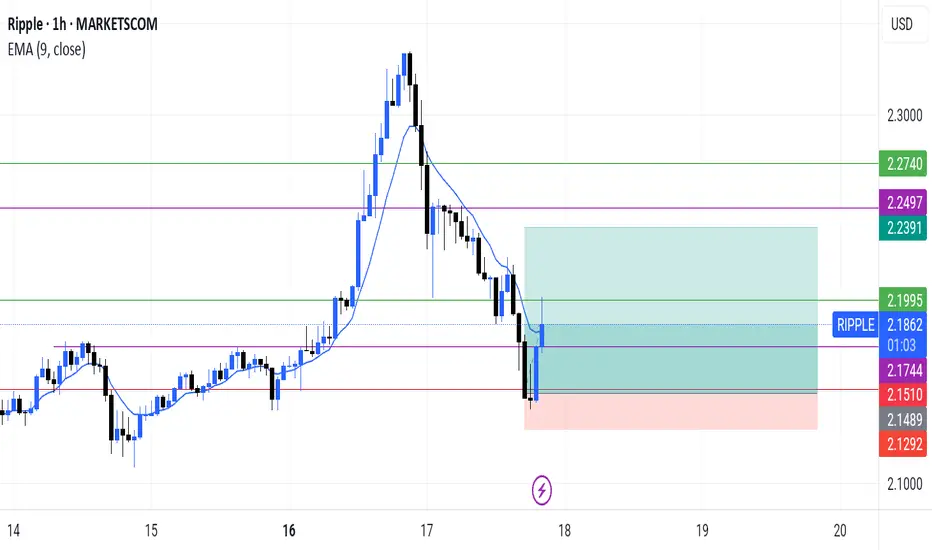

ripple TRADE 4 absultley smashed it with this trade i have had published late again but i do belive you could get into it now and catch the retracment back down bearish again this shit like clock work up down up down up down

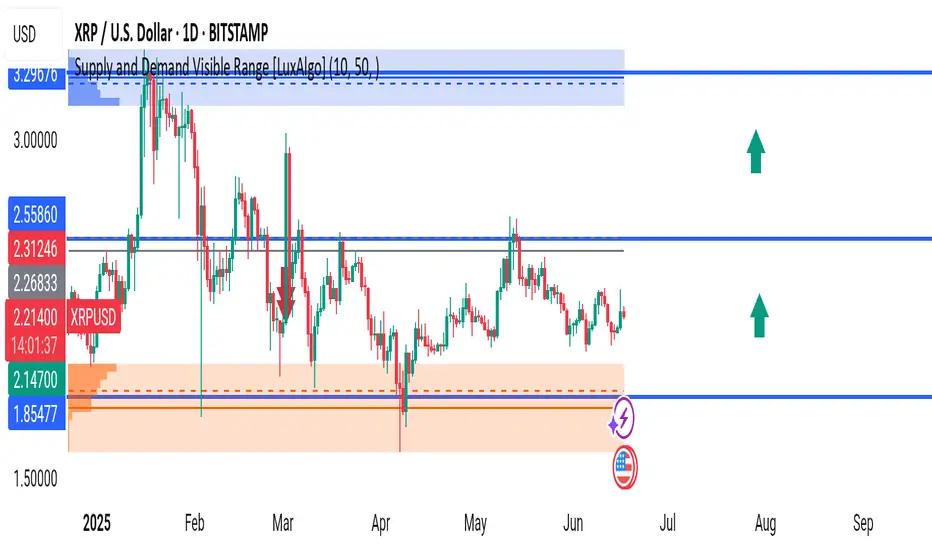
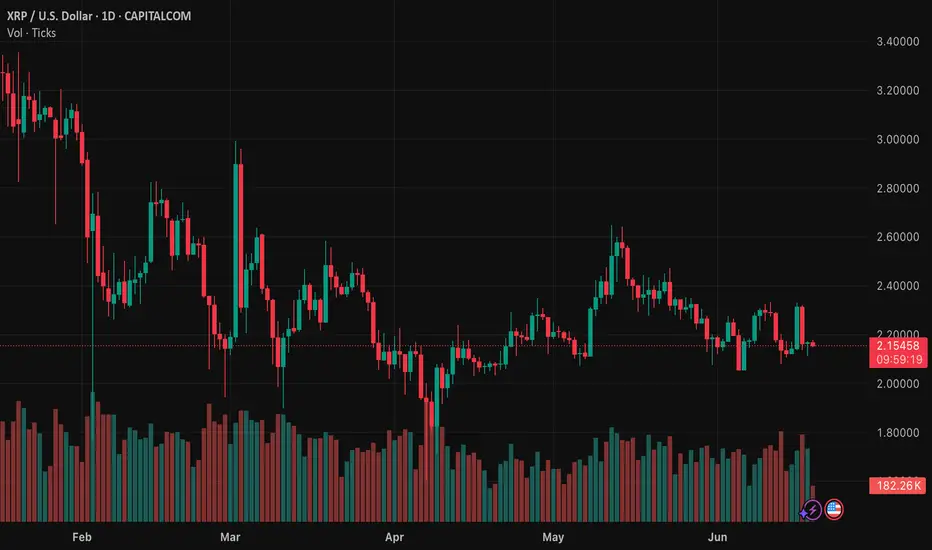
XRPUSD Daily Analysis – Bullish Setup Forming Inside Key Range!XRP is currently trading at $2.2138, consolidating just above a critical demand zone and preparing for what could be a strong bullish breakout. The range-bound structure is tightening, and pressure is building for the next major move.
🔍 Key Technical Insights:
🔹 Major Demand Zone (Support) – $2.1470 to $1.8547:
Price has bounced multiple times from this orange demand zone, showing consistent buying interest and strong liquidity protection. It’s acting as a base for a possible bull rally.
🔹 Mid-Range Resistance – $2.5586:
This level has held firm since March. A clean breakout above it could attract massive volume and bullish continuation.
🔹 Final Bullish Target – $3.2967:
A powerful supply zone resides here, which is also the yearly high area. If XRP breaks $2.55 convincingly, we may see a strong push toward this zone.
🔄 Current Price Action:
Price has been accumulating sideways between $2.15 and $2.55.
Volatility is contracting, indicating a possible breakout ahead.
Recent candle rejections suggest buyers are stepping in at every dip.
📊 Trade Plan:
🔽 Buy Zone: $2.15–$2.20 (near demand)
🔼 Take Profit Levels: $2.55 and $3.29
🛑 Stop Loss: Below $1.85 (break of demand)
🧠 Fundamental Context:
🗓️ With major U.S. news events around the corner, volatility may spike. XRP could ride a wave of positive momentum, especially if sentiment improves toward altcoins. Keep an eye on regulatory headlines as well – XRP tends to react sharply.
---
💬 Are you loading your XRP bags here or waiting for confirmation?
Comment your analysis below! 👇
📌 Follow me for more crypto setups and price action strategies.
#XRPUSD #CryptoAnalysis #Altcoins #Ripple #PriceAction #DemandZone #BullishSetup #LuxAlgo #FrankFx14 #TradingView
XRP/USDT 2nd round bullish trendThis pair is due for its 2nd round upward trend.
July onwards should be bullish.
Let's see what happens.
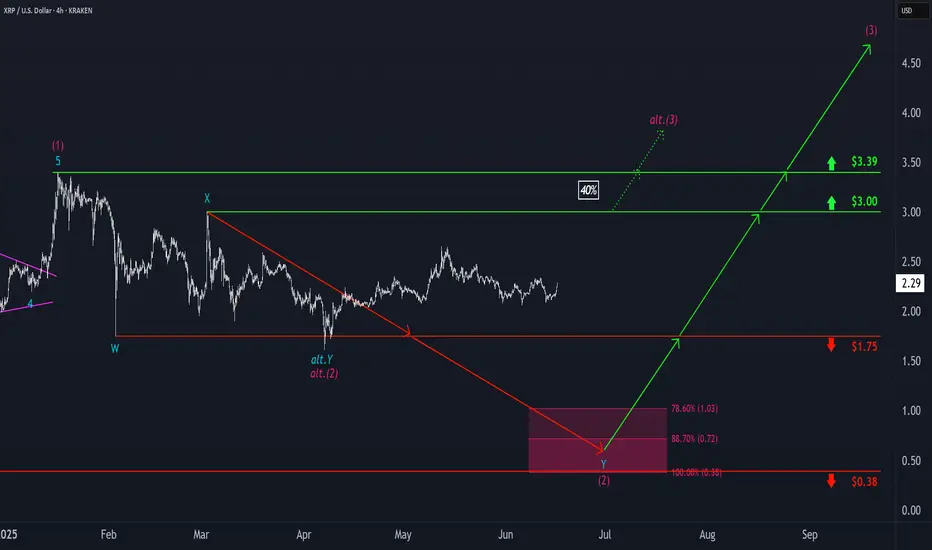
Ripple: Lower Low ExpectedWe still expect magenta wave (2) to conclude within the magenta Target Zone between $1.03 and $0.38 – a range we consider attractive for long entries. That said, there's a 40% probability that magenta wave alt.(2) has already bottomed. If so, a direct breakout above resistance at $3.00 and $3.39 would confirm this alternative scenario and suggest that the corrective phase is already behind us.
📈 Over 190 precise analyses, clear entry points, and defined Target Zones - that's what we do.
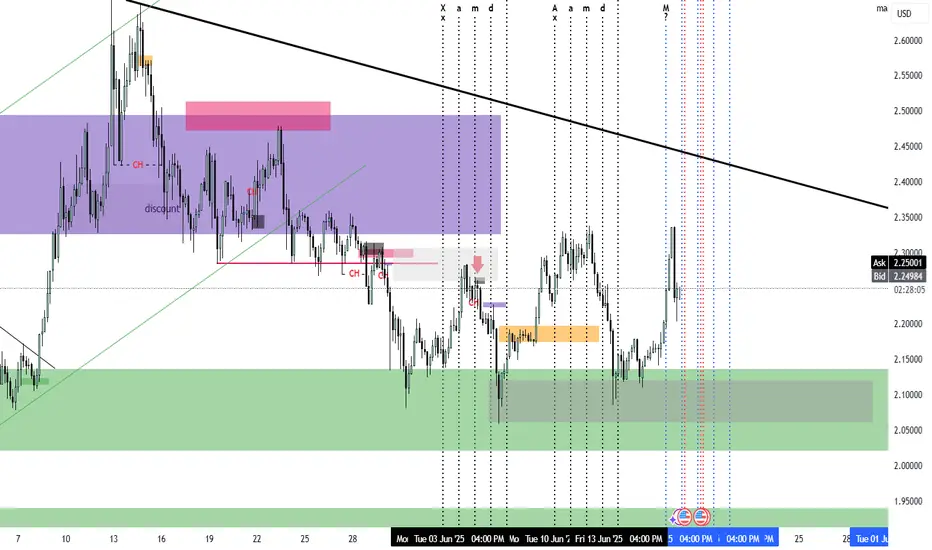
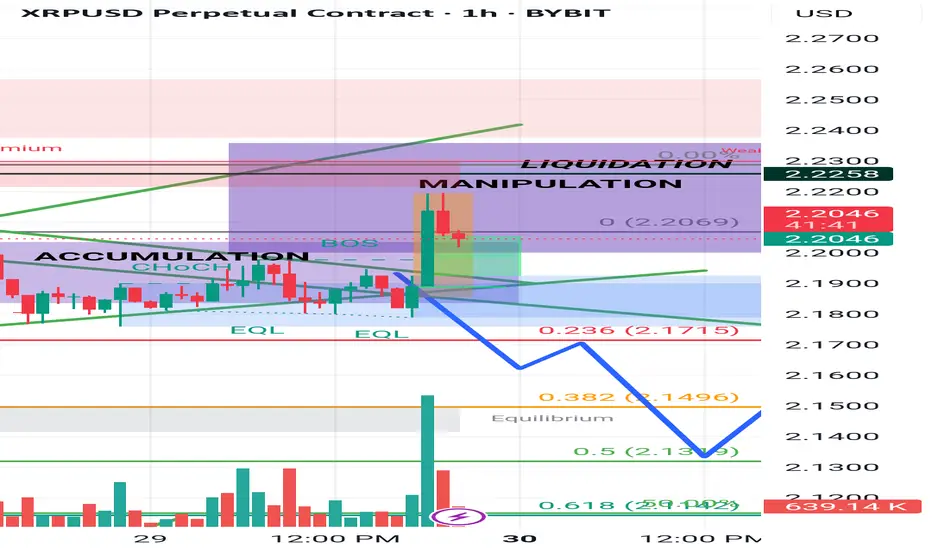
XRP LIQUIDITY SWEEP before breakdownThis is a classic example of the liquidity sweep. As you can see the price was in an accumulation phase, then a manipulation phase where institutions push the price up temporarily to grab the liquidity sitting above or below, in this case above, the accumulation phase. This extra liquidity will help fuel the push down. Let me know your thoughts guys! 👍
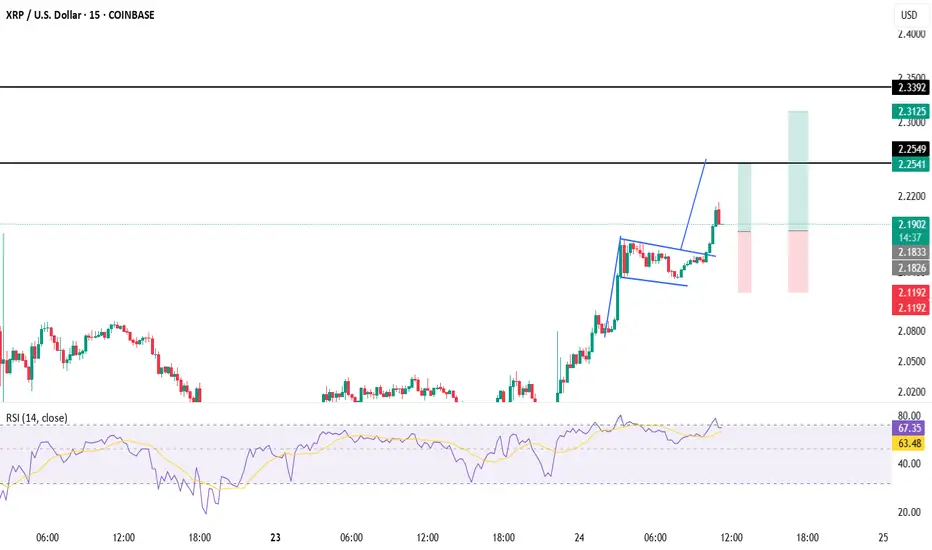
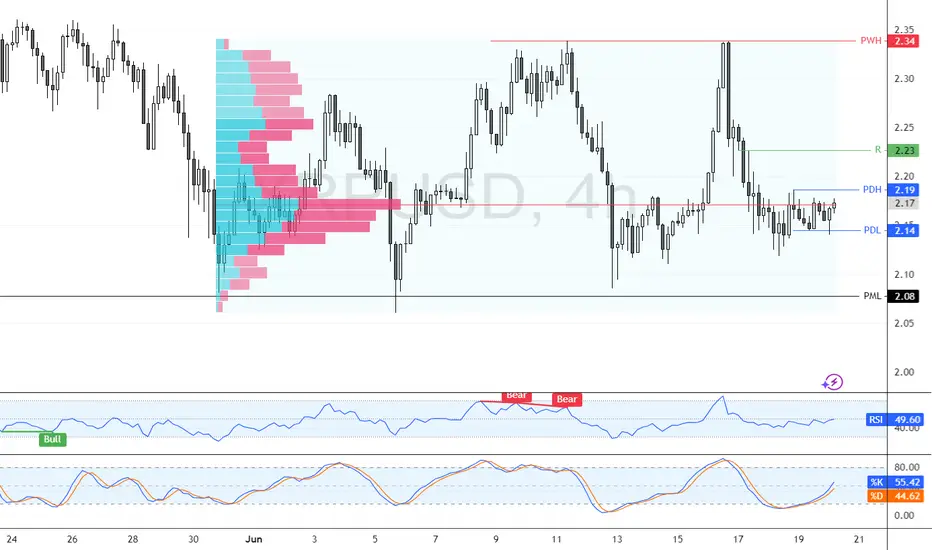
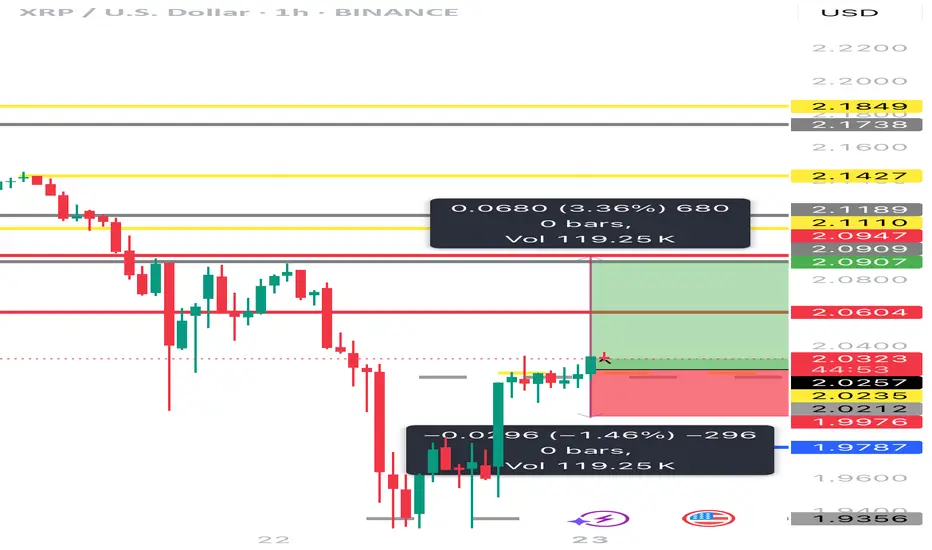
XRPUSD – Squeeze After SurgeXRP exploded out of a compression base near $2.04 and surged to $2.19 before stalling. Price has since gone flat in a very tight $2.17–$2.19 band, suggesting strong distribution or a bullish flag. Expect a big move: breakout above $2.195 could re-ignite the trend; a break below $2.165 opens downside retrace toward $2.12.
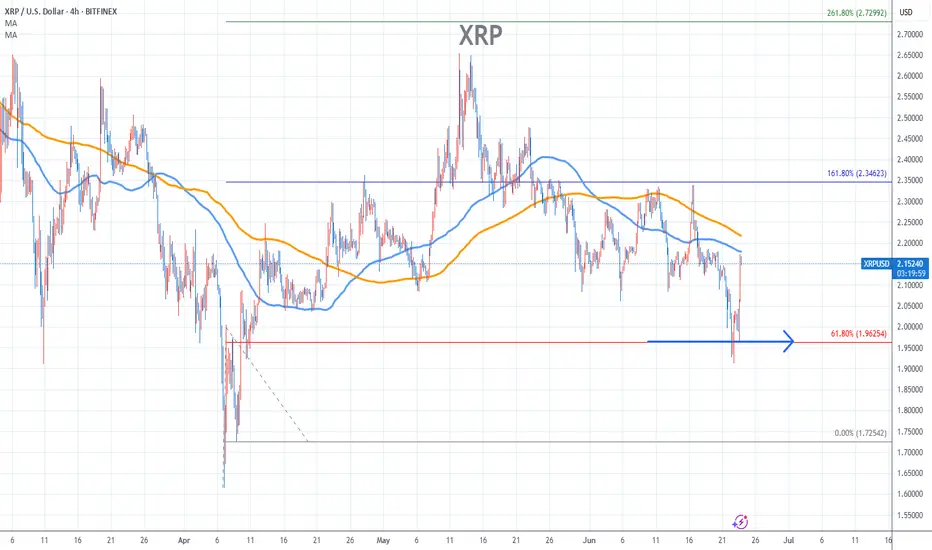
Ripple Stock Chart Fibonacci Analysis 062325Trading Idea
1) Find a FIBO slingshot
2) Check FIBO 61.80% level
3) Entry Point > 1.96/61.80%
Chart time frame:B
A) 15 min(1W-3M)
B) 1 hr(3M-6M)
C) 4 hr(6M-1year)
D) 1 day(1-3years)
Stock progress:A
A) Keep rising over 61.80% resistance
B) 61.80% resistance
C) 61.80% support
D) Hit the bottom
E) Hit the top
Stocks rise as they rise from support and fall from resistance. Our goal is to find a low support point and enter. It can be referred to as buying at the pullback point. The pullback point can be found with a Fibonacci extension of 61.80%. This is a step to find entry level. 1) Find a triangle (Fibonacci Speed Fan Line) that connects the high (resistance) and low (support) points of the stock in progress, where it is continuously expressed as a Slingshot, 2) and create a Fibonacci extension level for the first rising wave from the start point of slingshot pattern.
When the current price goes over 61.80% level , that can be a good entry point, especially if the SMA 100 and 200 curves are gathered together at 61.80%, it is a very good entry point.
As a great help, tradingview provides these Fibonacci speed fan lines and extension levels with ease. So if you use the Fibonacci fan line, the extension level, and the SMA 100/200 curve well, you can find an entry point for the stock market. At least you have to enter at this low point to avoid trading failure, and if you are skilled at entering this low point, with fibonacci6180 technique, your reading skill to chart will be greatly improved.
If you want to do day trading, please set the time frame to 5 minutes or 15 minutes, and you will see many of the low point of rising stocks.
If want to prefer long term range trading, you can set the time frame to 1 hr or 1 day.
Resistance roads with price points indication Can XRP break out?…….. Do you think XRP has a liquidity pool under its whale’s belly already?……. The foolish think it might happen but the inclination of a savvy veteran say: Where’s the location to the on-demand-liquidity? But that population must level up swiftly and efficiently because they know stagnant equals tardiness! No Resistance roads with price points indication analyzation necessary.! You either see the walls gardens or you don’t …………….. #ODL <swift
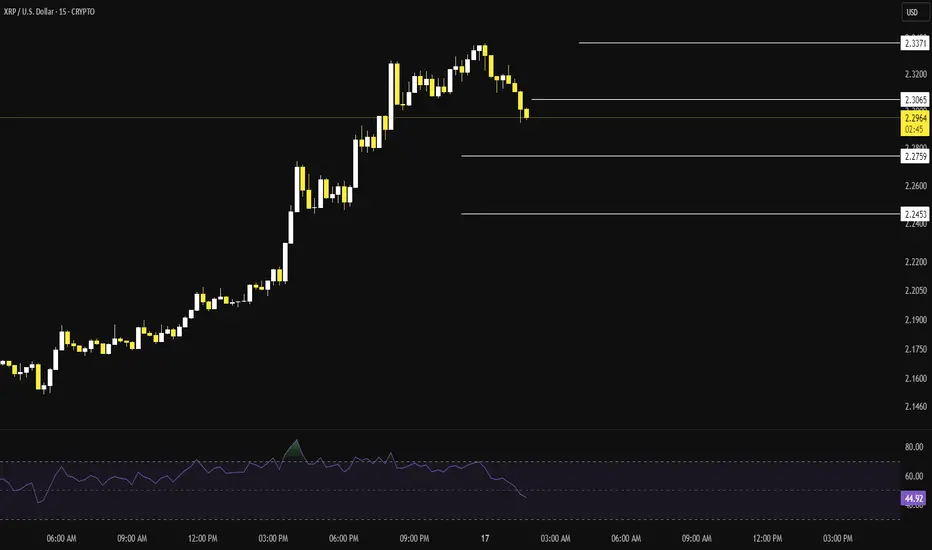
XRPUSD tested the Support line 2.1215 👀 Possible scenario:
XRP tested support at $2.12 and is now consolidating below $2.20. The price briefly bounced above the 23.6% Fib level from the $2.335 swing high but remains under pressure.
Despite the dip, XRP's fundamentals remain strong. It’s widely recognized for fast, low-cost cross-border payments and gained major institutional interest—including from the UN. Regulatory clarity after Ripple’s legal win against the SEC boosted investor confidence. XRP has surged 330% in the past year, and analysts see a bullish flag pointing to a potential breakout above $3.50 this summer.
✅ Support and Resistance Levels
Support level is now located at 2.1215
Now, the resistance level is located at 2.3370.
XBRUSD is moving within the 65.95 - 76.55 range👀 Possible scenario:
Oil prices eased on June 18, with Brent trading near $75.15 per barrel, as traders awaited the U.S. Fed’s rate decision and monitored Iran-Israel tensions.
The Feed is expected to hold rates steady, but concerns over slowing global growth and Middle East instability could influence future cuts. Analysts warn that conflict-driven price spikes may fuel inflation, complicating policy moves. Markets are also watching the Strait of Hormuz, a key route for 20% of global oil. While a full Iranian export hell could be offset by OPEC+ spare capacity, a blockade would severely disrupt flows, especially to Asia. Despite risks, Commerzbank noted the market remains well supplied, with slow demand growth and rising OPEN+ output. However, ongoing trade disputes may weigh on future demand.
✅ Support and Resistance Levels
Now, the support level is located at 65.95.
Resistance levels are now located at 76.55 .

Mantle, Toncoin, Fantom/SonicAn ungodly chart that could outperform market soon as did xrp in 2017. Add to that, chain link and Uniswap.

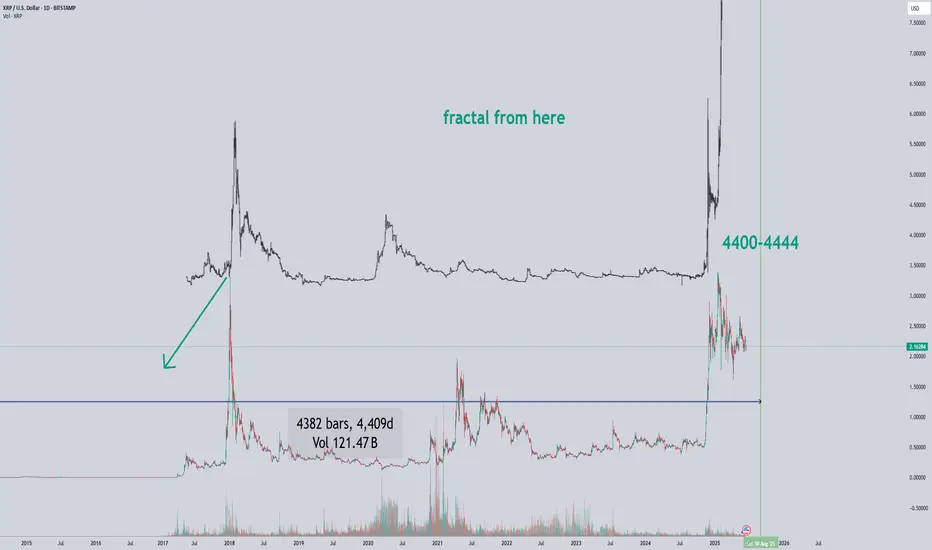
xrpusd - fractal from the beginning Everything is fractal: big repeats small, and small repeats big. So if you want to do something big, you start small, then go a little bigger to understand how it works and how forces of nature affect it. As a result, small machines were designed first, then large ones. The same applies to graphs and patterns. Strength lies in simplicity.
XRP Finds Base Near $2.10, Climbing CautiouslyXRP suffered a steep sell-off to around $2.10, but has since rebounded and is stabilizing near $2.17. While the upward grind shows buying interest, the structure is still weak and awaits a clearer breakout.