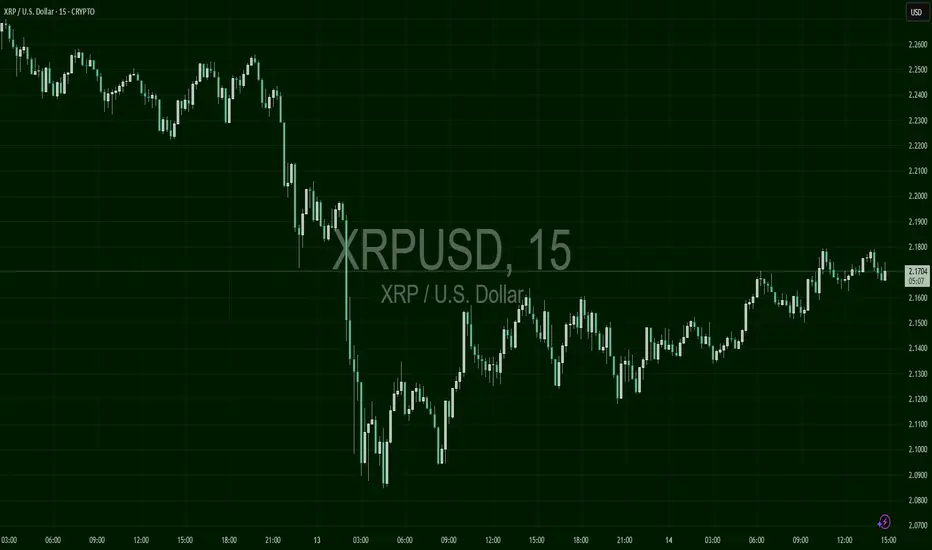
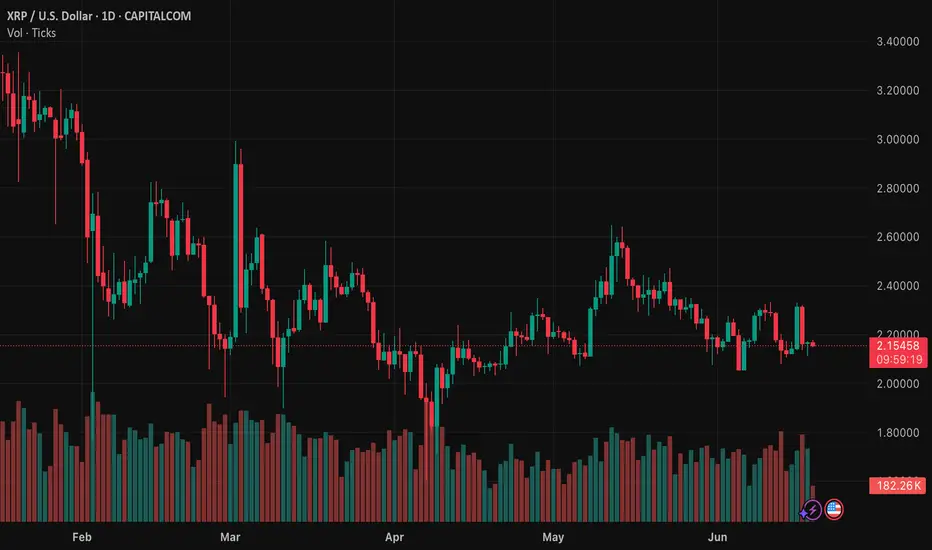
XRP Finds Base Near $2.10, Climbing CautiouslyXRP suffered a steep sell-off to around $2.10, but has since rebounded and is stabilizing near $2.17. While the upward grind shows buying interest, the structure is still weak and awaits a clearer breakout.
XRPUSD.P trade ideas
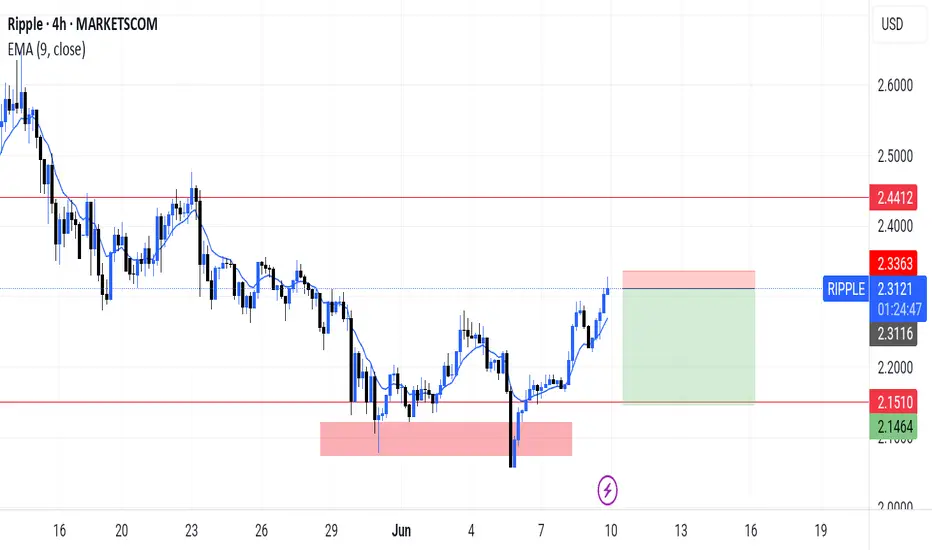
rippleTRADE 4
i rerally like ripple im normally spot on but ive only traded it a few times i feel like follow the old trade set up i did and follow the bullish into my entry level and pull the trigger on a buy to the take profit margin again
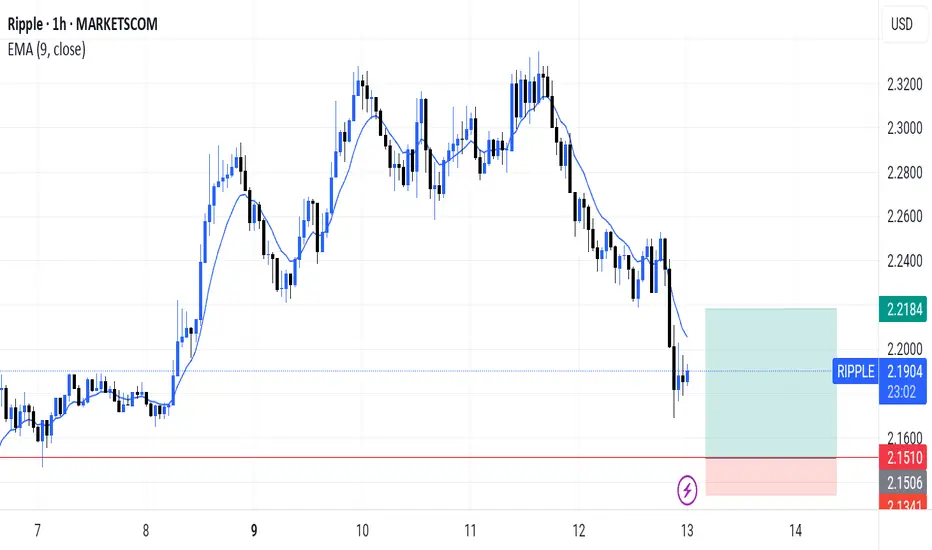
rippletrade 4 i entered this tarde at entry point just didnt post it until now i belive ripple will go to the bearish take profit mark as this is a key price range we see where it goes to but i enjoy trading rippple
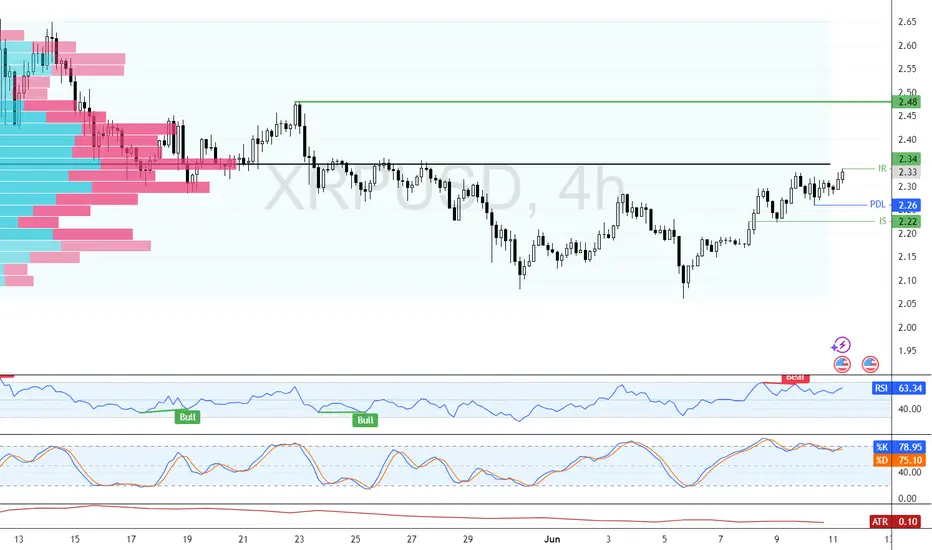
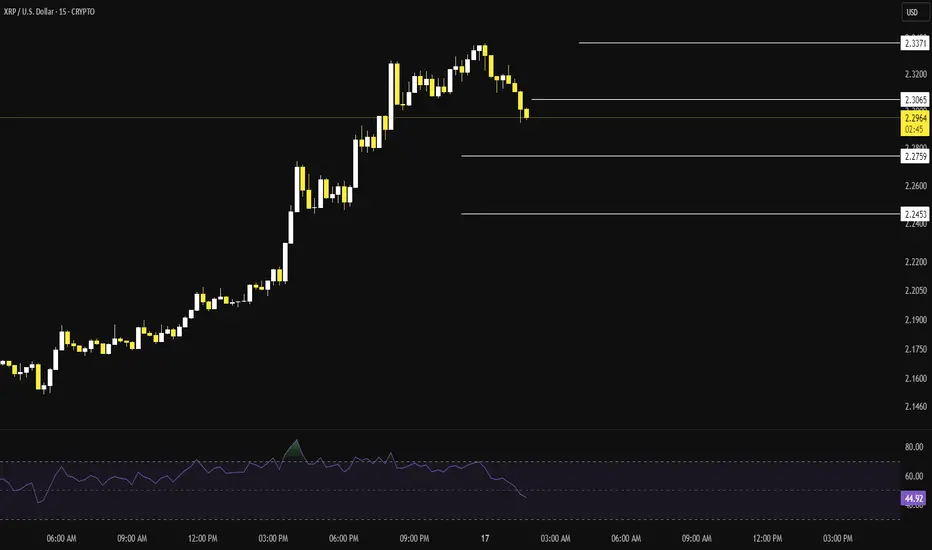
XRP: Selling Pressure Could Push Price to $2.22FenzoFx—Ripple (XRP) is testing the $2.34 resistance zone, marked as a key level by the Volume Profile Indicator. RSI 14 shows bearish divergence, while the Stochastic oscillator remains in overbought territory, signaling potential selling pressure.
If $2.34 holds, a bearish wave could target $2.26, with further downside to $2.22 if selling pressure persists.
XRP - TRADE CAREFULLY HEREPrice is currently sitting in a wedge formation.
The red trendline is from the April low to the 5 June Low.
The Greenline is from the 16 Jan high to the May high. (TRIANGLE WEDGE) There is also a Head and SHoulder on the daily.
The price is struggling to stay above the $2.30 mark that I also wrote about in May. This level is also a pivot point.
Price may break higher in the short term (current week) to $2.45 that will line up with the GREEN Downtrend line. I doubt that we make a big move past this level this week.
If the $2.30 still holds as Resistance on a daily close by the end of this week I fore-see a bigger drop to come before the bull run. and yes maybe another 10 000 pip drop as earlier in the year that will send prices to the $1.20 to $1.30 area that is also in line with the 72% Fibo from the Nov'24 Low move to Jan'25 High. But for this we will need a daily close below $2.00 support as well a some bad fundamentals from the USA as well as current SEC thay may postphone the ETF application outcomes to Nov'25.
I will be carefull to go more bullish from here.
Xrp price.There is bearish divergence in 1h time frame and i think it may cause a little dump for today.
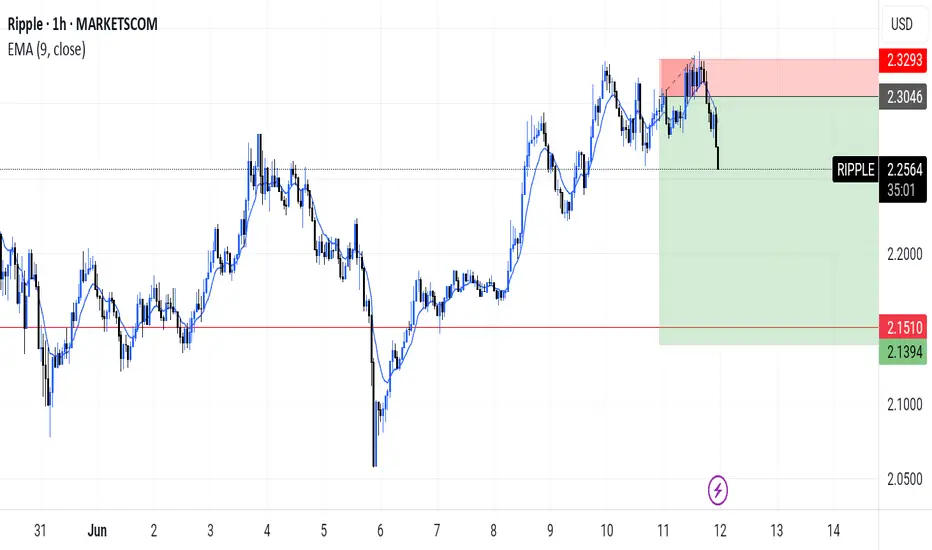
rippleTRADE 4 coming into a area of resistance, should reverse and hit a aprice value and start to come down if it doesnt and breaks the resitance and uses the resistance as surpport then we will wait for the price to use the surport and go long, i belive ripple is bullish anyway but it runs of news so we just do what we belive and right now no news is out about it so i reckon there will just be a fluctionation from the top of the supply and demand box to the bottom
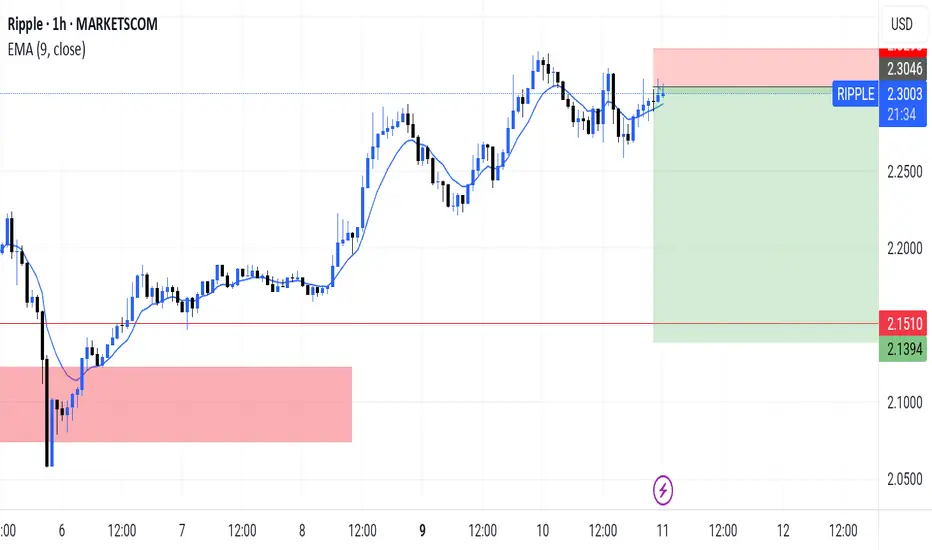

ripple TRADE 4 Should come back down after it went bvullish a pull back is order and will hit the next support line ready to go long again
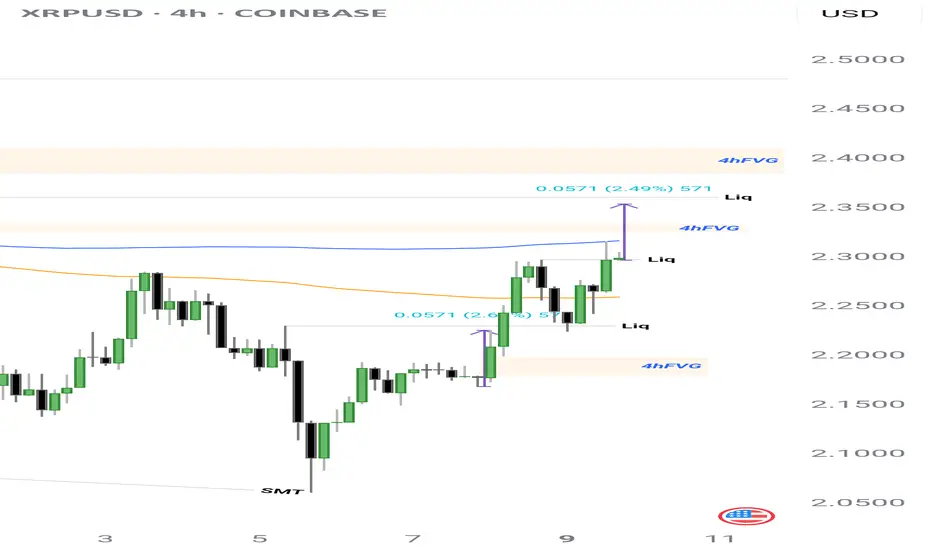
XRPExpecting another overnight bull run towards $2.35 is highly likely. We've continued taking out higher Liquidity based off previous days, this is a very bullish sign.
If we fail at $2.30 we may see $2.20 again, which provides another optimal buying opportunity before the massive move up.
LOCK IN.
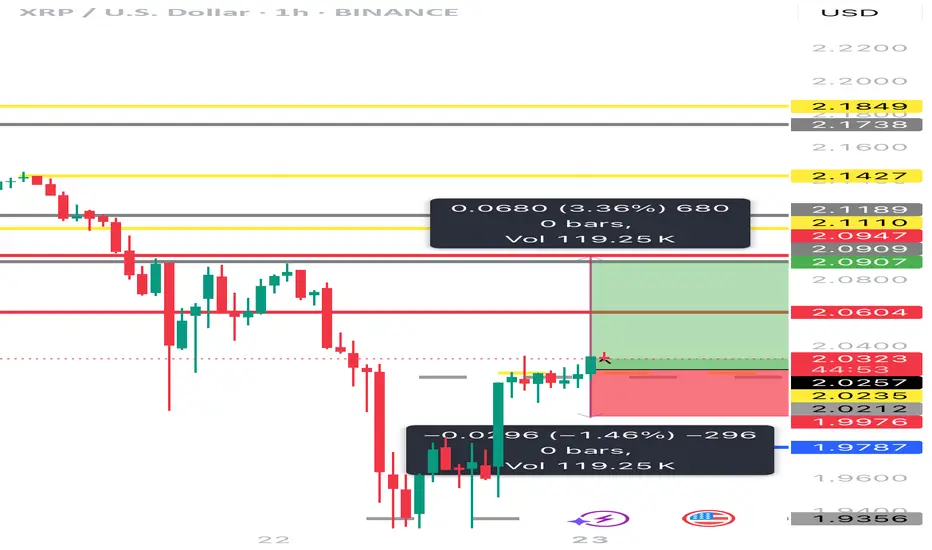
XRPUSD is moving within the 2.0950 - 2.3035 range👀Possible scenario:
The crypto market saw a minor decline. About a third of the top 100 coins posted gains, with XRP briefly dropping 0.9% to $2.22 before recovering to $2.27.
XRP has been added to the Nasdaq Crypto US Settlement Price Index, a move that increases institutional exposure. Ripple has also partnered with Asia Web3 Alliance Japan to fund XRPL startups in Japan through the XRPL Japan and Korea Fund, with a focus on DeFi, tokenization, and payments. Selected startups will receive financial support and mentorship from Ripple and Web3 Salon. Ripple's growing influence in Japan continues, with the Bank of Japan set to adopt XRP for payments by 2025 and major e-commerce player Mercari adding XRP trading to its platform.
✅Support and Resistance Levels
Now, the support level is located at 2.0950.
Resistance levels is now located at 2.3035.
Resistance roads with price points indication Can XRP break out?…….. Do you think XRP has a liquidity pool under its whale’s belly already?……. The foolish think it might happen but the inclination of a savvy veteran say: Where’s the location to the on-demand-liquidity? But that population must level up swiftly and efficiently because they know stagnant equals tardiness! No Resistance roads with price points indication analyzation necessary.! You either see the walls gardens or you don’t …………….. #ODL <swift
XRPUSD tested the Support line 2.1215 👀 Possible scenario:
XRP tested support at $2.12 and is now consolidating below $2.20. The price briefly bounced above the 23.6% Fib level from the $2.335 swing high but remains under pressure.
Despite the dip, XRP's fundamentals remain strong. It’s widely recognized for fast, low-cost cross-border payments and gained major institutional interest—including from the UN. Regulatory clarity after Ripple’s legal win against the SEC boosted investor confidence. XRP has surged 330% in the past year, and analysts see a bullish flag pointing to a potential breakout above $3.50 this summer.
✅ Support and Resistance Levels
Support level is now located at 2.1215
Now, the resistance level is located at 2.3370.
XBRUSD is moving within the 65.95 - 76.55 range👀 Possible scenario:
Oil prices eased on June 18, with Brent trading near $75.15 per barrel, as traders awaited the U.S. Fed’s rate decision and monitored Iran-Israel tensions.
The Feed is expected to hold rates steady, but concerns over slowing global growth and Middle East instability could influence future cuts. Analysts warn that conflict-driven price spikes may fuel inflation, complicating policy moves. Markets are also watching the Strait of Hormuz, a key route for 20% of global oil. While a full Iranian export hell could be offset by OPEC+ spare capacity, a blockade would severely disrupt flows, especially to Asia. Despite risks, Commerzbank noted the market remains well supplied, with slow demand growth and rising OPEN+ output. However, ongoing trade disputes may weigh on future demand.
✅ Support and Resistance Levels
Now, the support level is located at 65.95.
Resistance levels are now located at 76.55 .

XRP longRipple is bouncing from its support level. Also there is hidden bullish div on daily, suggesting fuel to uptrend.

XRP to the moon new set up updated too my XRP long position. XRP is showing signs of a bullish breakout, with analyst Dark Defender citing technical patterns and momentum that could drive the token toward a new all-time high.

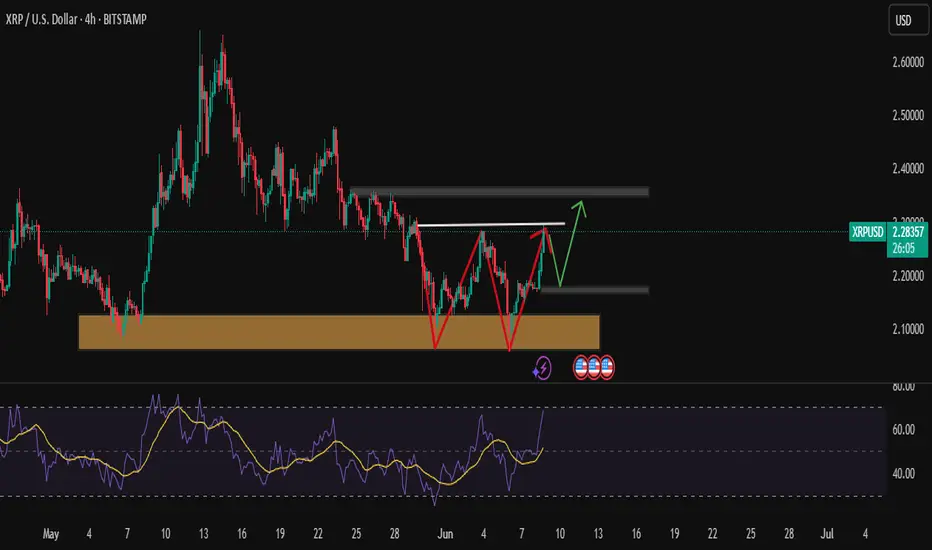
XRPUSDPattern Forming: Double/Triple Bottom
The red markings form what looks like a triple bottom or W-pattern, which is a bullish reversal formation.
Price has bounced multiple times off the strong support zone (highlighted in brown).
Historically, XRP price has reversed from here.
XRP could face resistance at neckline.
RP is showing a bullish reversal signal from a major support.
A breakout above the neckline could lead to a move toward $2.40+.
However, RSI caution suggests monitoring for a small pullback first.
A retest of the brown support zone might happen before a second bullish attempt.
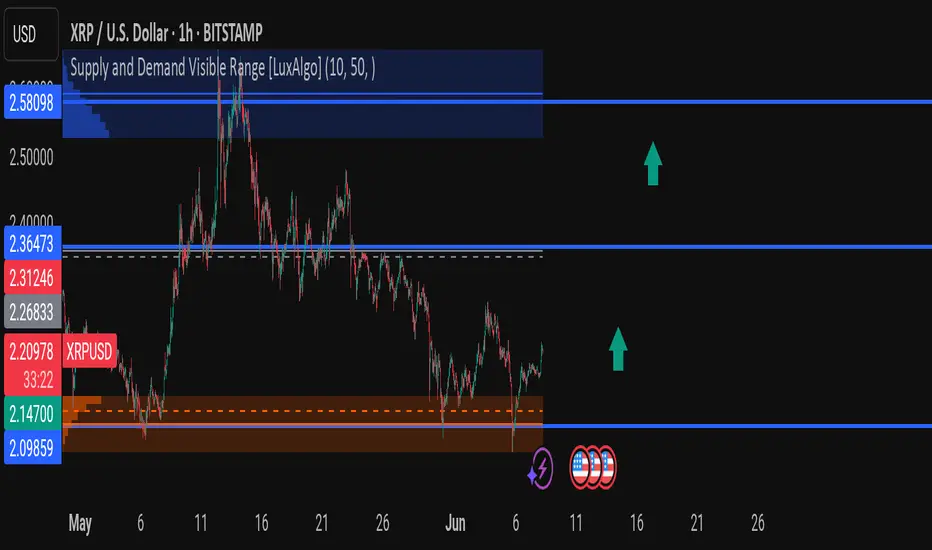
XRPUSD – MASSIVE BOUNCE INCOMING?After weeks of bearish pressure, XRP has just tapped a strong demand zone between $2.14700 – $2.09859 (highlighted in orange). Price is now showing bullish signs and could be gearing up for a major reversal. Here's a detailed breakdown of the current setup:
---
🔍 Key Levels:
🔵 Major Resistance 1: $2.36473 – Previous structure high + breakout target
🔵 Major Resistance 2 (Supply Zone): $2.58098 – Strong selling interest previously
🟠 Strong Demand Zone: $2.14700 to $2.09859 – Multiple rejections and accumulation
🔴 Current Price: $2.20984 – Rebounding from the demand zone
---
🧠 Technical Outlook:
Visible Range (LuxAlgo): Shows heavy historical volume interest near $2.36 and $2.58 – these are critical targets for bulls.
Triple Bottom-Like Formation forming inside the demand zone – a classic reversal signal.
Bullish Momentum building as sellers fail to push lower – clear sign of absorption.
Volume + Wicks = Accumulation Phase? Smart money may be stepping in here.
---
📈 Trade Idea (Not Financial Advice!):
Buy Zone: $2.10–$2.20
Target 1: $2.36
Target 2: $2.58
Stop Loss: Below $2.09 or structure low
Risk/reward is looking 🔥 if momentum confirms.
---
🧨 What to Watch:
Bullish break and retest of $2.26833 = early confirmation
Sharp breakout above $2.36473 = strong momentum shift
Volume spike near $2.21–$2.23 = possible whale entry
---
🧠 Community Question:
Do you think XRP is setting up for a major rally in June? Or is this another bull trap?
👇 Drop your TA below – Let’s talk setups, confirmations, and targets!
---
📌 Like & Follow for more clean charts, no fluff TA, and real trading insight!
#XRP #Crypto #XRPUSD #Ripple #Altcoins #TechnicalAnalysis #LuxAlgo #PriceAction #CryptoTA #TradingView #SupplyAndDemand #SmartMoney
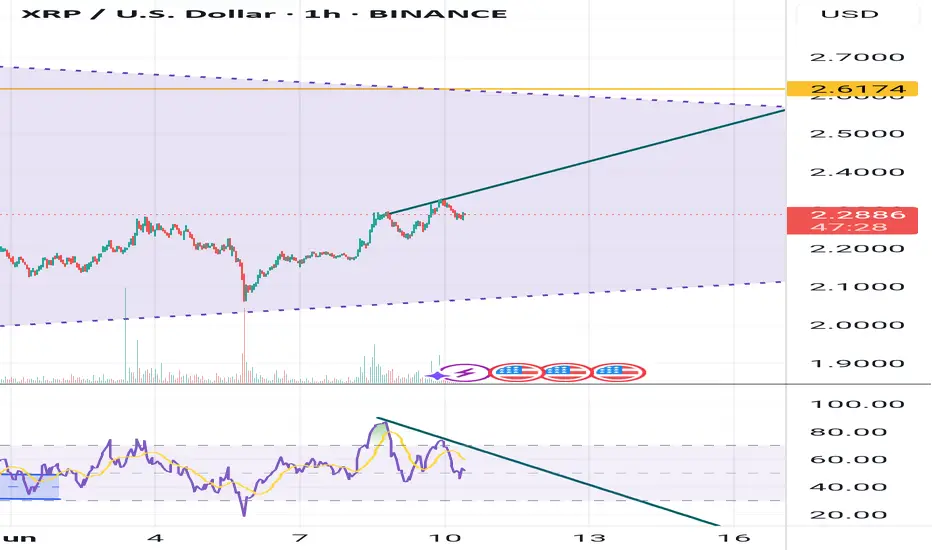
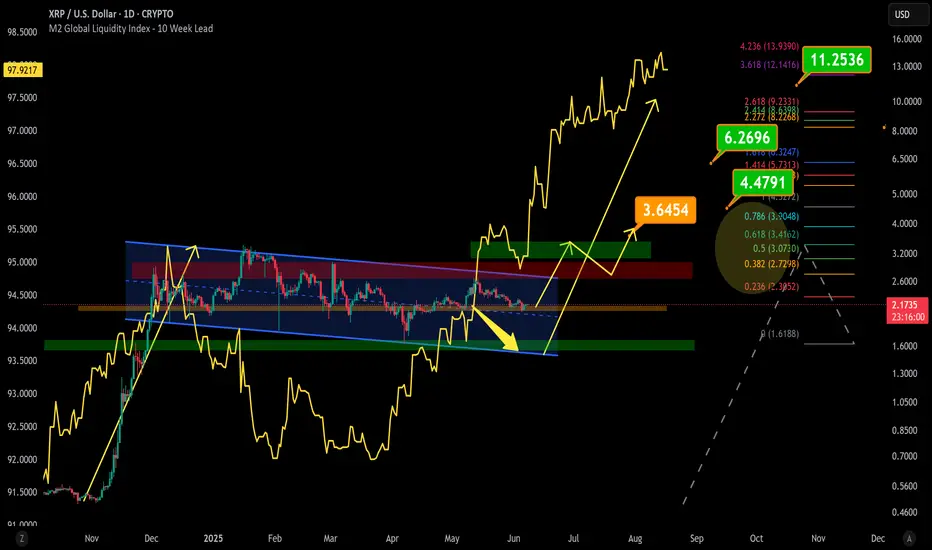
Can XRP Reach $10? A Perfect Storm of Fundamentals and TechnicalFrom a fundamental standpoint, the Ripple vs. SEC lawsuit continues to act as a major overhang on XRP’s long-term valuation. However, with the SEC’s 60-day deadline approaching (June 16), a favorable outcome for Ripple could inject fresh confidence into the market. This coincides with a broader macro backdrop of rising global liquidity, which historically supports risk-on assets such as cryptocurrencies.
Technically, XRP is currently forming a classic bullish flag pattern on the higher timeframes—a continuation structure that often precedes strong upward moves. If price breaks above the flag’s resistance zone and enters a confirmed buy zone, a retest of the breakout area followed by bullish confirmation could signal the beginning of a larger move toward the $10 psychological level.
The alignment of a legal breakthrough, improving macro liquidity, and a bullish chart structure makes this a scenario worth watching closely.
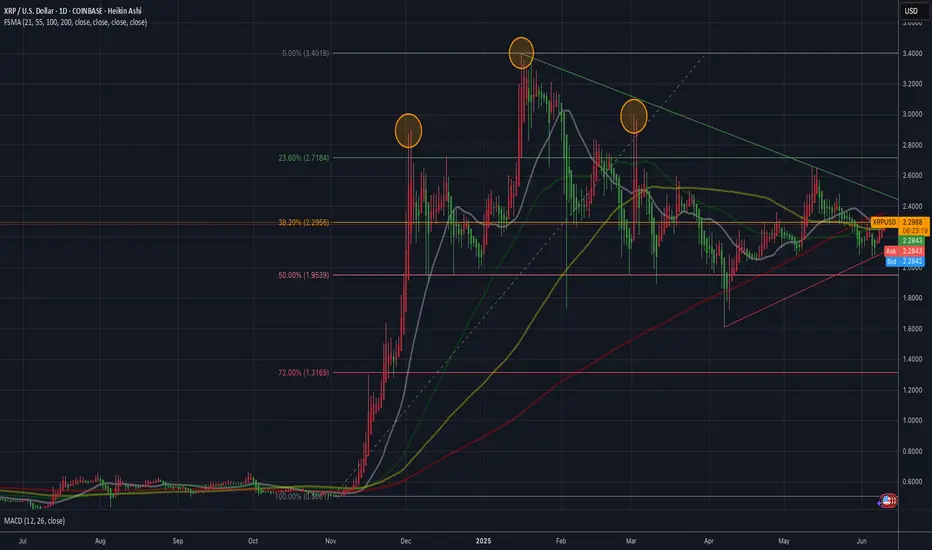
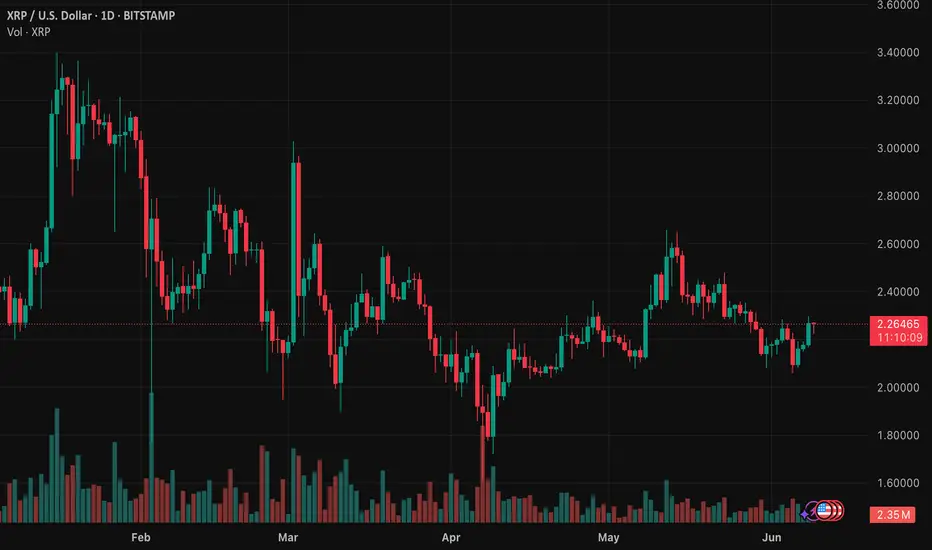
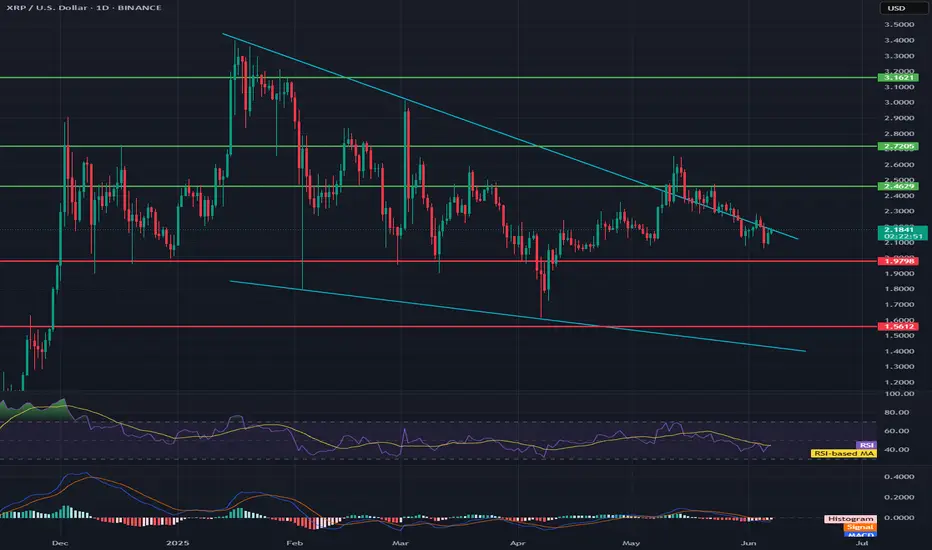
XRP/USD🔍1. Trend and Key Levels
General trend
In the medium term: We see a clear downtrend, marked by two wide blue trend lines (the upper line from the peak around $3.3, the lower from the local lows).
Recent weeks: Consolidation in a wide range between $2.72 and $1.98, with frequent attempts to break out.
📌2. Support and resistance levels
Green lines (resistance):
$3.16 — the historical peak of this wave, very strong resistance.
$2.72 — another strong resistance, around which the price was rejected several times.
$2.46 — local resistance, currently the price is below this level.
Red lines (support):
$1.98 — very important support, tested several times already.
$1.56 — lower support, coinciding with the lower line of the downtrend channel.
3. Market formations and structure
Declining channel: Wide channel marked by two blue lines. Price is moving in its lower half.
Short-term descending triangle: Visible at current levels – local peaks are getting lower, and support is around USD 1.98.
Volume: Volume advantage visible on descending candles.
📊4. Indicators
RSI
Currently around 40 — No clear advantage of the buyer side, slightly below the neutral zone. RSI does not give a signal of overbought or oversold.
RSI-based MA — Oscillates below the level of 50, which confirms the downtrend.
MACD
MAD and signal lines are below zero, without clear divergence.
Histogram: Slight advantage of bears – there is no signal to reverse the trend yet.
🧠5. Near-term scenarios
Bullish
Condition: Breakout above the local downtrend line (~$2.20–$2.25) and return above $2.46.
Target: $2.72 (test of resistance), further move possible to $3.16 in case of strong gains.
Bearish
Condition: Breakout and close below $1.98.
Target: $1.56 (main channel support), and even lower – lower channel line.
Sideways scenario
Further consolidation possible in the range of $2.46–$1.98, until a breakout from this range occurs.
📊6. Sentiment and summary
Medium-term trend: Down.
Buyers are weak, RSI low, MACD does not give a rebound signal yet.
Key level to watch: 1.98 USD – if it falls, the next stop is 1.56 USD.
Only a return above 2.46 USD may give the first signals of a trend change.
🧠Recommendation
For long-term players: Be careful, do not blindly catch the bottom.
For speculators: Play for a rebound only with a short stop below 1.98 USD.
For investors: Wait for a signal confirming a breakout from the channel or a clear divergence on the indicators.
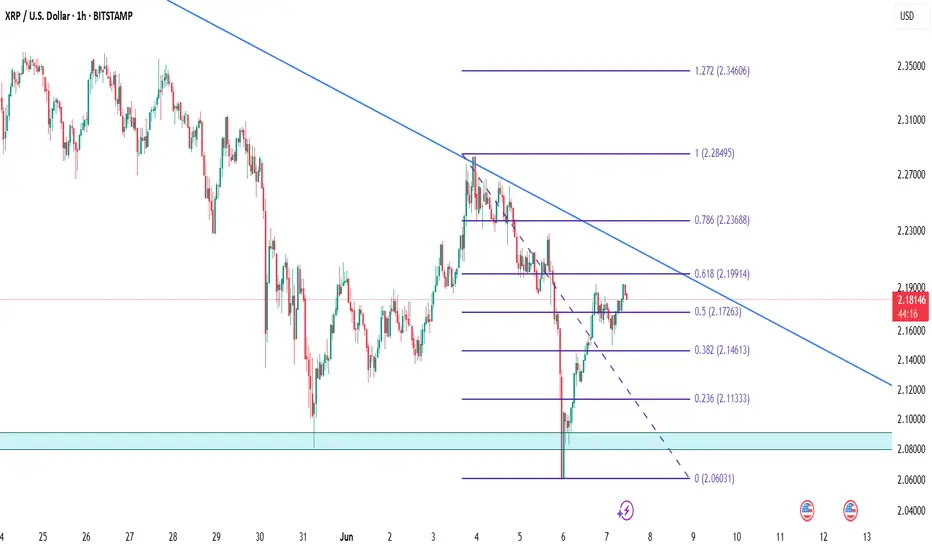
XRPUSDTXRP is currently facing strong confluence resistance near the 0.5–0.618 Fibonacci zone (2.17–2.19), aligned with a descending trendline. The price has failed to break this area decisively, suggesting potential exhaustion of the recent bullish momentum. Unless we see a strong breakout above 2.20, a pullback toward the 2.14 and possibly 2.10 support zones remains likely. This zone acts as a key decision point for the next directional move.
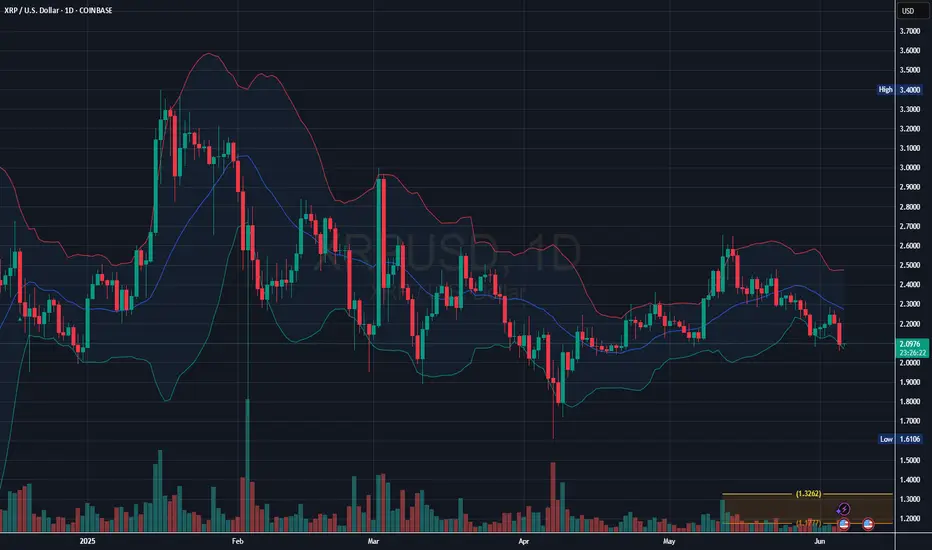
XRP/USD Daily Chart Signals Continued Bearish Pressure
The current price is trading below the midline of the Bollinger Bands (usually a 20-day moving average), which typically indicates downward momentum.
The chart shows a pattern of descending highs and descending lows, which is a classic bearish structure.
The latest candle is red and pushing toward or near the lower Bollinger Band, suggesting increased selling pressure.
Price recently lost the $2.20–$2.30 support zone and is now testing the $2.00 psychological level. If this level breaks, it could open downside toward $1.90 or lower.