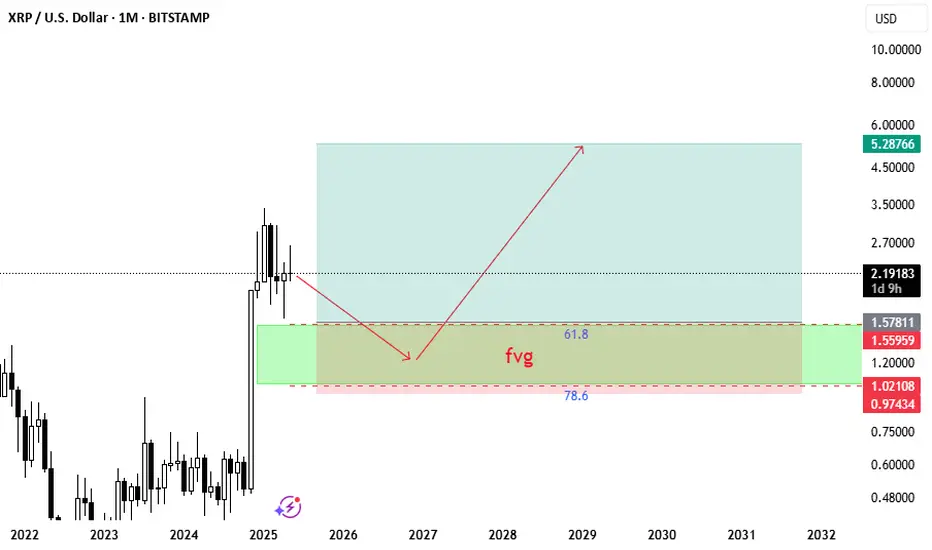
The best point for xrpusd to go upHello friends, today I came with an analysis of the xrpusd symbol on the monthly time frame, I think the price can move up from this area.
XRPUSD.P trade ideas
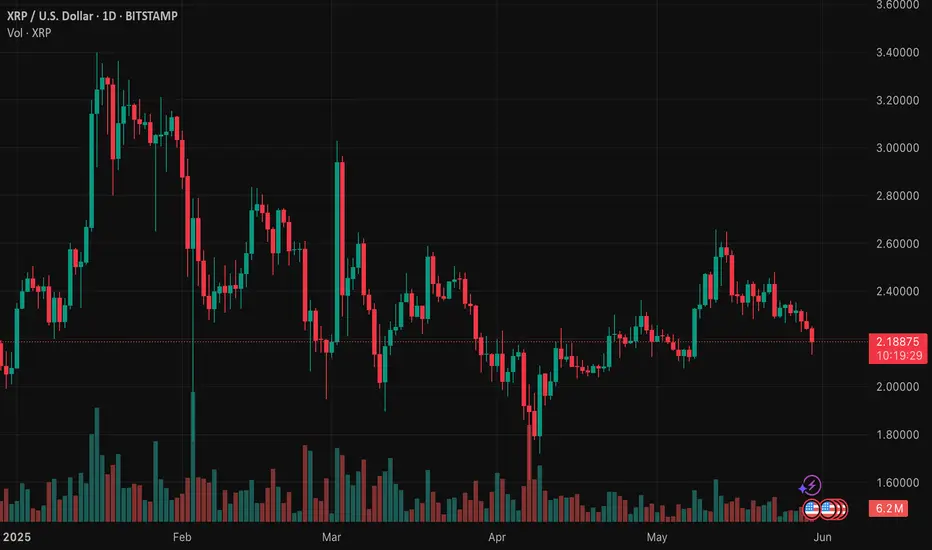
XRPUSD broke the Support line 2.2270 👀 Possible scenario:
XRP is struggling below the $2.27 resistance, with downside risks if it breaks $2.16 support—potentially falling to $2.08. The RSI near 50 and tight EMA range suggest a major move is coming, with low volume heightening volatility risks.
Meanwhile, institutional interest is rising. Hyperscale Data plans to invest up to $10M in XRP to power its upcoming blockchain-based lending platform for U.S.-listed companies, using the XRP Ledger for speed and cost-efficiency. Futures on the CME will hedge volatility. The launch depends on market and regulatory conditions. Separately, China’s Webus International announced a $300M XRP reserve plan to boost cross-border payments and blockchain growth, sending its stock up over 60%.
✅Support and Resistance Levels
Now, the support level is located at 2.1100.
Resistance levels is now located at 2.3550.
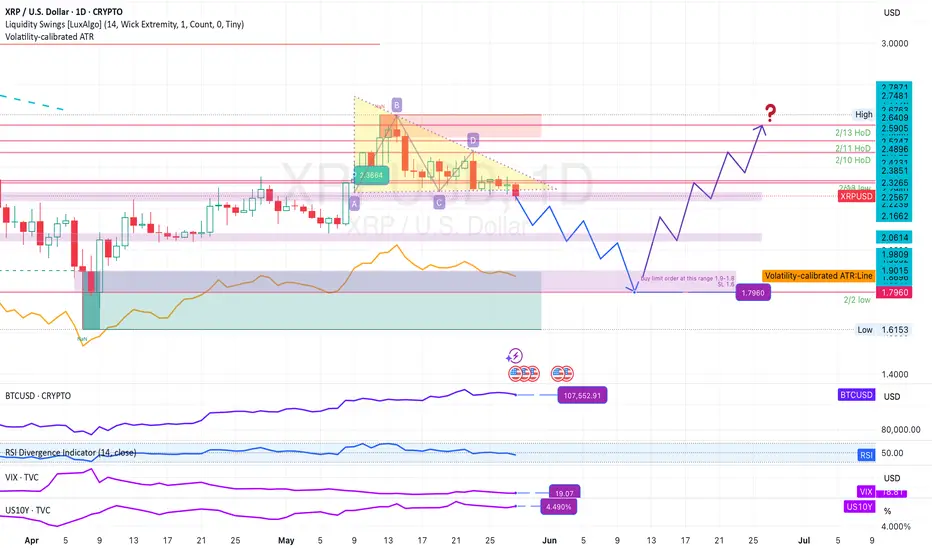
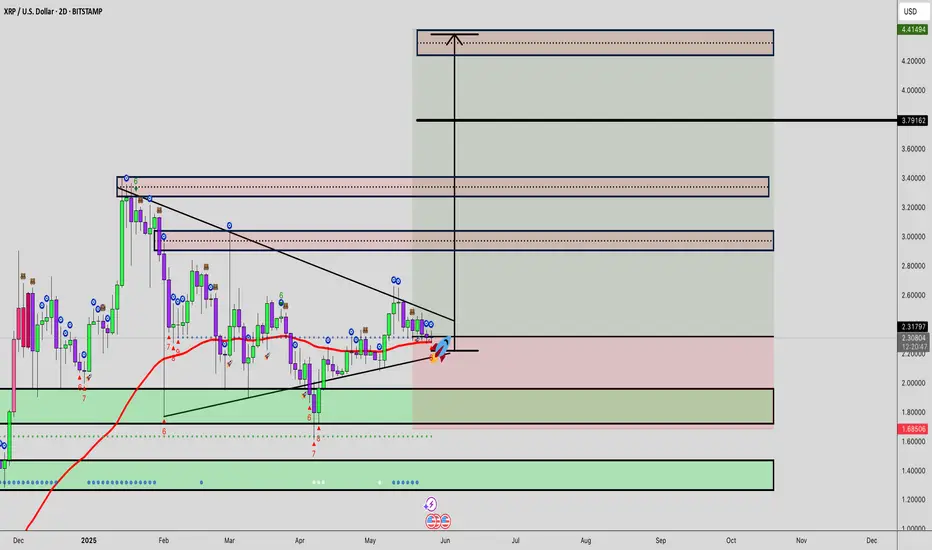
XRPUSD at weekly support, ready to aim for 3$XRPUSDT is currently sandwiched between weekly support WS1 and weekly resistance WR1.
The price is currently trading inside weekly support WS1.
This is the place from where it should find support and gather necessary momentum for a bounce.
The bounce from WS1 shall lead the price to the daily resistance around 2.57 marked with horzontal blue line on the chart.
There the price is likely to face some pullback towards 2..36 only to come back again with force to go beyond this daily resistance zone.
This next move upward after the pullback from daily resistance around 2.57, shall lead the price to weekly resistance WR1 around 3$.

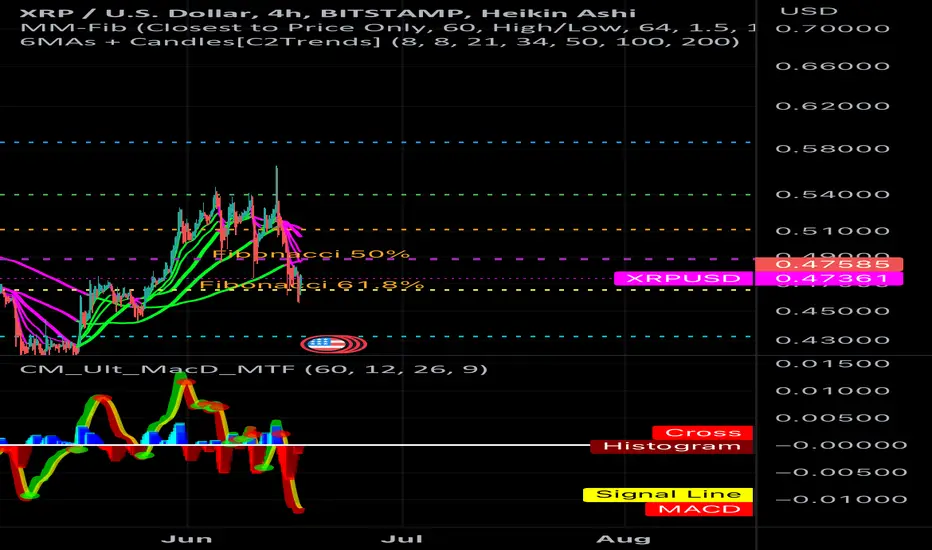
XRPUSD EMA HAMMER REVERSALS AND LP TPPROVIDES ACCURATE BASED STRATEGY FOCUSING ON THE CANDLE STICK CHARTS;
EMA - Exponential Moving Average
What is an EMA?
- An EMA is a type of moving average that places a greater emphasis on recent data points, making it more responsive to current price changes compared to a Simple Moving Average (SMA).
- This characteristic makes it particularly useful in the volatile crypto market, where prices can fluctuate rapidly.
- It is used by traders and analysts to interpret market trends, gauge momentum, and ascertain the direction of price movements.
HOW IS EMA USED IN CRYPTO TRADING
-Trend Identification: A rising EMA can signal a bullish trend, while a falling EMA suggests a bearish trend.
-Generating Trading Signals: Traders often use the EMA crossover strategy, which involves observing when two EMAs of different periods intersect to identify potential buy or sell signals.
Support and Resistance Levels:
EMAs can act as dynamic support and resistance levels. When the price of a cryptocurrency is above the EMA line, it can act as support, and when it is below, it can act as resistance.
Smoothing Price Data:
EMAs smooth out price data, providing a clearer view of the overall trend and reducing market noise.
Differences between EMA and SMA:
Responsiveness: EMA is more sensitive to recent price changes, making it better suited for short-term trading.
Weighting: EMA gives more weight to recent prices, while SMA assigns equal weight to all data points.
Speed: EMA reacts faster to price changes than SMA.

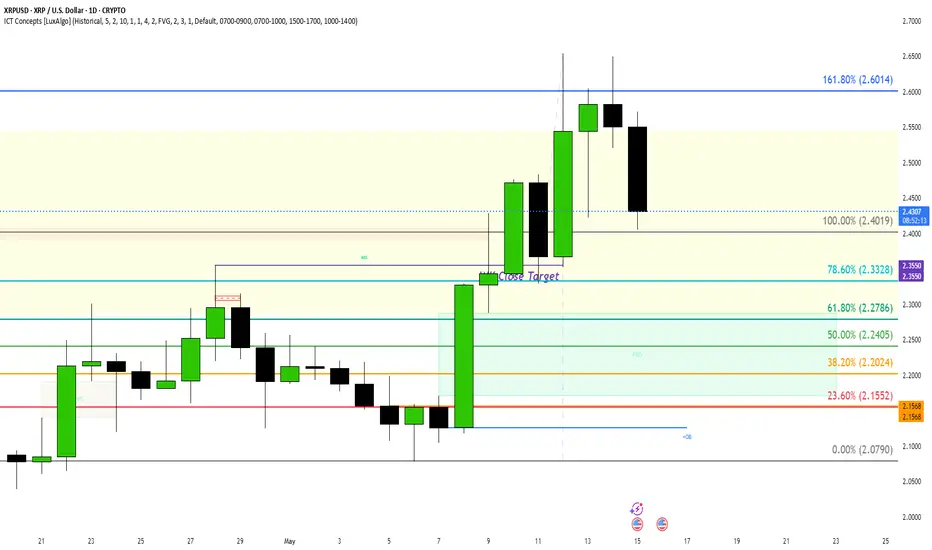
XRP Downtrend? Based on Fib Retrace, and large FVG, I would not be surprised if price falls to 2.25ish (50% Fib) and then starts an uptrend. What do you think??
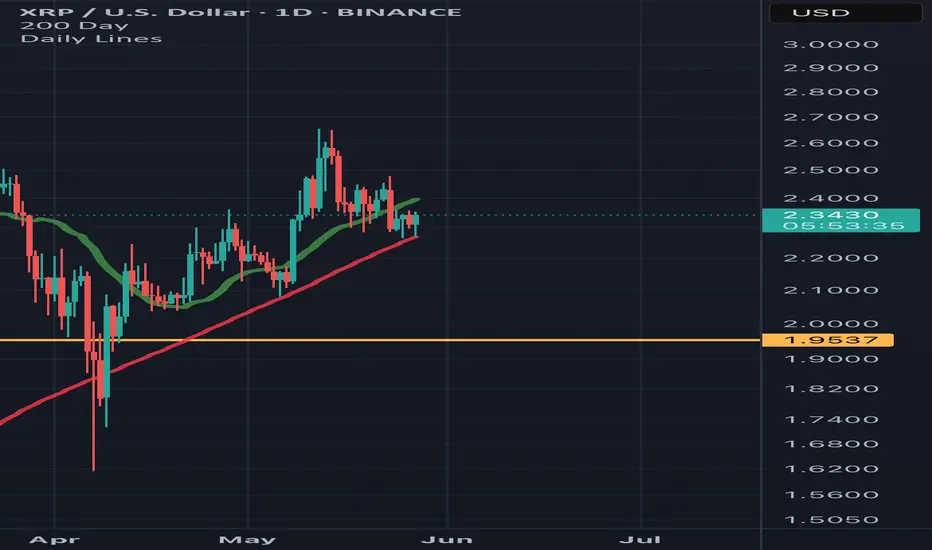
XRPUSD Falling Wedge?Looks like it's about to break through support, possibly down to 1.9-1.8 area. Good buying opportunity there if it bounces hard can go back to recent highs.
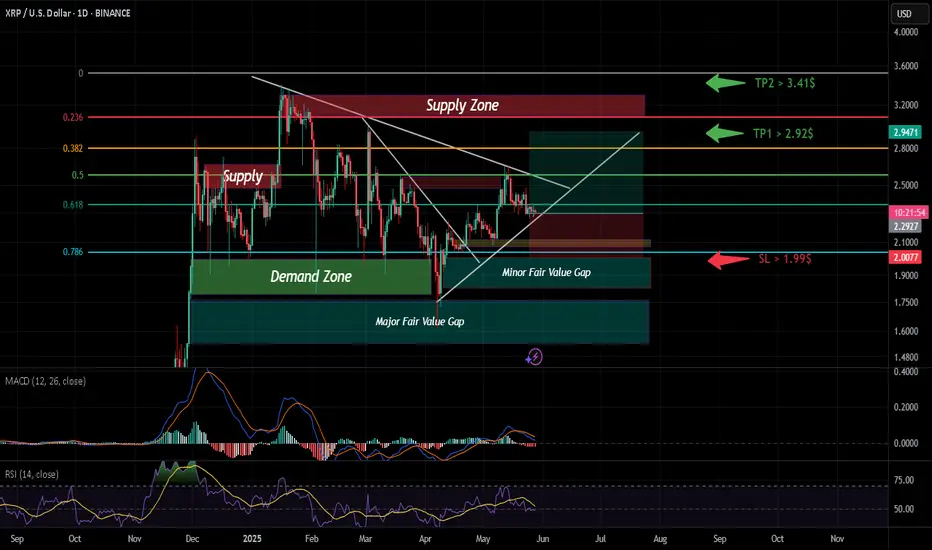
BULLMASTER PLAY – XRP/USD (1-Day)“Coiled price, loaded zones – when it pops, don’t blink.” 🐂
🔭 Big-Picture Structure
- Descending wedge** (white) compressing since Nov ’24 → stored energy.
- Demand Zone 2.15 – 1.97** (green) = 0.786 Fib **+ Major FVG** → institutional bid.
- Supply Zone 3.20 – 2.85** (crimson) caps every bull raid since Jan.
- Minor FVG 2.10 – 2.20** (teal) hugs wedge support – precision reload pad.
📈 Momentum Snapshot
- MACD hugging the zero-line → momentum fuel primed.
- RSI 14 carving higher lows while price prints flat lows → hidden bull div.
🎯 Battle Plan
| Setup | Trigger | Stop-Loss | TP1 | TP2 |
|------|---------|-----------|-----|-----|
| **Break & Ride** | Daily close **above 2.50** (wedge roof) | **1.99** (below Demand & Major FVG) | **2.92 $** | **3.41 $** |
*Risk ≤ 1 % per idea. Move SL to BE once TP1 prints.*
🗺️ Route Map
1. Expansion North – close > 2.50 → squeeze to **2.92**; acceptance → drive into **3.41** & upper Supply.
2. Fakeout & Sweep – rejection at roof → flush into **Minor FVG 2.10**; watch Demand 2.15 – 1.97 for bull reload.
3. Invalidation – full-body daily close **< 1.97** breaks wedge → bullish bias off.
---
⚠️ *Not financial advice. Plan the trade, size the risk, execute like a machine.*
Good hunting, legends! 💪🐂
XRPUSD This rare signal can send it to $12.5 end of the year.XRP has been practically ranging since the start of the year following the immense rally after the U.S. elections last November. This is technically a Re-accumulation phase supported by the 1W MA50 (blue trend-line), similar to May - November 2017 of XRP's 1st Cycle.
The strong signal that makes this correlation more relevant is the 1M RSI peak above 80.00 and correction back below the oversold barrier (green ellipse), which is identical on both fractals. Also they both took place just below the 1.5 Fibonacci extension level.
The 2017 Re-accumulation, held its 1W MA50 as Support and eventually pushed for one final parabolic rally within the 2.0 - 2.236 Fib range, before the Cycle topped.
As a result, we expect XRPUSD to hit $12.5 by the end of this year.
-------------------------------------------------------------------------------
** Please LIKE 👍, FOLLOW ✅, SHARE 🙌 and COMMENT ✍ if you enjoy this idea! Also share your ideas and charts in the comments section below! This is best way to keep it relevant, support us, keep the content here free and allow the idea to reach as many people as possible. **
-------------------------------------------------------------------------------
💸💸💸💸💸💸
👇 👇 👇 👇 👇 👇

XRP/USD LONG SET UPTitle: XRP/USD (RIPPLE) BUY
Asset: Crypto
Symbol: XRP/USD
Market Entry Price 1: $2.28
Limit Entry Price 2: $2.08
Stop Loss: $1.88
Take Profit 1: $2.48 (close 10%)
Take Profit 2: $2.78 (close 25%)
Take Profit 3: $3.38 (close 50%)
Take profit 4: $3.88 (close 75%)
Take profit 5: $4.38 (close 100%)
Status: ACTIVE
XRP breakout from rising wedge 70% chance of bearish movePlease be aware ther eis a 70-75% chance of a further Bearish move when BTC FOMO stops and the drop begins, please see my previous published idea for BTC.
Targets
BTC: 85K or in extreme capitulation 79 K
XRP: 1.5usd green box, we must first break the upper trendline of the falling wedge on XRP before the sell off can start, mixed signals but BTC s leading technical setup tells us we will see a bigger correction in the next few days dragging all alts down. BTC dominance is still very strong and will probably only fade later this year Sept - November

How early on Quant? Let me knowFuture history, not fInAnCiAl advice
I want to engage with the community and find out how early other investors are to the next leg up
XRP IMO we are just waiting on things to kick off across the board in crypto..
BTC has made its new ATH and we know what comes after. !
Weekly trading plan for XRPIn this idea I marked the important levels for this week and considered a few scenarios of price performance
XRP looks weak against the rest of the market, price under the pivot point level
Write a comment with your coins & hit the like button and I will make an analysis for you
The author's opinion may differ from yours,
Consider your risks.
Wish you successful trades ! mura

Trade setup on XRP (swing trades) Green are the areas to look for longs.
Red are short options or profit taking.


Xrp- a small case for upsideRipple is a coin that is loved fervently by retail and despised vehemently by crypto natives. People who spend the bear market in the trenches tend to avoid it due to skepticism about FDV and other metrics and then retail comes in for a blip in time and pumps it to Valhalla and dumps on crypto natives and leaves without explaining.
If bitcoin hits 250k , retail is coming back and pumping this to $9.
Downside : price is currently trending near previous ATH of 2018 so there's a risk of double top and crash to 50¢
Upside : dark days are behind us. Why zoom out more than necessary. Worst is behind us. We're in an uptrend.
minor downside : oh no, we zoomed in too hard and the chart seems to be in a downtrend. well it doesn't matter unless you're high leveraged . Zoom out moderately, relax for a bit, and wait for retail to arrive.

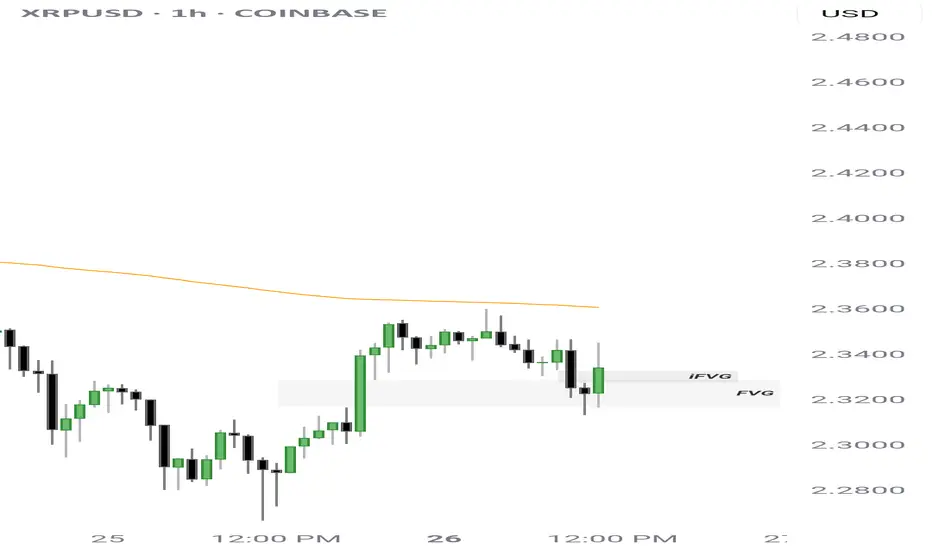
XRP BULLISH bounce off $2.32 FVG followed up with a bullish Inversion FVG forming.
This week we will break above $2.40 & may never see sub $2.20 XRP ever again. The next leg up will be a very fast move up, leaving many empty handed.
What does your exit strategy look like?
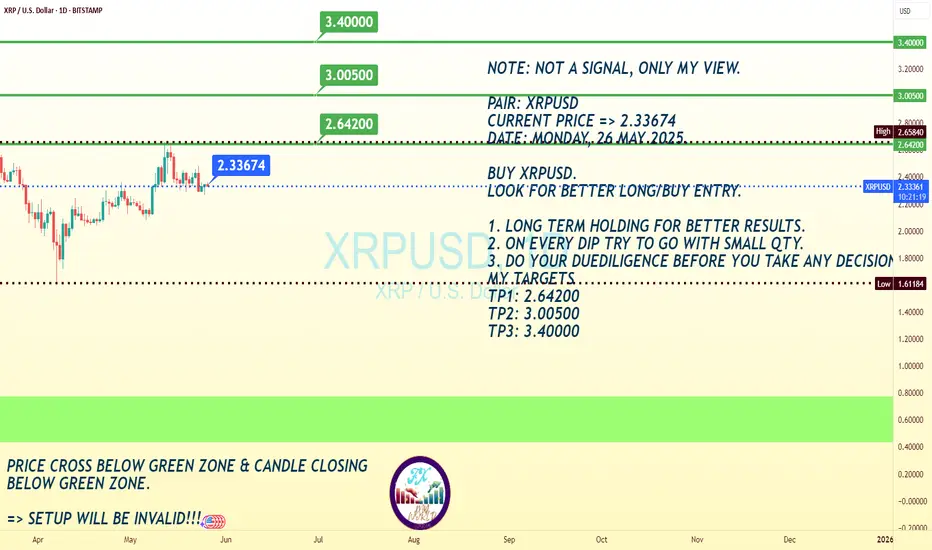
XRUSD Price Market Trend Day TF Long Term BUYXRPUSD is trading at 2.33674, with a strong recommendation to buy for long-term gains. The chart indicates a potential upward trajectory, with price targets set at:
TP1: 2.44200 (Near-term resistance)
TP2: 3.00500 (Mid-term target)
TP3: 3.40000 (Long-term bullish goal)
The mention of 3.40000 at the top of the chart suggests this is a psychological resistance level, reinforcing the optimistic outlook if bullish momentum sustains.
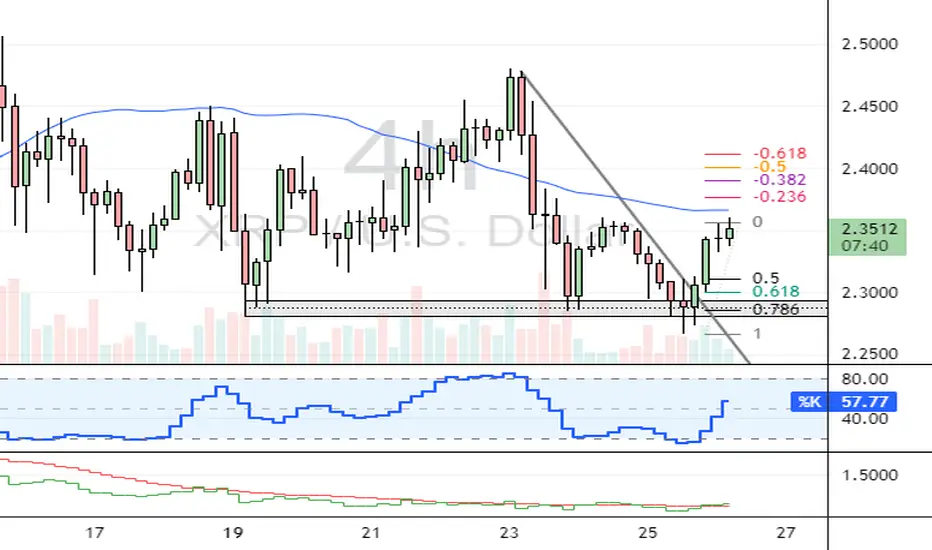
XRP's Path Forward: Will the Uptrend Continue?FenzoFx—XRP (Ripple) rose from $2.266, validating this demand zone for the week. The uptrend stalled at $2.360 during the early London session due to profit-taking and new market participants.
We expect XRP/USD to decline toward the FVG area at $2.30–$2.31 before resuming its uptrend. A break above $2.36 could trigger a move toward $2.38, followed by $2.40.
The bullish outlook is invalidated if XRP falls below the $2.26 support level.
Trade XRP/USD swap free and low spread at FenzoFx.
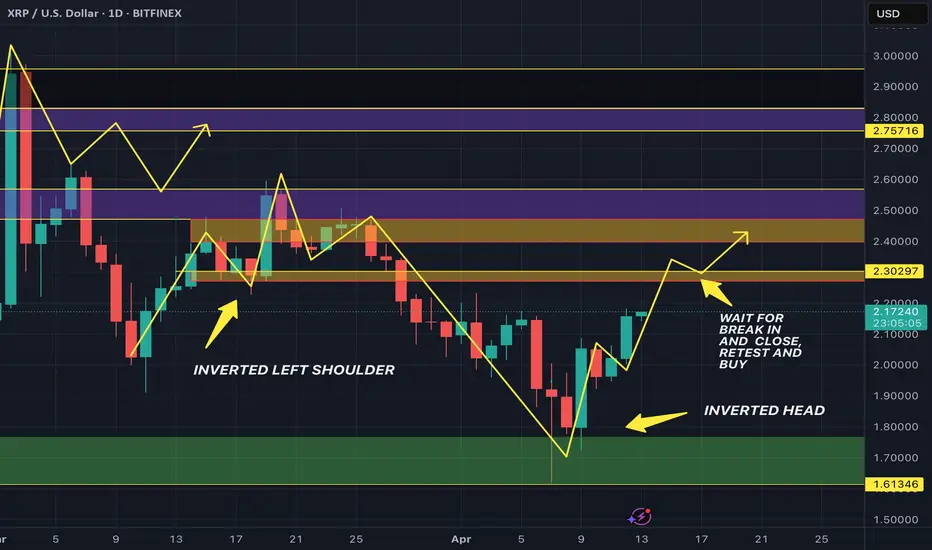
INVERTED HEAD AND SHOULDERS!! XRP DAILY!!Consolidation of the left shoulder has formed, the inverted left shoulder has formed, wait for a break-in, once the market closes, wait for retest, then buy to the resistance.
XRPUMy vision where going XRPU.
Now we on bullish trend after price was falling.
First Resistance is 2360 if we break up second 2420

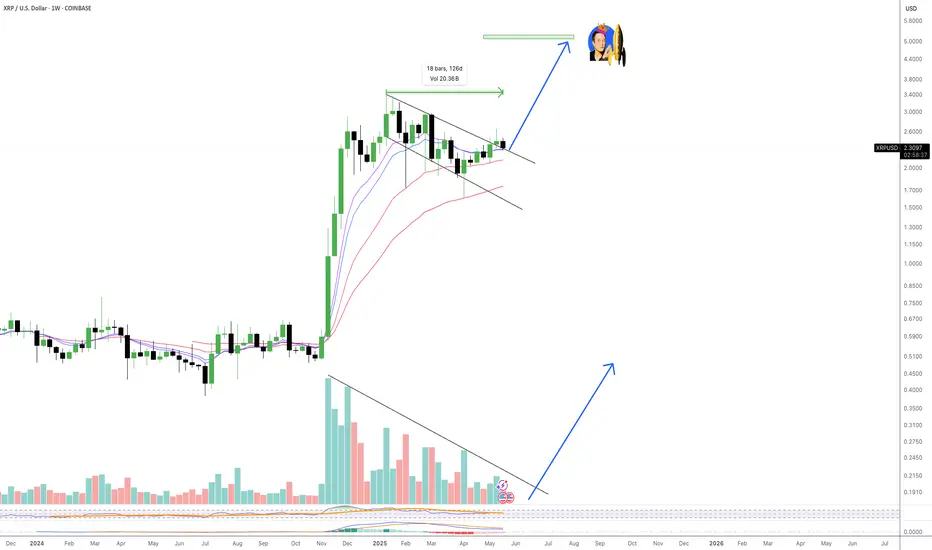
Declining volume - waiting for the next impulsive move - + 5 $For about 126 days we are just are in a ranging movement. We can see that we have for all that time declining volume, keep this mind when the volume start to rise.
We are retesting the channel formation, perfect testing all moving averages and we tapped the golden ratio.
New all time high is around the corner (i believe)
XRPWe must fill the gap at $2.15 before we move higher.
I believe we will continue moving down through the end of May, until then we must Dollar Cost Average.
This is not financial advice, but this is what I will be doing moving forward.
