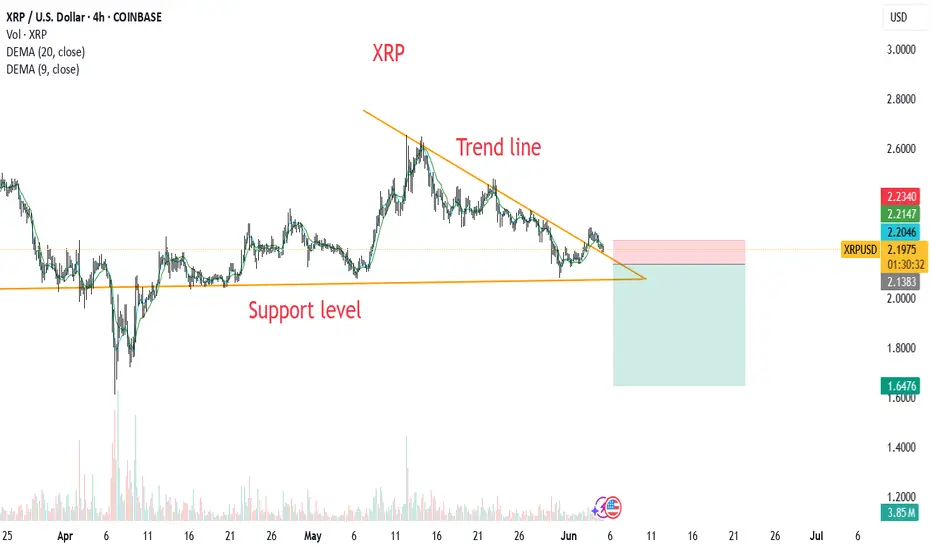
XRPUSD is moving within the 2.0950 - 2.3035 range👀Possible scenario:
The crypto market saw a minor decline. About a third of the top 100 coins posted gains, with XRP briefly dropping 0.9% to $2.22 before recovering to $2.27.
XRP has been added to the Nasdaq Crypto US Settlement Price Index, a move that increases institutional exposure. Ripple has also partnered with Asia Web3 Alliance Japan to fund XRPL startups in Japan through the XRPL Japan and Korea Fund, with a focus on DeFi, tokenization, and payments. Selected startups will receive financial support and mentorship from Ripple and Web3 Salon. Ripple's growing influence in Japan continues, with the Bank of Japan set to adopt XRP for payments by 2025 and major e-commerce player Mercari adding XRP trading to its platform.
✅Support and Resistance Levels
Now, the support level is located at 2.0950.
Resistance levels is now located at 2.3035.
XRPUSD trade ideas
XRP longRipple is bouncing from its support level. Also there is hidden bullish div on daily, suggesting fuel to uptrend.

XRP to the moon new set up updated too my XRP long position. XRP is showing signs of a bullish breakout, with analyst Dark Defender citing technical patterns and momentum that could drive the token toward a new all-time high.

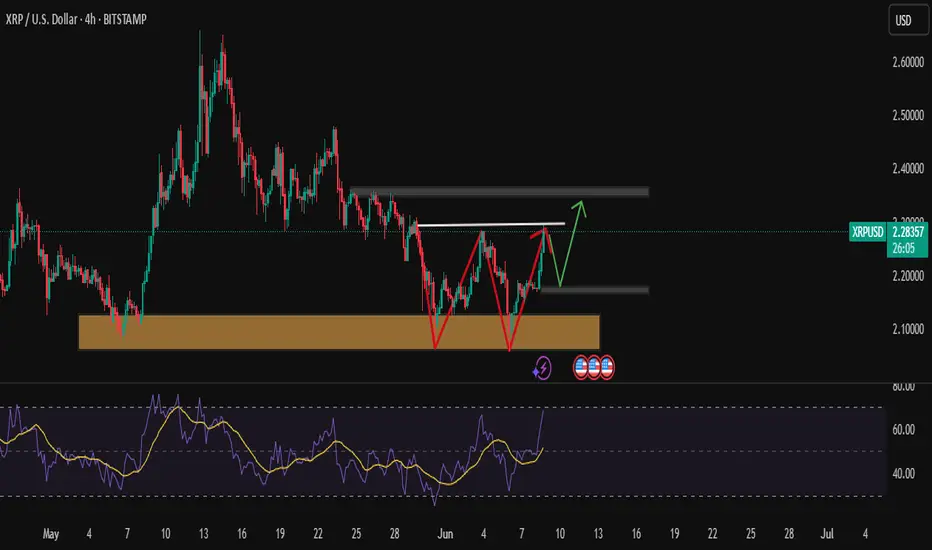
XRPUSDPattern Forming: Double/Triple Bottom
The red markings form what looks like a triple bottom or W-pattern, which is a bullish reversal formation.
Price has bounced multiple times off the strong support zone (highlighted in brown).
Historically, XRP price has reversed from here.
XRP could face resistance at neckline.
RP is showing a bullish reversal signal from a major support.
A breakout above the neckline could lead to a move toward $2.40+.
However, RSI caution suggests monitoring for a small pullback first.
A retest of the brown support zone might happen before a second bullish attempt.
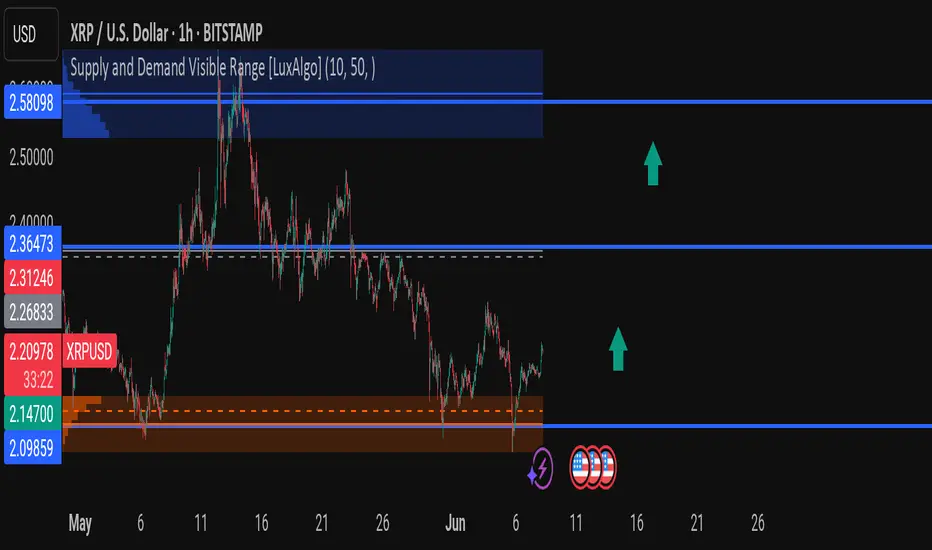
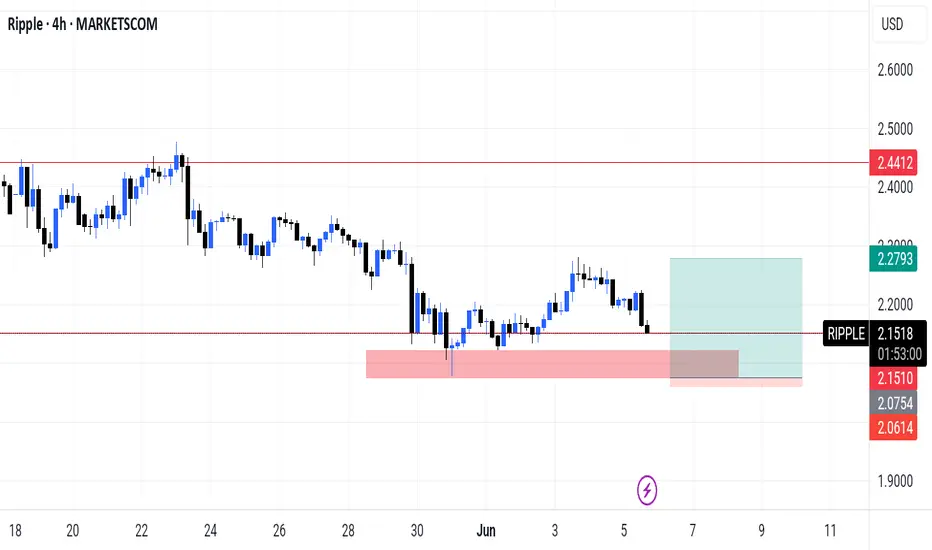
XRPUSD – MASSIVE BOUNCE INCOMING?After weeks of bearish pressure, XRP has just tapped a strong demand zone between $2.14700 – $2.09859 (highlighted in orange). Price is now showing bullish signs and could be gearing up for a major reversal. Here's a detailed breakdown of the current setup:
---
🔍 Key Levels:
🔵 Major Resistance 1: $2.36473 – Previous structure high + breakout target
🔵 Major Resistance 2 (Supply Zone): $2.58098 – Strong selling interest previously
🟠 Strong Demand Zone: $2.14700 to $2.09859 – Multiple rejections and accumulation
🔴 Current Price: $2.20984 – Rebounding from the demand zone
---
🧠 Technical Outlook:
Visible Range (LuxAlgo): Shows heavy historical volume interest near $2.36 and $2.58 – these are critical targets for bulls.
Triple Bottom-Like Formation forming inside the demand zone – a classic reversal signal.
Bullish Momentum building as sellers fail to push lower – clear sign of absorption.
Volume + Wicks = Accumulation Phase? Smart money may be stepping in here.
---
📈 Trade Idea (Not Financial Advice!):
Buy Zone: $2.10–$2.20
Target 1: $2.36
Target 2: $2.58
Stop Loss: Below $2.09 or structure low
Risk/reward is looking 🔥 if momentum confirms.
---
🧨 What to Watch:
Bullish break and retest of $2.26833 = early confirmation
Sharp breakout above $2.36473 = strong momentum shift
Volume spike near $2.21–$2.23 = possible whale entry
---
🧠 Community Question:
Do you think XRP is setting up for a major rally in June? Or is this another bull trap?
👇 Drop your TA below – Let’s talk setups, confirmations, and targets!
---
📌 Like & Follow for more clean charts, no fluff TA, and real trading insight!
#XRP #Crypto #XRPUSD #Ripple #Altcoins #TechnicalAnalysis #LuxAlgo #PriceAction #CryptoTA #TradingView #SupplyAndDemand #SmartMoney
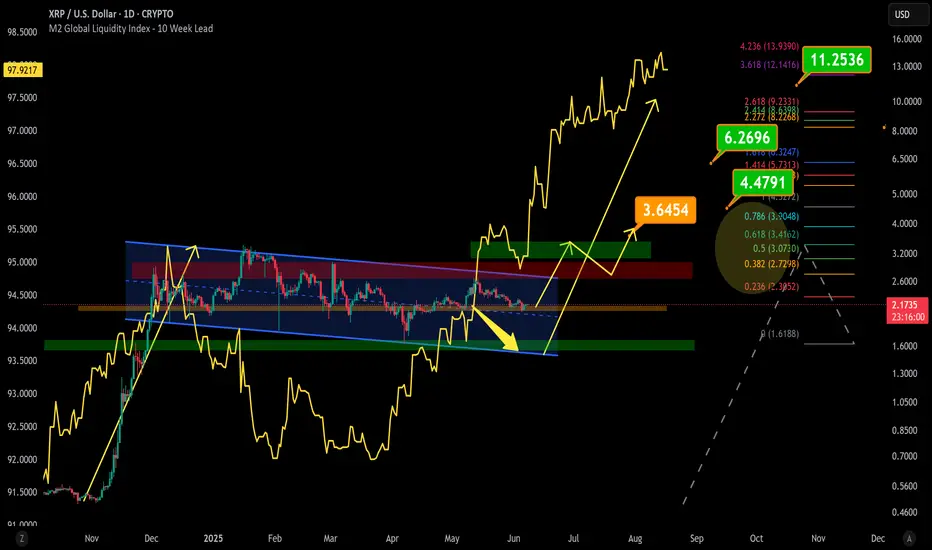
Can XRP Reach $10? A Perfect Storm of Fundamentals and TechnicalFrom a fundamental standpoint, the Ripple vs. SEC lawsuit continues to act as a major overhang on XRP’s long-term valuation. However, with the SEC’s 60-day deadline approaching (June 16), a favorable outcome for Ripple could inject fresh confidence into the market. This coincides with a broader macro backdrop of rising global liquidity, which historically supports risk-on assets such as cryptocurrencies.
Technically, XRP is currently forming a classic bullish flag pattern on the higher timeframes—a continuation structure that often precedes strong upward moves. If price breaks above the flag’s resistance zone and enters a confirmed buy zone, a retest of the breakout area followed by bullish confirmation could signal the beginning of a larger move toward the $10 psychological level.
The alignment of a legal breakthrough, improving macro liquidity, and a bullish chart structure makes this a scenario worth watching closely.
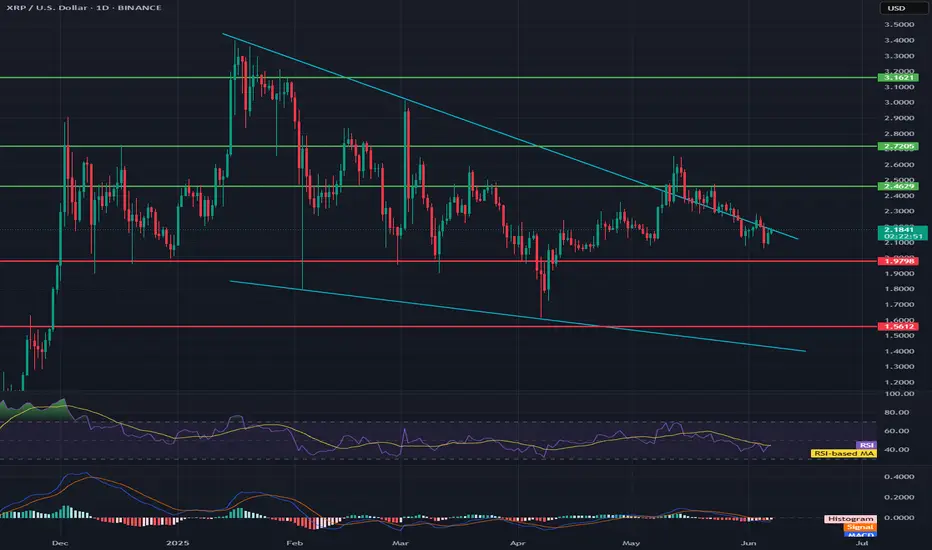
XRP/USD🔍1. Trend and Key Levels
General trend
In the medium term: We see a clear downtrend, marked by two wide blue trend lines (the upper line from the peak around $3.3, the lower from the local lows).
Recent weeks: Consolidation in a wide range between $2.72 and $1.98, with frequent attempts to break out.
📌2. Support and resistance levels
Green lines (resistance):
$3.16 — the historical peak of this wave, very strong resistance.
$2.72 — another strong resistance, around which the price was rejected several times.
$2.46 — local resistance, currently the price is below this level.
Red lines (support):
$1.98 — very important support, tested several times already.
$1.56 — lower support, coinciding with the lower line of the downtrend channel.
3. Market formations and structure
Declining channel: Wide channel marked by two blue lines. Price is moving in its lower half.
Short-term descending triangle: Visible at current levels – local peaks are getting lower, and support is around USD 1.98.
Volume: Volume advantage visible on descending candles.
📊4. Indicators
RSI
Currently around 40 — No clear advantage of the buyer side, slightly below the neutral zone. RSI does not give a signal of overbought or oversold.
RSI-based MA — Oscillates below the level of 50, which confirms the downtrend.
MACD
MAD and signal lines are below zero, without clear divergence.
Histogram: Slight advantage of bears – there is no signal to reverse the trend yet.
🧠5. Near-term scenarios
Bullish
Condition: Breakout above the local downtrend line (~$2.20–$2.25) and return above $2.46.
Target: $2.72 (test of resistance), further move possible to $3.16 in case of strong gains.
Bearish
Condition: Breakout and close below $1.98.
Target: $1.56 (main channel support), and even lower – lower channel line.
Sideways scenario
Further consolidation possible in the range of $2.46–$1.98, until a breakout from this range occurs.
📊6. Sentiment and summary
Medium-term trend: Down.
Buyers are weak, RSI low, MACD does not give a rebound signal yet.
Key level to watch: 1.98 USD – if it falls, the next stop is 1.56 USD.
Only a return above 2.46 USD may give the first signals of a trend change.
🧠Recommendation
For long-term players: Be careful, do not blindly catch the bottom.
For speculators: Play for a rebound only with a short stop below 1.98 USD.
For investors: Wait for a signal confirming a breakout from the channel or a clear divergence on the indicators.
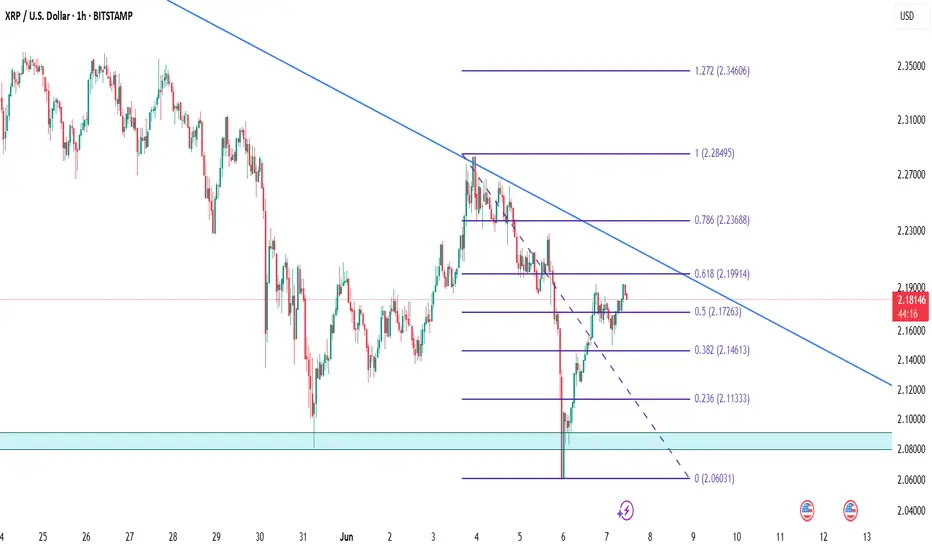
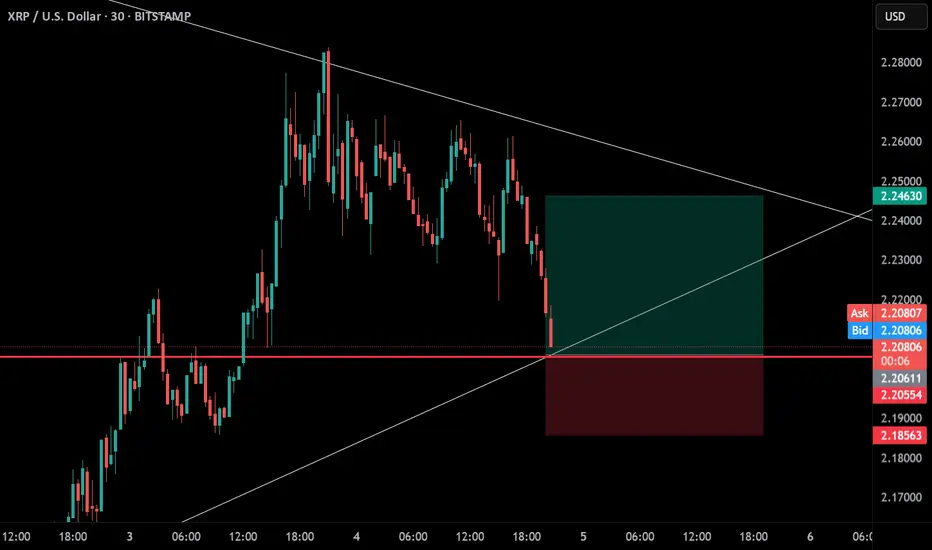
XRPUSDTXRP is currently facing strong confluence resistance near the 0.5–0.618 Fibonacci zone (2.17–2.19), aligned with a descending trendline. The price has failed to break this area decisively, suggesting potential exhaustion of the recent bullish momentum. Unless we see a strong breakout above 2.20, a pullback toward the 2.14 and possibly 2.10 support zones remains likely. This zone acts as a key decision point for the next directional move.
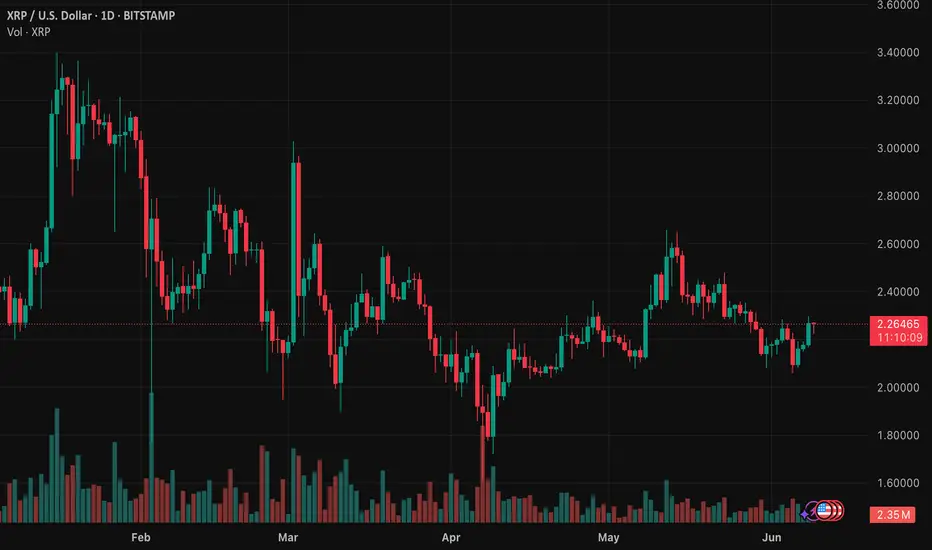
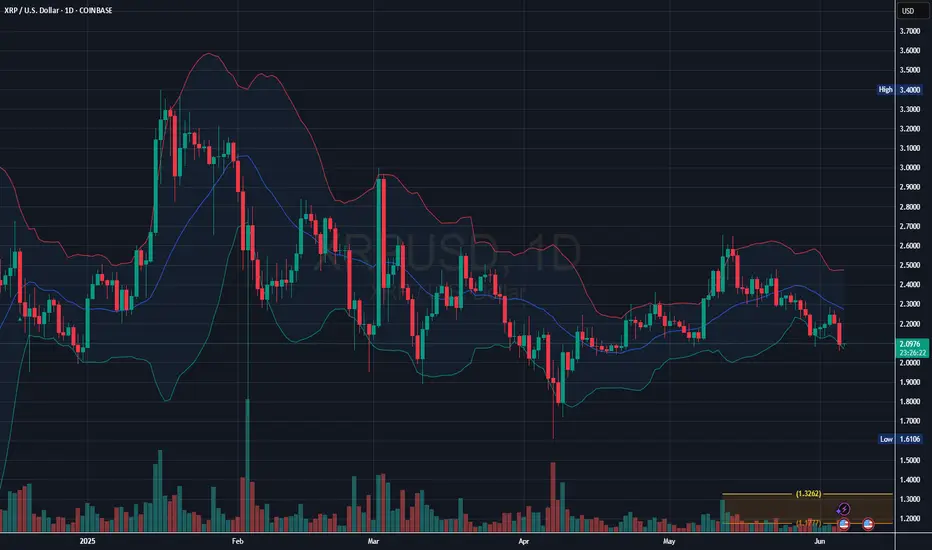
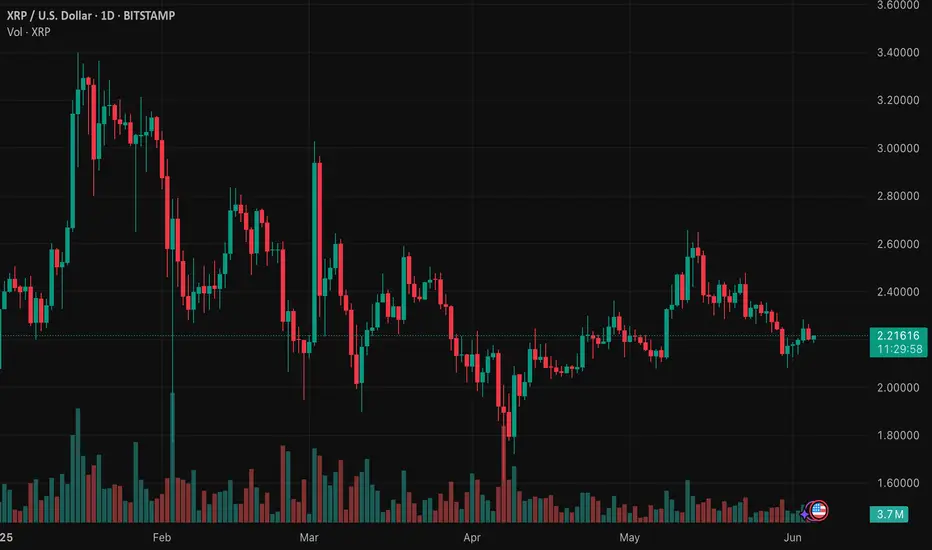
XRP/USD Daily Chart Signals Continued Bearish Pressure
The current price is trading below the midline of the Bollinger Bands (usually a 20-day moving average), which typically indicates downward momentum.
The chart shows a pattern of descending highs and descending lows, which is a classic bearish structure.
The latest candle is red and pushing toward or near the lower Bollinger Band, suggesting increased selling pressure.
Price recently lost the $2.20–$2.30 support zone and is now testing the $2.00 psychological level. If this level breaks, it could open downside toward $1.90 or lower.
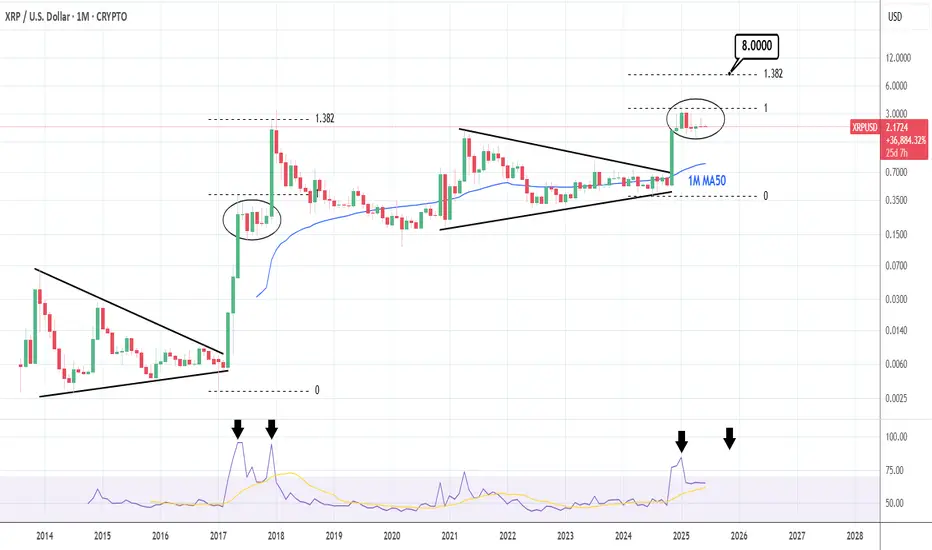
XRPUSD: 5 month consolidation ends and targets $8.00 XRP has turned bearish on its 1D technical outlook (RSI = 41.730, MACD = -0.027, ADX = 31.602) as the price has failed to break above the very tight consolidation that started after January's High. This pattern is however very similar to the June - November 2017 consolidation, which was the last accumulation phase before the eventual January 2018 top of that Cycle. That was accomplished a little over the 1.382 Fibonacci extension. This indicates that we should stay bullish on XRP as it can target again the 1.382 Fib, TP = 8.000.
## If you like our free content follow our profile to get more daily ideas. ##
## Comments and likes are greatly appreciated. ##
Weekly trading plan for XRPBINANCE:XRPUSD has shown a good upward correction over the last couple of days. Now the price has returned to the Pivot point and a local bullish divergence is already visible on the chart. If the price continues the downward movement now, I will consider entering near the support zone, in case the price starts to reverse in the near future, I will consider entering when the local hourly trend changes to green.
If the support is broken, we may see a continuation of the downward correction up to the 0.618 Fibonacci level. More details in the video
Write a comment with your coins & hit the like button and I will make an analysis for you
The author's opinion may differ from yours,
Consider your risks.
Wish you successful trades ! mura

XRPUSD is moving within the 2.1400 - 2.3035 range👀 Possible scenario:
On June 5, XRP traded at $2.20, down 2.36% in 24 hours. The crypto community remains engaged in discussions about XRP’s role in cross-border payments, Ripple’s partnerships, and regulatory challenges.
The ongoing US SEC vs. Ripple lawsuit may face delays as both parties have yet to properly refile their motions ahead of the June 16 deadline. Previously, a proposed settlement to reduce Ripple’s penalty to $50 million was rejected due to procedural errors. If no motion is refiled by June 16, the court may restart the case briefing. If a motion is pending, the process could extend by 60 days. Rumors suggest a possible settlement favoring Ripple, with an announcement expected around June 13, though nothing is confirmed. Meanwhile, XRP’s price has dropped about 8.8% over the past week amid the legal uncertainty.
✅Support and Resistance Levels
Now, the support level is located at 2.1400.
Resistance levels is now located at 2.3035.
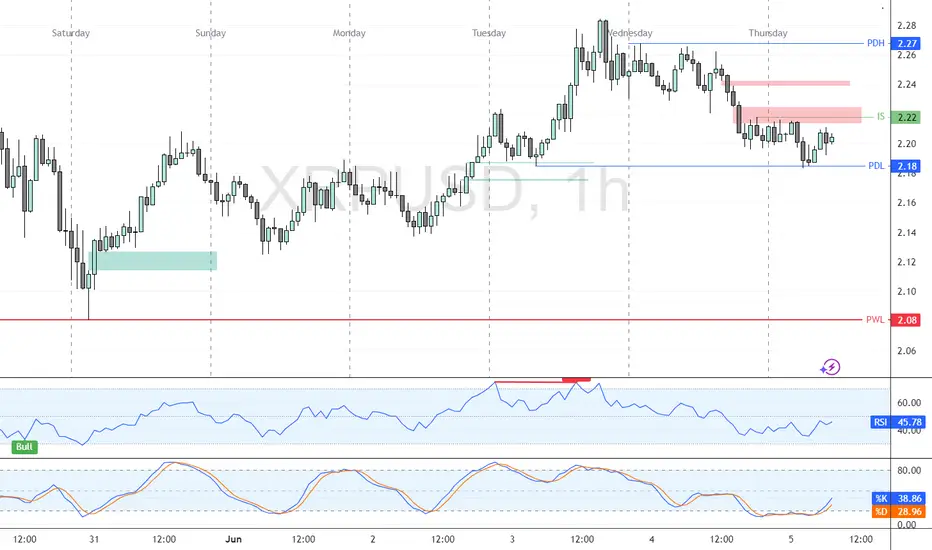
XRP Eyes $2.22FenzoFx—XRP formed a double bottom at 2.218, aligning with Tuesday’s low. Price action set resistance at $2.22, where untriggered liquidity backed by a bearish Fair Value Gap (FVG) remains.
Stochastic exited oversold territory at 39 and is rising, suggesting bullish momentum may continue. If $2.18 support holds, XRP/USD could surpass $2.22 and form a higher high.
The bullish outlook is invalid if XRP declines and stabilizes below $2.18.
XRP IS LOSING hardas All the altcoins follows the big Bitcoin and his trends, XRP also is showing some raging mode.
the fact that his will go bearish in the next weeks, in order to gaim in liquidity, and deal with people's greed sentiment ( smart money ) my friend
Short term bullishPrice about to hit strong trend and a major level.
Short term bullish
Look on my chart
XRPUSD looks set to move higher XRPUSD looks set to move higher after stabilizing above 2.00–2.01. The price action suggests a potential bottom is forming, with a target around 3.50.

XRP - BULLISH MOMEMTUM START - FAKE OR NOT?Good Afternoon,
XRP looking good with some slight BULLISH volume starting. SO far the volume has surpassed previous high however it is far from settled.
ENJOY!

XRP: VIVOPOWER MAKES 100 MILLION DOLLAR XRP PURCHASEVIVOPOWER MAKES ASTONISHING 100 MILLION DOLLAR XRP PURCHASE
Video Timestamps:
0:00 - Vivopower purchases $100,000,000 of XRP
1:25 - XRP Risk Analysis
3:00 - XRP Regression Analysis
3:52 - XRP ETF Update
5:03 - XRP Wyckoff Reaccumulation Analysis
7:22 - META purchasing XRP!?!?!?

Xrp - New all time highs will come next!Xrp - CRYPTO:XRPUSD - is preparing for new all time highs:
(click chart above to see the in depth analysis👆🏻)
Xrp has clearly been trading sideways for the past 8 years. Meanwhile, market structure is respected perfectly and it seems to be just a matter of time until Xrp will create new all time highs. With the recent bullish break and retest, this scenario becomes even more likely.
Levels to watch: $3.0
Keep your long term vision!
Philip (BasicTrading)

XRP Holds Firm—Will Bulls Push It Higher?FenzoFx—XRP bounced from the $2.08 weekly resistance, aligning with the bullish Fair Value Gap. Currently, XRP consolidates at $2.17, with key resistance at $2.21.
A breakout above $2.21 could trigger bullish momentum toward $2.27. However, if XRP closes below $2.08, the downtrend may resume, targeting $2.00.

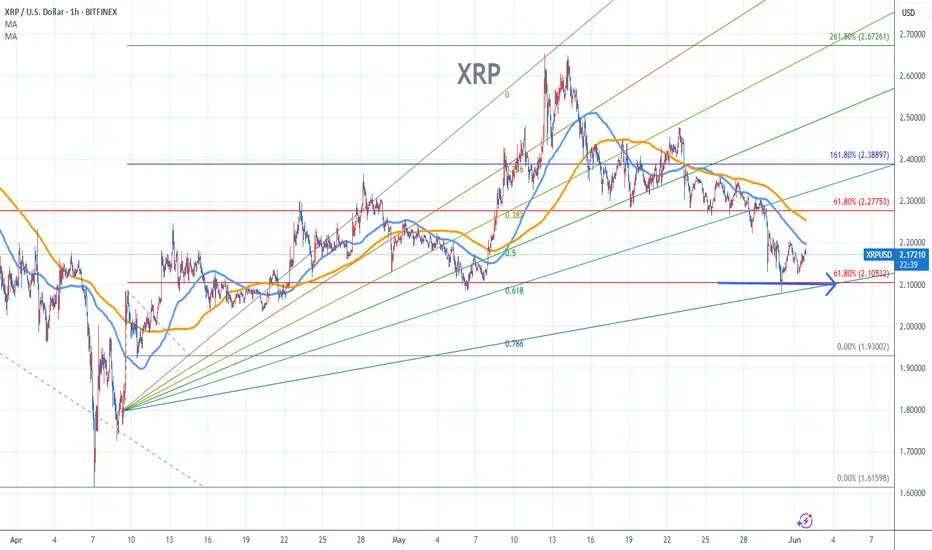
Ripple Stock Chart Fibonacci Analysis 060125Trading Idea
1) Find a FIBO slingshot
2) Check FIBO 61.80% level
3) Entry Point > 2.1/61.80%
Chart time frame:B
A) 15 min(1W-3M)
B) 1 hr(3M-6M)
C) 4 hr(6M-1year)
D) 1 day(1-3years)
Stock progress:A
A) Keep rising over 61.80% resistance
B) 61.80% resistance
C) 61.80% support
D) Hit the bottom
E) Hit the top
Stocks rise as they rise from support and fall from resistance. Our goal is to find a low support point and enter. It can be referred to as buying at the pullback point. The pullback point can be found with a Fibonacci extension of 61.80%. This is a step to find entry level. 1) Find a triangle (Fibonacci Speed Fan Line) that connects the high (resistance) and low (support) points of the stock in progress, where it is continuously expressed as a Slingshot, 2) and create a Fibonacci extension level for the first rising wave from the start point of slingshot pattern.
When the current price goes over 61.80% level , that can be a good entry point, especially if the SMA 100 and 200 curves are gathered together at 61.80%, it is a very good entry point.
As a great help, tradingview provides these Fibonacci speed fan lines and extension levels with ease. So if you use the Fibonacci fan line, the extension level, and the SMA 100/200 curve well, you can find an entry point for the stock market. At least you have to enter at this low point to avoid trading failure, and if you are skilled at entering this low point, with fibonacci6180 technique, your reading skill to chart will be greatly improved.
If you want to do day trading, please set the time frame to 5 minutes or 15 minutes, and you will see many of the low point of rising stocks.
If want to prefer long term range trading, you can set the time frame to 1 hr or 1 day.
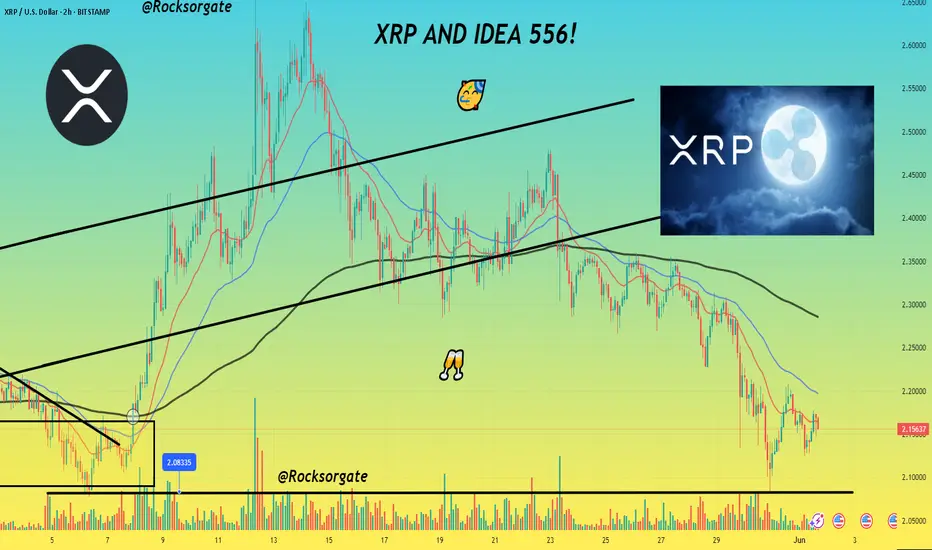
XRP AND IDEA 556!⭐ First thing's first, this is the 556 idea, crazy to say but here we are. Hope everyone is doing well today, it's a chill Sunday and all so we're gonna get a quick idea down for you.
⭐ Again, can't believe it, 556 ideas and counting! Feels like I just started this journey only a few months ago and yet here we are, 741 followers and counting, I couldn't have imagined that but I'm so grateful for it and each and every single one of you, thank you for joining me and supporting me on my journey as we continue to strive for nothing less than success.
⭐ Before we get going with this quick idea, feel free to leave a like and follow for many more great ideas to come! Got some good stuff in mind and excited for all the market has in store for us the next few months, and without further a due, let's give it our best!
⭐ Gonna keep this short and concise since I understand it's Sunday so let's get this done.
⭐ First thing's first, we already see we've exited our trend with that exit of the ascending channel in which we also lost the 200 EMA on the 2 hour timeframe prompting a bearish convergence as we kept trying to establish a higher high but without the support of our 200 EMA prompting the reversal which then formed this descending channel towards the end of May leading into June as referenced below:
⭐ We'll be looking to $2.08 for support should we end up reversing further which is a possibility though unlikely since we've deviated from that 200 EMA and soon enough we're going to have to converge and get a bullish crossover of that 200 EMA which will help send us back up. Till then it's fair game for Bulls and Bears, especially with BITSTAMP:BTCUSD sitting at $105,000 right now as many traders watch which direction Bitcoin looks to take next.
⭐ I'll be watching that $2.08 for support as well as the descending channel and 200 EMA, that's basically it right now, gonna stick to trading objectively and sticking to my indicators. Simply enough then, watch that descending channel to see if we continue within it and trend further down or if we can breakout and get a bullish crossover with our 200 EMA which could help prop us back up above that $2.3 range.
⭐ Gotta go, got a lot of things to get done as usual but thanks so much as always for the support! Still can't believe this makes idea 556! So grateful again for everyone and all the support as we climb this mountain, it may not be easy, but the view at the top will be more than worth it.
Best regards,
~ Rock '