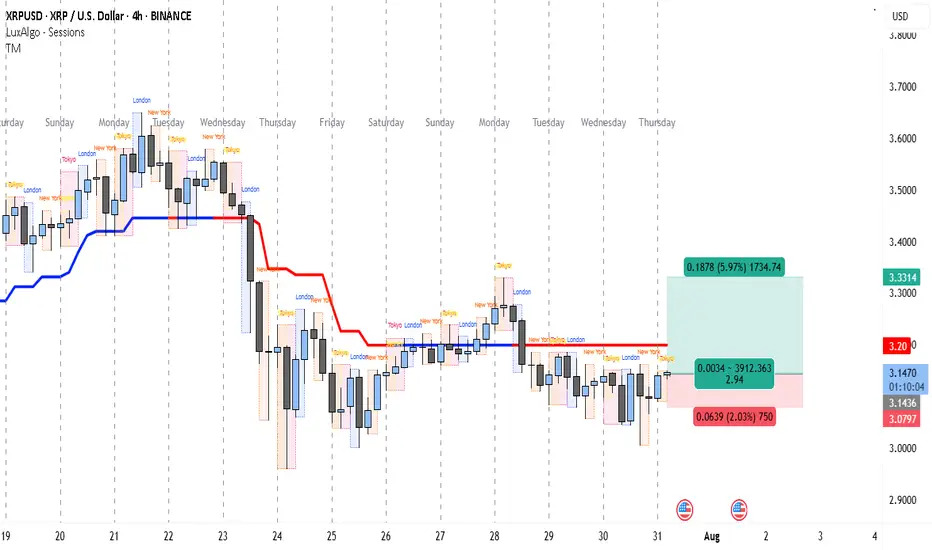
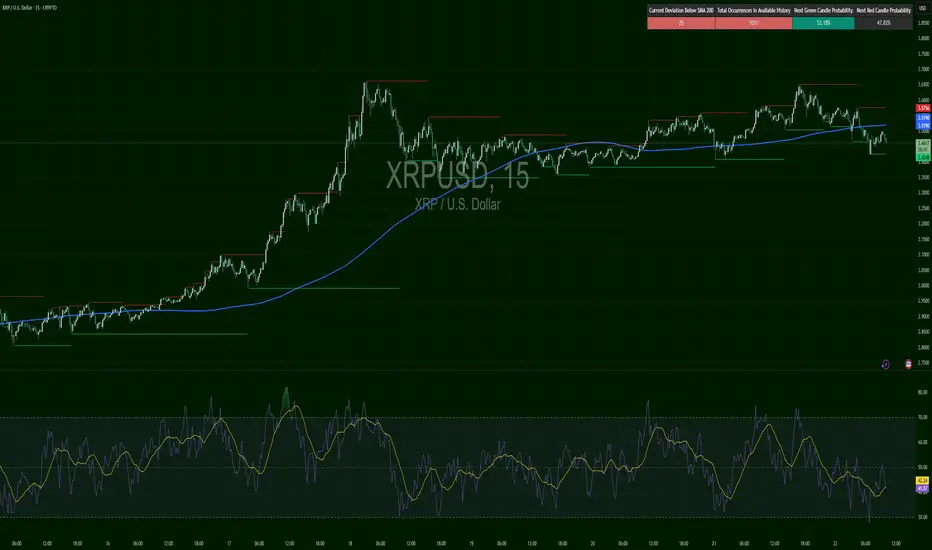
XRP’s 1:3 R:R Setup Could Pay Off FastThe 4-hour chart for XRP/USD indicates a market that has been under selling pressure since the sharp drop around July 23rd, where price broke down from the 3.40+ range. Since then, XRP has been struggling to reclaim higher levels, with the red trend indicator line (likely a moving average or trend-follow tool) acting as a persistent dynamic resistance.
After bottoming near the 3.05 zone on July 25th, the price moved into a sideways consolidation, repeatedly testing both the lower range (around 3.08) and upper range (around 3.20). This tight range suggests accumulation or distribution ahead of a bigger move.
Currently, the chart shows a potential long setup triggered around 3.1450, with a stop loss just below 3.0797 and a take profit target at 3.3314. This setup aims to capture a breakout from the consolidation zone toward the previous resistance area just below 3.35. The risk-to-reward ratio is favorable (close to 1:3), making it an attractive trade for short-term swing traders.
The target level aligns with the price area before the breakdown on July 23rd, where sellers previously gained control. Breaking through that level could signal a short-term trend reversal. However, the price still needs to clear the 3.20 resistance with a strong candle close to confirm bullish momentum.
Trade Setup
• Entry: 3.1450 (current level, inside consolidation support)
• Stop Loss: 3.0797 (below recent swing low)
• Take Profit: 3.3314 (prior resistance zone)
• Risk-to-Reward Ratio: ~1:2.94
• Trade Bias: Short-term long aiming for breakout from consolidation
XRPUSD trade ideas
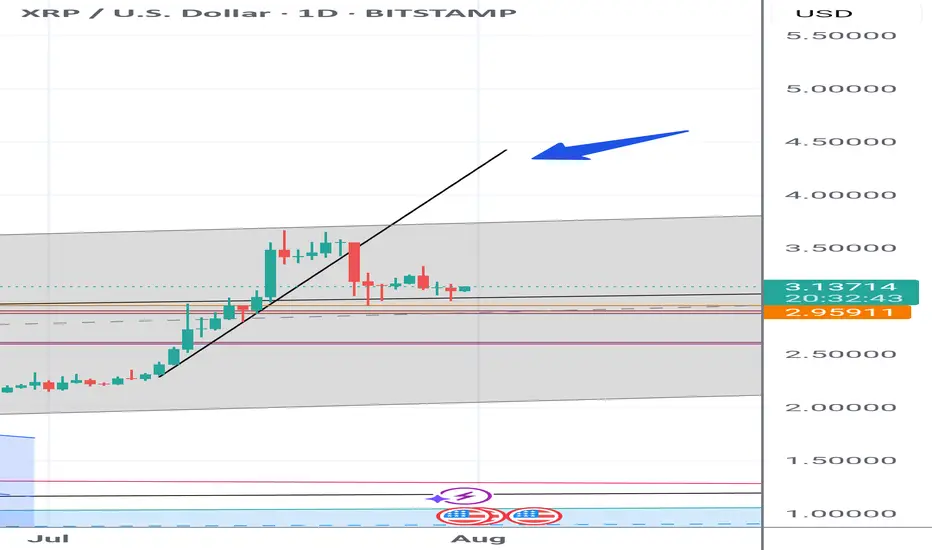
XRP Long!The setup looks solid! On the Daily timeframe, we’re likely seeing the formation of the final leg up. If this structure holds, we could be eyeing new all-time highs in the coming days to weeks. All indicators are aligned for a strong move ahead. Stay tuned for potential breakouts!
my analysis is not based on this i was just bored but moreso its based fundamentally on EMAS, and potential shifts I am anticipating.
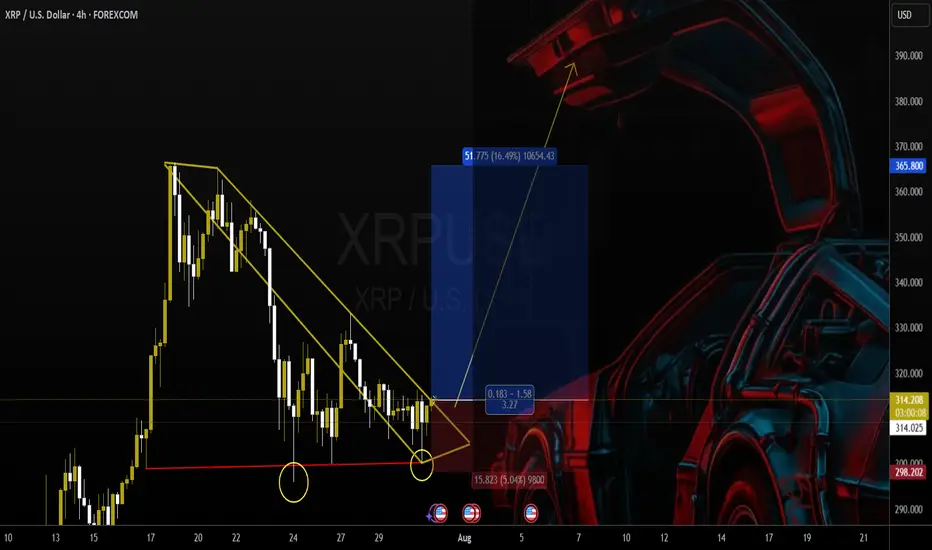
XRP UpdateJust simple analysis, base on breakout line. Hope it will retrace to the blue arrow.
Anyways, do you own analysis and research as well.
☺️
XRPUSD Chart Outlook It's nice to finally say we made it back to the All Time High. Here is what I can see with the current movement we have. It's holding nicely above the double daily but there could be a chance to bottom at the 3.00 to 3.02 range. then push out strong. We have a monthly closure this week & normally we can get some movement at the end of months. just depends. I trade wicks so my zones are on the wicks of previous candle closure, if that helps understand my chart. Happy Tuesday

XRP: Support at $2.960 Holds the Bullish SetupFenzoFx—XRP dipped from $3.666 but stabilized near the monthly anchored VWAP at $2.960. It now trades at $3.142 above the ascending trendline.
Immediate resistance lies at $3.332, aligned with the descending trendline. A close above this level may propel XRP to $3.432. Strong buying could extend gains to the recent high of $3.666.
The bullish outlook stands while XRP/USD holds above key support at $2.960. A drop below this level would invalidate the bullish scenario.

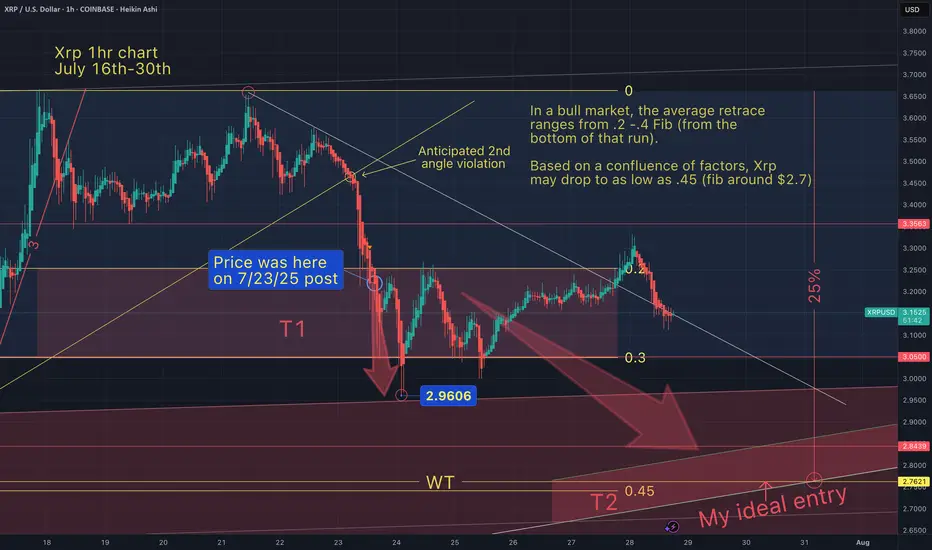
Xrp's next low (T2)5 days ago on my first post (July 23rd), xrp was $3.22.
I suggested that Xrp would continue to drop into T1 around $3. That target was hit at $2.96.
My chart also showed that Xrp could continue to drop to T2 and go as low as $2.75.
Based on price action, I believe my T2 ($2.75 - $2.80) may also be hit. This will be my ideal entry.
Bullish Signals Mount for XRP as Price Holds Weekend GainsXRP at a Crossroads: Technical Strength Meets Fundamental Catalysts in a High-Stakes Market
July 28, 2025 – In the volatile and ever-evolving world of digital assets, few tokens command as much attention, debate, and fervent community support as XRP. The digital asset, intrinsically linked with the fintech company Ripple, is currently navigating a period of intense market focus. After a period of consolidation, XRP is demonstrating renewed strength, holding onto recent gains and pressing against critical technical resistance levels. This price action is not occurring in a vacuum; it is the culmination of powerful undercurrents, including bullish chart patterns, significant accumulation by large holders, and a shifting landscape of regulatory clarity and institutional interest that could define its trajectory for years to come.
As of Monday morning, XRP has shown stability, trading around the $3.16 to $3.24 range. This follows a period where the token has been building momentum, with analysts closely watching key resistance zones between $3.30 and $3.40. A decisive break above these levels could signal the start of a new upward trend, while the ability to hold support, particularly around $3.15 to $3.20, is seen as crucial for maintaining the current bullish structure. This delicate balance has traders and long-term investors alike on high alert, as a confluence of technical indicators and fundamental developments suggests that XRP may be poised for its next significant move.
________________________________________
Chapter 1: Decoding the Charts: Bullish Patterns Emerge
For technical analysts, the recent XRP charts are a compelling study in bullish potential. Several classic patterns and indicators have emerged, suggesting that the path of least resistance may be upwards. These signals, watched closely by traders globally, are fueling a narrative of an imminent breakout.
One of the most discussed formations is the "Cup and Handle" pattern. This is a bullish continuation pattern that resembles a teacup on a chart. The "cup" is a U-shaped or rounded bottom that forms after a price run-up, indicating a period of consolidation and accumulation. This is followed by the "handle," a shorter and shallower downward drift in price, representing a final shakeout before a potential major upward move. Analysts have identified a large cup formation developing on XRP's long-term charts, with some pointing to a breakout zone around $3.64. A confirmed move above the handle's resistance could, according to technical theory, trigger an explosive rally, with some analysts projecting targets as high as $5.18, $7, or even a staggering $30 based on the pattern's depth.
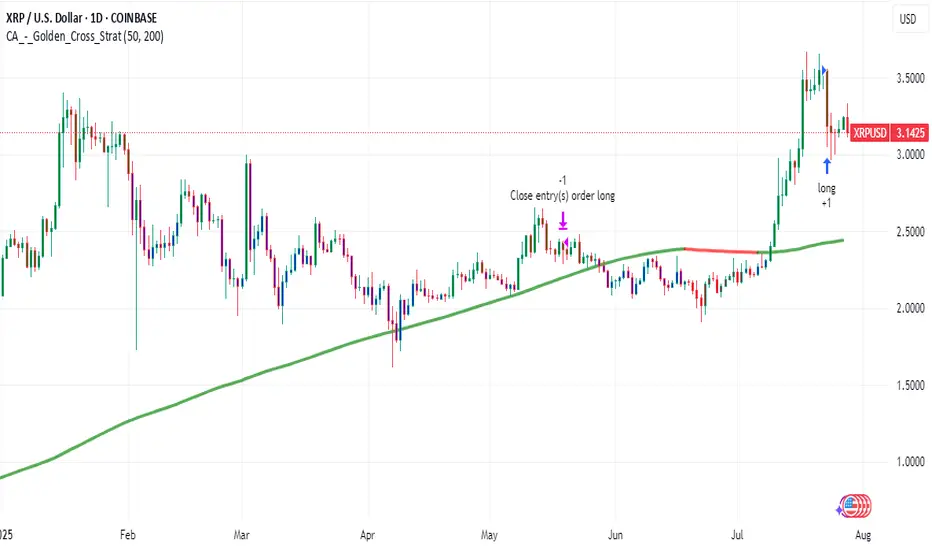
Adding to this bullish thesis is the appearance of a "Golden Cross." This occurs when a shorter-term moving average (like the 50-day) crosses above a longer-term moving average (like the 200-day) on a price chart. It is widely regarded as a signal of a potential long-term uptrend. A golden cross was recently confirmed on XRP's daily chart around July 23, 2025, an event that historically has preceded significant price runs. The last major golden cross in late 2024 was followed by a rally of over 460% in two months. While past performance is not indicative of future results, the reappearance of such a powerful signal has undoubtedly bolstered investor confidence.
Furthermore, a rare golden cross has also been observed on the XRP/BTC trading pair, where XRP's price is measured against Bitcoin. This specific event, where the 23-day moving average crossed the 200-day, previously preceded a 158% surge in the pair's value in just two weeks. The near-identical structure of the current pattern has led analysts to suggest that XRP may be poised to outperform Bitcoin in the near term, especially as Bitcoin's price has been consolidating, shifting investor focus toward promising altcoins.
These technical signals—from the broad Cup and Handle to the precise Golden Cross—are painting a picture of a market coiling for a significant move. They suggest that underlying buying pressure is quietly building, setting the stage for a potential breakout if the market's fundamental drivers align.
________________________________________
Chapter 2: The Whale Effect: Following the Smart Money
Beyond the lines on a chart, the actions of the market's largest players—colloquially known as "whales"—provide another critical layer of insight. These are individuals or entities holding vast amounts of a cryptocurrency, and their trading activity can significantly influence market trends and sentiment. Recently, on-chain data has revealed a clear and compelling trend: XRP whales are accumulating.
In a remarkable show of force, wallets holding between 10 million and 100 million XRP have been steadily increasing their holdings, adding over 130 million XRP in a single day recently. These large-scale investors now control approximately 14% of the circulating supply, a historic high for this cohort. This accumulation is significant because it suggests that sophisticated, well-capitalized market participants are confident in XRP's future prospects and are positioning themselves for a potential price increase.
Simultaneously, the flow of XRP from whale wallets to exchanges has plummeted by over 93% since early July. This is a crucial indicator, as large transfers to exchanges often signal an intention to sell. The sharp decline suggests that whales are not only buying more XRP but are also holding onto their existing assets, reducing the available supply on the market and removing significant sell-side pressure. This behavior, often described as a "supply shock," can create a powerful tailwind for the price if demand continues to rise.
This intense accumulation has not gone unnoticed. In one instance, two identical transactions moved a combined 306.4 million XRP, worth nearly $1 billion, from an exchange to a private wallet within 60 seconds. Such large, coordinated movements are often interpreted as strategic positioning ahead of anticipated positive news or a market-wide rally. This activity, combined with reports of over 2,700 wallets now holding at least 1 million XRP each, paints a picture of broad-based accumulation among the asset's most significant backers. This "smart money" activity often provides a psychological boost to retail investors, reinforcing the belief that a major move could be on the horizon.
________________________________________
Chapter 3: The Fundamental Pillars: Regulation, ETFs, and Utility
While technicals and whale movements drive short-to-medium-term sentiment, the long-term value of any digital asset rests on its fundamental pillars. For XRP, these pillars are its evolving regulatory status, the tantalizing prospect of a spot Exchange-Traded Fund (ETF), and its core utility within Ripple's global payments network.
Regulatory Clarity on the Horizon:
The most significant overhang on XRP for years has been the lawsuit filed by the U.S. Securities and Exchange Commission (SEC) in December 2020, which alleged that Ripple conducted an unregistered securities offering. This legal battle has been a focal point for the entire crypto industry. However, recent developments have shifted sentiment dramatically. Key court rulings, including a partial victory for Ripple where a judge determined that some of its XRP sales did not qualify as securities, have bolstered institutional confidence.
Currently, the case is in a delicate phase, with both Ripple and the SEC having paused their respective appeals. While rumors of a final settlement swirl, legal experts caution that the process is subject to the SEC's internal bureaucratic procedures and a formal vote is still required. Nevertheless, the prevailing belief is that the worst of the legal uncertainty is over. A final resolution, which many hope will come before the end of the year, would remove the primary obstacle to XRP's full-scale adoption in the United States and could pave the way for its relisting on major exchanges and inclusion in institutional products.
The Race for a Spot XRP ETF:
Following the landmark approvals of spot Bitcoin and Ethereum ETFs, the crypto market is buzzing with anticipation for what comes next. XRP is widely considered a prime candidate for its own spot ETF. Asset management giants like Grayscale, Bitwise, Franklin Templeton, and WisdomTree have already filed applications with the SEC.
The approval of a spot XRP ETF would be a watershed moment, providing a regulated, accessible, and insured investment vehicle for both retail and institutional investors in the U.S. to gain exposure to XRP. The launch of XRP futures-based ETFs has been seen as a positive precursor, following the same playbook that led to the spot Bitcoin ETF approvals. Market analysts and prediction markets have placed the odds of a spot XRP ETF approval in 2025 as high as 92-95%, contingent on a favorable resolution of the SEC lawsuit. Such an approval could unlock billions of dollars in institutional inflows, dramatically increasing demand and market legitimacy for the asset.
Core Utility in Global Payments:
At its heart, XRP was designed for utility. It serves as the native digital asset on the XRP Ledger, a decentralized blockchain engineered for speed and efficiency. Its primary use case is powering Ripple's payment solutions, which are now part of the broader Ripple Payments suite.
Ripple's network is designed to challenge the legacy correspondent banking system, exemplified by SWIFT, which can be slow and costly for cross-border payments. By using XRP as a bridge currency, financial institutions can settle international transactions in seconds for a fraction of a cent, without needing to pre-fund accounts in foreign currencies. This utility is not merely theoretical. Ripple has forged partnerships with over 300 financial institutions across more than 45 countries, with a significant portion utilizing XRP for liquidity. In 2024 alone, over $15 billion was transacted via Ripple's liquidity solutions, and the XRP Ledger is now processing over 2 million transactions daily. This growing, real-world adoption provides a fundamental demand for XRP that is independent of market speculation and forms the bedrock of its long-term value proposition.
________________________________________
Chapter 4: The Retirement Dream: Audacious Predictions and Future Outlook
The convergence of bullish technicals, strong fundamentals, and growing market optimism has led to a wave of bold price predictions from analysts. While highly speculative, these forecasts illustrate the immense potential that many see in XRP, fueling a narrative that significant holdings could lead to life-changing wealth.
Price targets for the current cycle vary widely, reflecting different models and timelines. Short-term targets frequently center around the $4 to $7 range, with some analysts suggesting a move to $9 or $15 is possible if momentum continues. One analyst, citing a rare bullish chart pattern, sees a potential 60% rally to around $4.47.
Looking further out, the predictions become even more audacious. Projections based on historical cycles and technical models, such as Elliott Wave theory, have put forth long-term targets of $16, $24, and even $27. Some AI-driven prediction models forecast that XRP could reach the $10-$20 range by the end of 2025, especially if an ETF is approved. Longer-term forecasts extending to 2030 suggest prices could potentially climb to between $19 and $48, depending on the level of global adoption.
These predictions have given rise to the "retire on XRP" dream among its community. For instance, if XRP were to reach one analyst firm's high-end forecast for 2030 of $32.60, an investment of 10,000 XRP could be worth over $326,000. While tantalizing, it is imperative for investors to approach such forecasts with extreme caution. The cryptocurrency market is notoriously volatile, and such high-reward potential is invariably accompanied by high risk. Regulatory setbacks, macroeconomic downturns, or a failure to achieve widespread adoption could all significantly impact XRP's future price.
Conclusion: A Confluence of Forces
XRP currently stands at one of the most fascinating junctures in its history. The digital asset is being propelled by a powerful confluence of forces: bullish technical patterns are signaling a potential breakout, on-chain data shows undeniable accumulation by its largest holders, and its fundamental value proposition is being strengthened by increasing regulatory clarity, the imminent possibility of a spot ETF, and steadily growing real-world utility.
The journey ahead is fraught with both immense opportunity and significant risk. A decisive break above its current resistance could unleash the momentum that analysts and investors have been anticipating for months. However, the market remains sensitive to legal news and broader macroeconomic trends. For now, XRP remains a bellwether asset, its story a microcosm of the broader struggle and promise of the digital asset industry—a high-stakes battle for legitimacy, adoption, and a permanent place in the future of finance
Possible Trend change to the mid 3.30'sAt mid 3.30's is a possible target for the next 48 hours. Let's see if we get a trend change from the 3.25 level.

XRP/USD Chart Hack – Rob the Market Before the Bears Do🏴☠️💸 XRP/USD Crypto Market Heist Plan: Thief Trader Style 💰📈
"Break the Vault, Rob the Trend – One Candle at a Time!"
🌍 Hi! Hola! Ola! Bonjour! Hallo! Marhaba! 🌍
To all fellow money makers, day robbers & chart thieves... welcome to the vault!
We’re diving into the XRP/USD (Ripple vs. U.S. Dollar) with a bold Thief Trading™ Strategy, blending technical mastery and market intuition.
📊 THE PLAN: Rob the Resistance – Swipe the Highs
🔥 Based on Thief Trading-style TA & FA combo, here's the master heist setup:
Long Bias ⚔️
Target: The High Voltage Resistance Zone
Status: Overbought + Trap Level = High Risk, High Reward
Market Mood: Bullish but risky – consolidation & reversal zones ahead
Crowd Behavior: Bearish robbers strong above, but we strike below
🧠 Thief Wisdom:
“The vault's open, but not every vault is unguarded. Wait, plan, attack with strategy.”
📥 ENTRY PLAN
The Heist Begins at the Pullback...
Use Buy Limit Orders (Thief Style: DCA / Layering)
Entry Zones: Near recent swing lows or within 15–30 min pullbacks
Let the price come to your trap – precision is our weapon
🛡️ STOP LOSS STRATEGY
Guard Your Loot – Always Secure Your Exit
SL Example: 2.8500 (3H TF swing low)
Customize SL based on:
⚖️ Your lot size
🎯 Risk tolerance
🔁 Number of entry layers
Remember: We don’t chase losses – we protect capital like it's gold
🎯 TARGET
Final Take-Profit: 4.0000
But hey… Thieves escape before alarms ring!
💡 If momentum slows, don’t be greedy. Exit smart, exit rich.
📡 FUNDAMENTAL + SENTIMENTAL OVERVIEW
The bullish bias is supported by:
📰 Macro Events
📊 On-Chain Signals
📈 COT Reports
🔗 Intermarket Correlations
📢 Sentiment Analysis
👉 Stay updated with the latest data — knowledge is the thief’s ultimate tool.
⚠️ TRADING ALERT – News Can Wreck the Heist
To survive news spikes:
🚫 Avoid entries during high-impact releases
📉 Use trailing SL to protect your open profits
🛑 Adjust exposure during uncertain volatility
❤️ SUPPORT THE CREW – BOOST THE PLAN
If this plan added value, hit the 🔥BOOST🔥 button.
It helps grow the Thief Trading Team, and together we rob smarter, not harder.
💬 Drop your feedback, thoughts, or charts below – let’s build the crew!
💎 Every candle tells a story. We don’t follow the trend – we rob it.
💣 Stay alert, stay rogue, and I’ll see you at the next market heist.
💰 Until then… chart smart, trade savage. 🐱👤💵

XRPUSD – Trend Bent, Bias BearXRP broke structure on the downside after failing to hold $3.59, slicing through the 200 SMA. Momentum flipped bearish with RSI stuck under 50, signaling distribution phase. Support rests at $3.42. Bulls need a fast reclaim of $3.50 to regain control — until then, lower highs dominate.
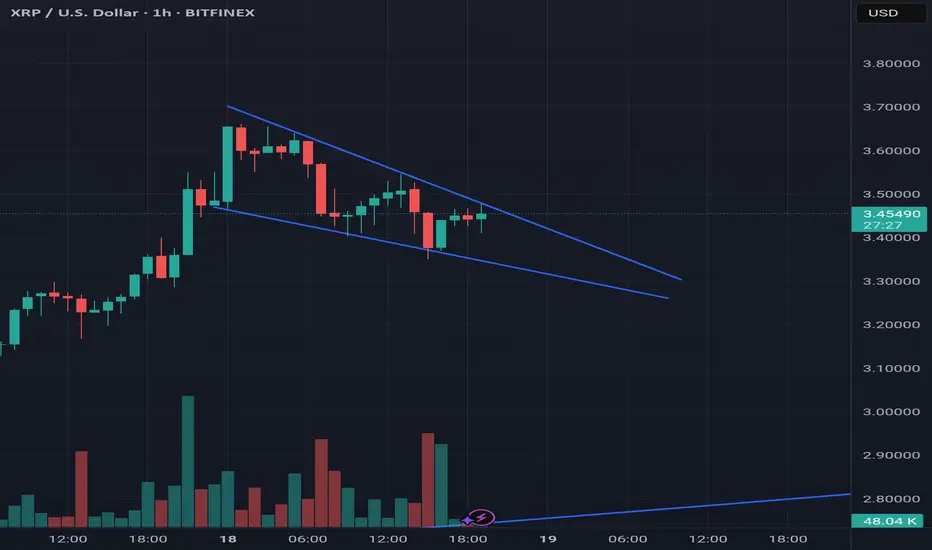
XRP 1H Chart Analysis - Breakout PotentialThe price is currently testing the 0.702 resistance level on the 1H chart, a key zone with historical rejections. A decisive break above 0.702, confirmed by a strong bullish candle and higher volume, could target 1.363. If the price breaks above 1.000 with solid confirmation, XRP might enter price discovery, pushing toward uncharted highs.
Key Levels:
Resistance: 0.702 (current), 1.000 (major), 1.363 (next target)
Support: 0.469, 0.382, 0.236
Strategy:
Enter long on a confirmed break above 0.702, aiming for 1.363, with a stop-loss below 0.469 (1:2 risk-reward).
For a 1.000 breakout, go long with a stop-loss below 0.702, using a trailing stop as prices extend.
Watch for volume spikes to validate moves.
Alerts:
Set an alert at 0.702 for a 1% break above.
Add an alert at 1.000 for a 1% break above to catch price discovery.
Stay cautious of false breakouts and monitor real-time data for confirmation.

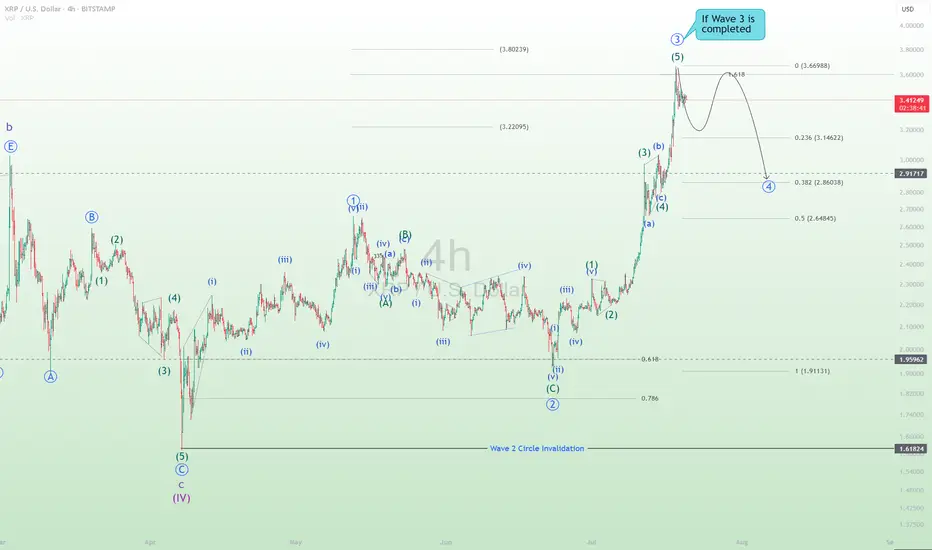
XRPUSD - If Wave 3 is completedNow we see XRPUSD reached the level 1.618, a trader's psychological level for wave 3. If most traders take profit at this level accompanied by big volume, most probably we are going to see a new downtrend of wave A of wave 4.
Once Again You Are Getting Ripped Off On XRP.Pro Crypto President.
SEC Case.
Mass Adoption.
Multiple Partnerships
Mainstream
Huge Volume The Last Year
ETF Approval
Crypto Bills Passed By Congress
Still cant beat 2017 All Time Highs. They are ripping you off on the price action...!
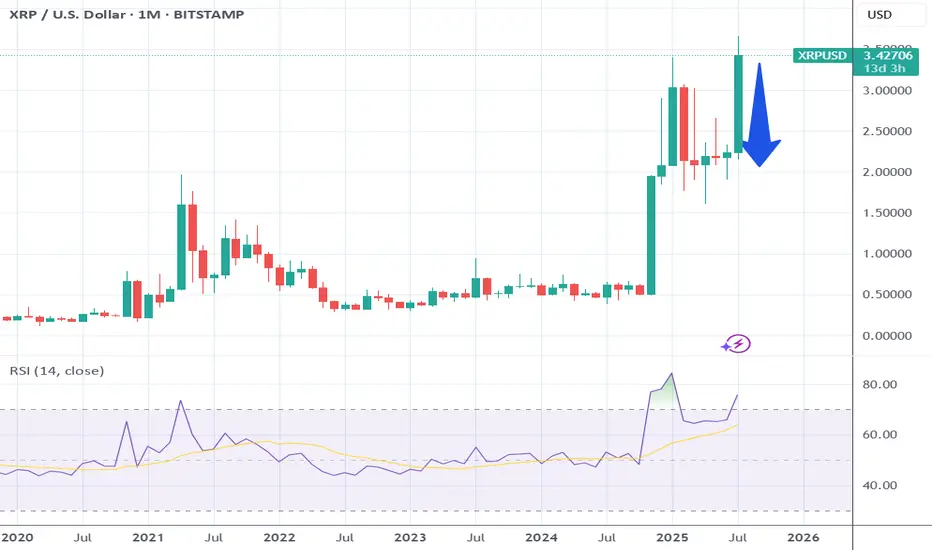
Whats the catalyst going forward?
The Feds are soon going to cut rates multiple times. Bitcoin tanks everytime when that happens.
This was a crypto pump into whats coming.
This will close with a Monthly double top and August Starts the free fall.
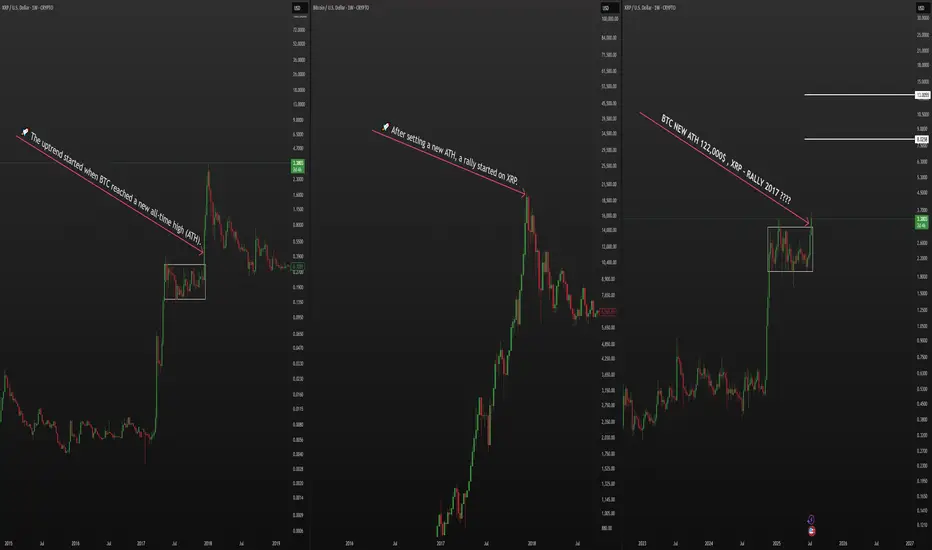
XRP - RALLY!!! 2017 YEAR! LET'S RUN!🔍 Major observation:
Back in 2017, when Bitcoin reached its cycle top, XRP began a massive rally, which marked the beginning of the bear market.
📊 Currently, XRP's structure looks almost identical to 2017 — we've broken out of accumulation.
Is it time for the final rally?
📉 I'm betting that BTC won’t make a new all-time high, while XRP surges to $8+, kicking off the next bear market!
Buy the dip. BullishWhen xrp breaks out of this pattern we can expect much more upside. Entering price discovery.
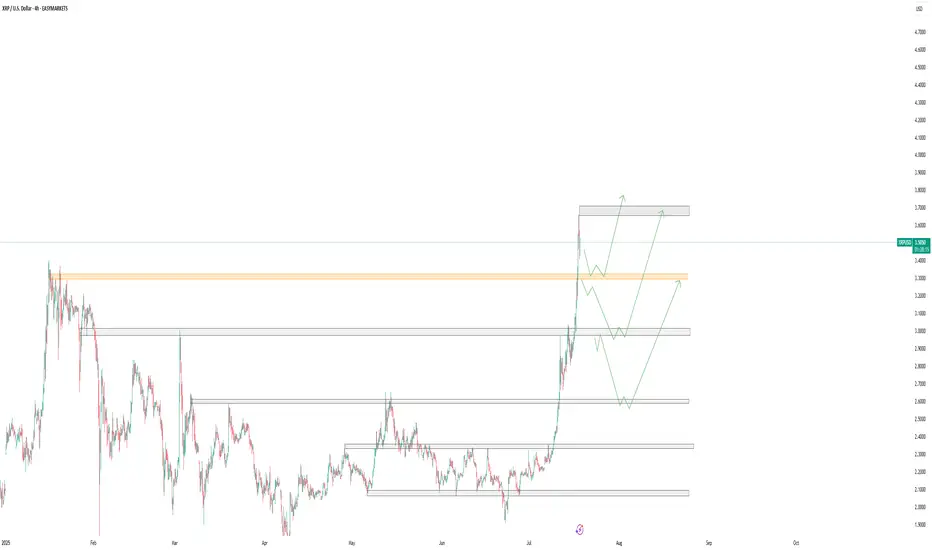
XRP Intra-day Analysis 18-Jul-2025Price action on XRP has shown upward momentum after reaching the 3.7 price level.
Possible scenarios include:
* The 3.3 level could come into focus if the market revisits this area. Market participants may monitor it for signs of seller exhaustion or potential reversal patterns.
* Should the price move lower, the 3.0 level may act as the next key area of interest. This round number is often viewed as a psychological level and may attract increased attention from traders.
* If there is a clear intraday move below the 3.0 level, the 2.6 area could emerge as another notable zone that some participants may consider relevant for future market reactions.
Disclaimer: easyMarkets Account on TradingView allows you to combine easyMarkets industry leading conditions, regulated trading and tight fixed spreads with TradingView's powerful social network for traders, advanced charting and analytics. Access no slippage on limit orders, tight fixed spreads, negative balance protection, no hidden fees or commission, and seamless integration.
Any opinions, news, research, analyses, prices, other information, or links to third-party sites contained on this website are provided on an "as-is" basis, are intended only to be informative, is not an advice nor a recommendation, nor research, or a record of our trading prices, or an offer of, or solicitation for a transaction in any financial instrument and thus should not be treated as such. The information provided does not involve any specific investment objectives, financial situation and needs of any specific person who may receive it. Please be aware, that past performance is not a reliable indicator of future performance and/or results. Past Performance or Forward-looking scenarios based upon the reasonable beliefs of the third-party provider are not a guarantee of future performance. Actual results may differ materially from those anticipated in forward-looking or past performance statements. easyMarkets makes no representation or warranty and assumes no liability as to the accuracy or completeness of the information provided, nor any loss arising from any investment based on a recommendation, forecast or any information supplied by any third-party.
XRP Retests Previous All-Time High as Bullish Setup DevelopsFenzoFx—XRP (Ripple) is tested and has stayed above $3.40, the previous all-time high. This level acts as support, backed by the VWAP from Thursday's low and the bullish FVG.
If this level holds, we expect the cryptocurrency to aim higher, targeting $3.60, followed by $3.66.

XRPUSD - Why I see that Ripple even higherMedianlines, aka "Forks" have a simple but effective ruleset inherent. These rules describe the movement in certain situations. And of course, the most probable path of wher price is trading to.
Here we a rule in play that projects more movement to the upside, even if BTCUSD has had a strong pullback to the south.
Let's see:
If price is closing above a Centerline, then chances are high that it will retest it. If it holds and starts to continue it's path (to the upside), then the next target is the U-MHL, or the Upper Medianline Parallel, was Dr. Allan Andrews named it back many decades ago.
So, there we have it.
Chances are high that Ripple will reach new highs, with a final target at the U-MLH.

XRP rally to $8.50After XRP broke above the resistance at $1.80 now that became the major support for the past few months and XRP is taking off again.
According to this huge monthly triangle and calculate from the breakout, so the next target for XRP is $8.50 for the coming months.

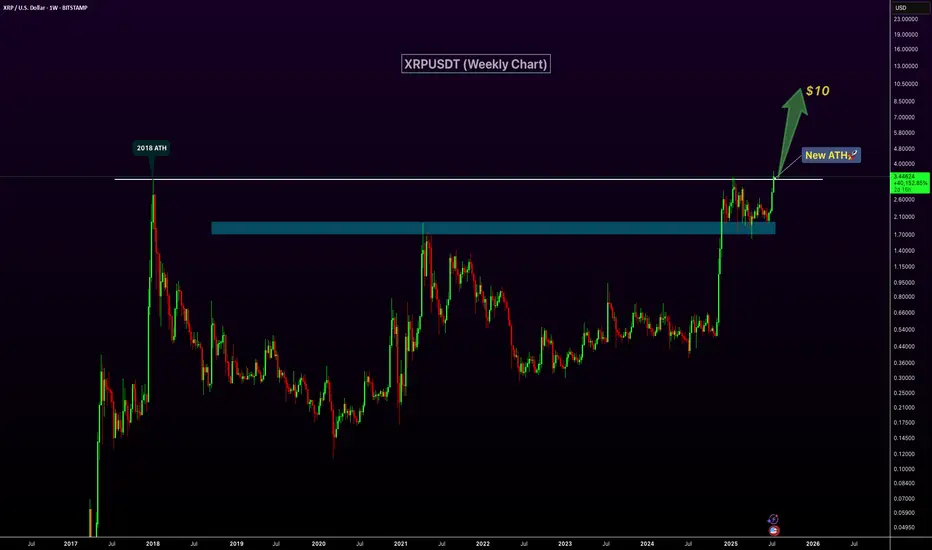
XRP Breaks 2018 High – New ATH Confirmed!XRP has officially broken above its 2018 peak, signaling a major bullish breakout and printing a new all-time high on the weekly chart. The previous resistance zone around $2.6–$3 has now flipped into strong support, confirming the strength of this move. With increasing volume and momentum behind the rally, XRP appears well-positioned for continued upside. The next key psychological target lies at $10, and current price action suggests a clear path toward that level. If bullish sentiment continues, this breakout could mark the beginning of a significant new uptrend.
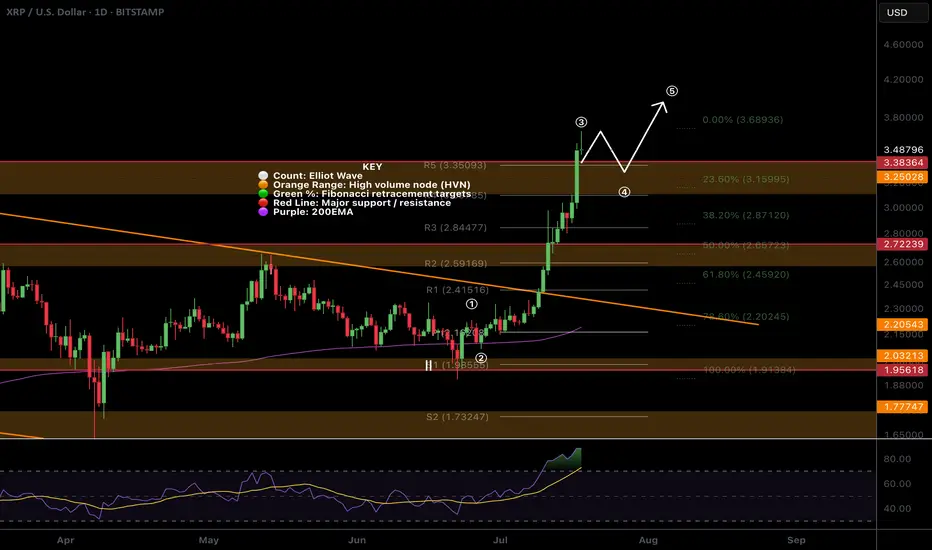
$XRP All time high! Time to sell or...?CRYPTOCAP:XRP appear to have completed wave 3 with a poke above all time high, typically this os behaviour of a wave 5.
The daily R5 pivot point has been breached so there is a significant chance of a decent pullback now but I wouldn't bet against the trend!
Wave 4 could be shallow, targeting the previous all time high, High Volume Node with waver 5 completing near $4.
Daily RSI is overbought but no bearish divergence yet which will likely emerge during wave 5.
Safe trading
Smart Money Trap or Final Push? | XRPUSD Ready for Rejection Professional XRPUSD Analysis (18 July 2025)
XRPUSD has shown a parabolic move recently, tapping into a high-probability resistance zone between $3.80 – $3.89, an area where liquidity likely sits for institutional players. Price reacted strongly upon entry, suggesting buy-side liquidity was swept and now potential distribution is in play.
🔑 Key Zones:
Resistance: $3.80 – $3.89 (potential reversal zone)
Target (Short-Term): $3.17
Strong Support: $1.80 – $2.00
🧠 Smart Money Perspective:
Market Structure Break (MSB): A clear sign of a possible internal shift after the impulsive rally.
Liquidity Sweep: Price wicked into resistance before pulling back — a classic trap for late buyers.
Expected Play: Look for a possible lower high formation, then continuation towards the target at $3.17.
📉 Trade Idea: A short opportunity can be considered if price fails to reclaim above $3.80 and shows further bearish price action or supply zone rejection confirmation.

XRP Special UpdateJust wanted to give y'all a heads up that XRP is within the target box for (5) of ((3)). If you look up my old posts from March and even as far back as January, you will see I have not changed this chart at all. It is doing exactly what the pattern had been telling us it would. I went ahead and sold the rest of my position, so I am now flat XRP. Will it move higher still yet? I believe it will, yes. However, it could turn around very soon so I found it better to collect my profits while I had the opportunity. A wise man once said, "profit is a thief, take it while you can." Don't get greedy in this game, or you will come to regret it!
FYI: I think the 1.382 is a reasonable place for this pattern to end. If we can get a 3-wave retracement, there is a high probability I re-enter with tight stops for another leg higher.
