[$XRP] [$XRP] levels - best guess - quick video updateCOINBASE:XRPUSD
no financial advice.
quick update to crypto: XRP ✨😎👍
*correction: While showing the 'volume areas' -> there are no 'ASK (Sell-Orders)' to be filled; so we are directly pushing through it atm
XRPUSD trade ideas


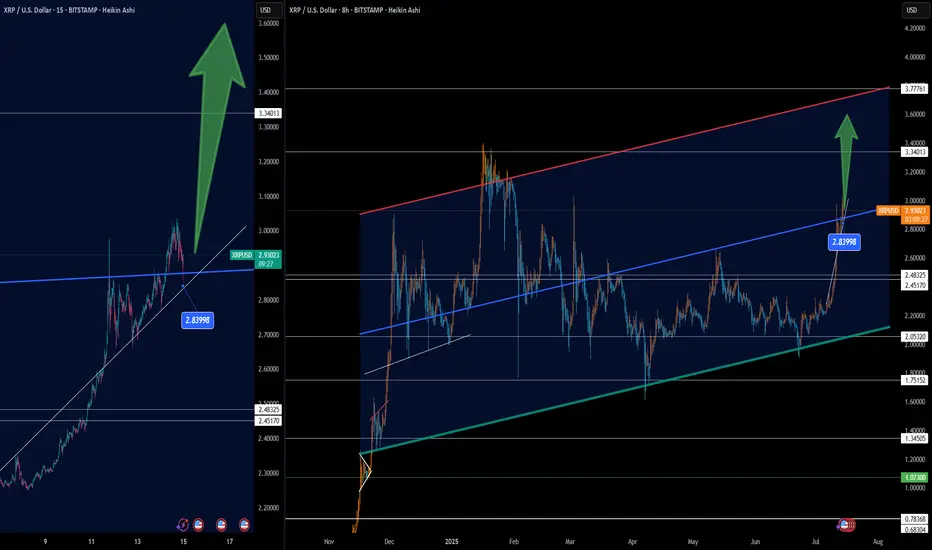
XRP Bullish Continuation Eyes Key Resistance at $3.34🚀📈 XRP Bullish Continuation Eyes Key Resistance at $3.34 💥🧠
XRP is showing remarkable strength as it continues to push higher within a well-defined ascending channel. On the 8H chart, we can see price breaking through mid-channel resistance, now retesting the zone around $2.84. This level acted as both a prior resistance and now potentially a launchpad for the next leg up.
The structure suggests:
🔹 A breakout retest scenario, confirming bullish continuation
🔹 Immediate resistance at $3.34, followed by the upper boundary of the channel near $3.77
🔹 Strong support from the dynamic trendline and former breakout zone
The 15-min Heikin Ashi view reinforces momentum: price is respecting the ascending trendline and holding above key breakout levels.
📊 As long as price holds above $2.84, this breakout remains valid, with the potential to target the upper channel resistance.
Technical traders may be watching for:
✅ A bullish engulfing or confirmation candle near current levels
✅ Volume spike on retest bounce
✅ Divergence or RSI confirmation on lower timeframes
Patience pays when structure aligns. Let's see if XRP delivers the full move.
One Love,
The FXPROFESSOR 💙
Disclosure: I am happy to be part of the Trade Nation's Influencer program and receive a monthly fee for using their TradingView charts in my analysis. Awesome broker, where the trader really comes first! 🌟🤝📈
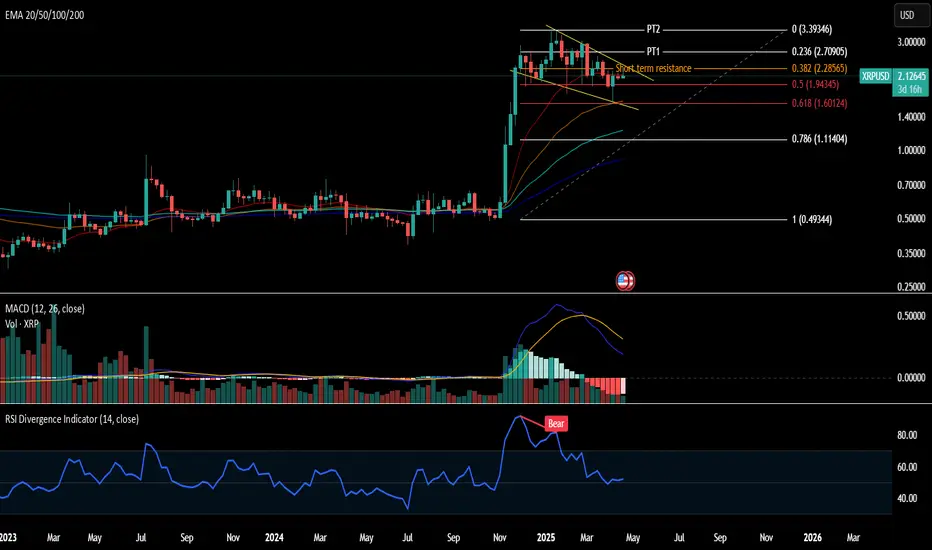
Long - XRP (Weekly Chart)Long Swing Position
Perfectly bounced from .618 and RSI above 50. Expect the bullish momentum
Entry : $2.15
Resistance: $2.3
PT1: $2.7
PT2: $3.39
PT3: Update after crossing PT2
Stop loss: If it shows sign of weak rally to the upside, RSI cross below 50. Stop loss below fib 0.5 at $1.9 & monitor price movement when hitting fib 0.618 -> stop loss below it or re-entry when showing strong rally sign.
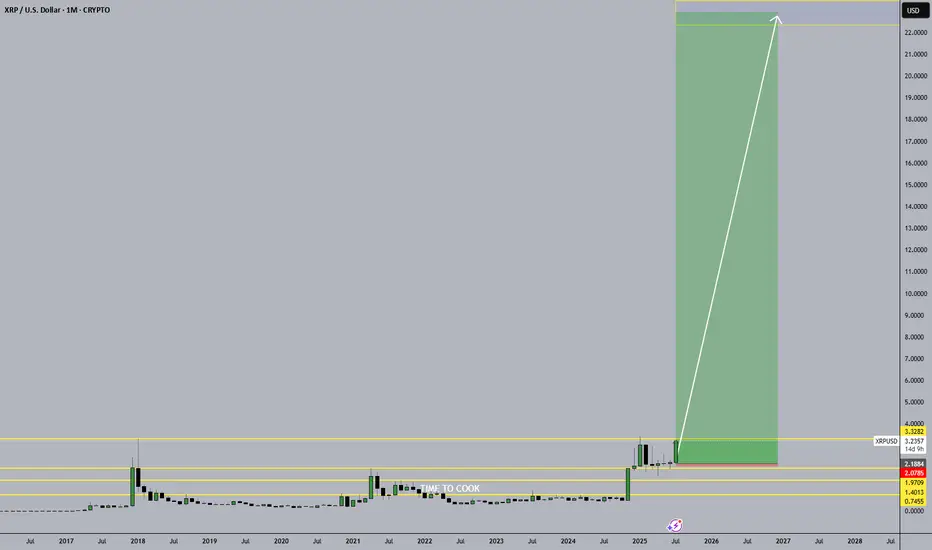
The RATS are out of the KITCHEN. It's TIME to COOKA simple trade - looking for XRP > $22 by December 2026, if it survives this breakout.
A token backed by dark state money.
XRP of 2025 is not XRP of 2017. But Ronin could be.You guys need to have some self awareness, that the magic happens just once, maybe twice in life. The 700x+ move in 2017 isnt happening in 2025. 2024-2025 is different, up? yes xrp will go up but not 1000x.

XRP: Order Block at $3.40 Could Cap The RallyFenzoFx—Ripple's bullish momentum resumed nonstop, offering no clear pullback for entry. Currently, XRP is testing resistance at $3.40 within an order block. Momentum indicators remain in overbought territory, signaling short-term overpricing.
Volume profile shows limited resistance at present levels, suggesting a likely retest of $3.40. If this resistance holds, a pullback toward support around $3.00 is expected. This level can provide a discount to join the bull market.

Fractal Heaven!!To me this seems like the perfect outcome of why we're starting to really push up! We've had 3 clear fractals in play on the moves higher. And you can see at the green line, it all flattened out, and it showed with the first 2 fractals that it wasn't heading lower. Fractals are incredible indicators as you can see.

XRP: 22 Minutes to LIFT OFF!I'm bullish, no question about it.
I wouldn't want to be on the other side of this trade right now. Everything I'm seeing points to a strong move coming soon.
Weekly cross is giving confirmation.
Bullish engulfing on the hourly, with momentum building across lower timeframes.
Price action suggests we're setting up for a retest of the previous ATH, and there's a real possibility of printing new highs from here.
Season’s about to kick off — I’m positioned accordingly.
Due in 15 minutes
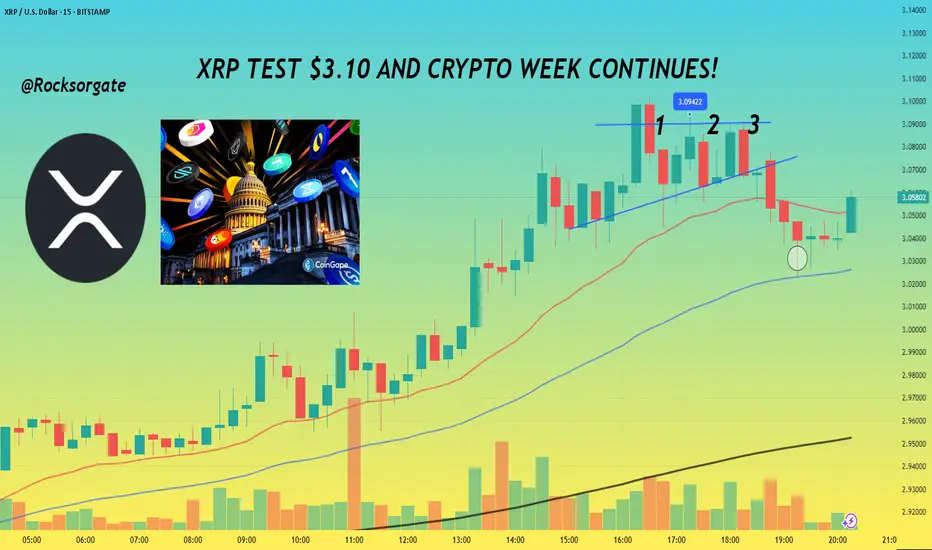
XRP TEST $3.10 AND CRYPTO WEEK CONTINUES!📊 Hey hey, hope all is well, gonna keep this idea pretty short and concise for the day, have a lot to do but thanks for joining as always.
📊 With Crypto week ongoing and the House of Representatives considering the Guiding and Establishing National Innovation for U.S Stable coins or GENIUS for short. Alongside that there's the Digital Asset Market Clarity Act or Clarity for short which is being considered as well. The last bill being considered is one which would be directed towards blocking the Federal Reserve from issuing a central bank digital currency directly to individuals.
📊 For summary CBDC is fiat money, just in digital form and that fiat money is issued and regulated by a central bank of a country.
📊 GENIUS has already made the rounds and passed through senate but is facing a snag, in limbo as House lawmakers as some lawmakers like Marjorie Taylor Greene and Chip Roy who themselves we're looking to get anti-CBDC language in with 12 republicans voting no on Tuesday's vote. Least to say things are still in flux, so we'll have to see if lawmakers can come to an agreement and sort things out simply put.
📊 If passed GENIUS would require stable coins to be fully backed by U.S dollars or similar liquid assets. Along with this you'd have annual audits for issuers with a market cap of more than $50 billion and guidelines would be established for foreign issuance.
📊 the Clarity Act takes a full on approach to crypto and would create a clear regulatory framework for crypto, this would function through the U.S Securities and Exchange Comission and Commodity Futures Trading Commission will regulate the crypto space. Digital asset firms would also have to provide retail financial disclosures and separate corporate from customer funds. More than likely in a nod to the collapse that FTX brought about for money when the company took advantage and started using customer funds.
📊 Overall these bills and acts alongside the CBDC bill would be a significant change for the digital asset space and give much more clarity for Institutions further allowing more money to enter the space basically.
Reference:
www.coindesk.com
www.theblock.co
📊 XRP itself will be impact by these changes just like the rest of the space with some digital assets making significant jumps or declines based on what bills and changes are ultimately decided so it's a crazy week to say in the least. For Technical I've added a chart below for reference:
📊 Can see how we're facing that horizontal level of resistance at $3.10 now, gonna set an alert for that but more than anything, right now what's gonna make or break things will be the news, we've already seen how much that's done us the last few weeks, grateful and blessed for it as always.
📊 Main thing now is to keep an eye on the news and watch that $3.10 level for resistance or a further breakout. We've also converged with our 200 EMA on the 3 minute chart so no doubt we'll see bulls and bears fight to break or keep that point. Should be an interesting next few days.
📊 Have to go study but as always, grateful for the continued support and those that take the time to read through these and continue with me on this journey, it's taken a few years but things are coming together finally, grateful we've perservered.
Best regards,
~ Rock '
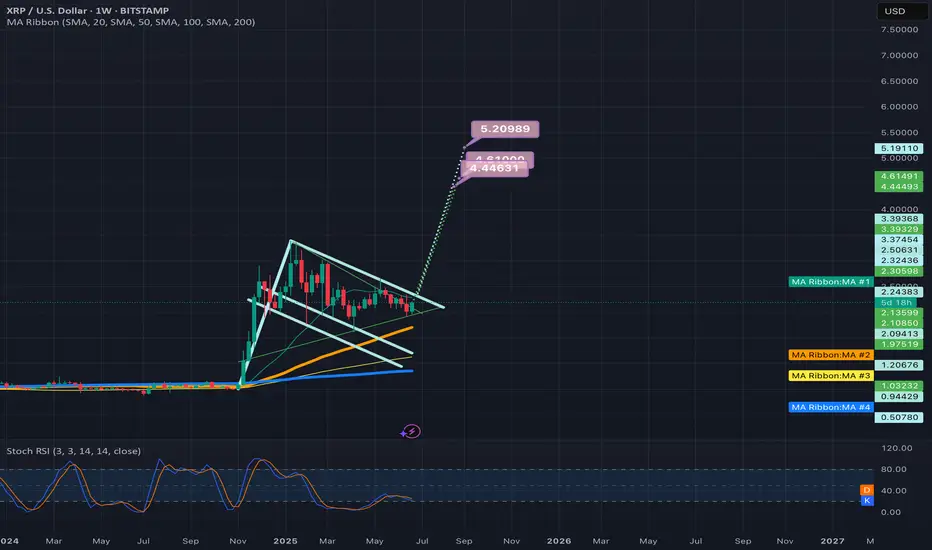
Weekly/monthly bullflag on xrpusdAn even higher target than the symmetrical triangles two potential targets materializes when we confirm the breakout up from this bull flag. It will likely have a bullish target somewhere around $5.20. Upon reaching this target it will also be breaking above a big cup and handle that will then have an even higher breakout target which I will post in my next idea *not financial advice*
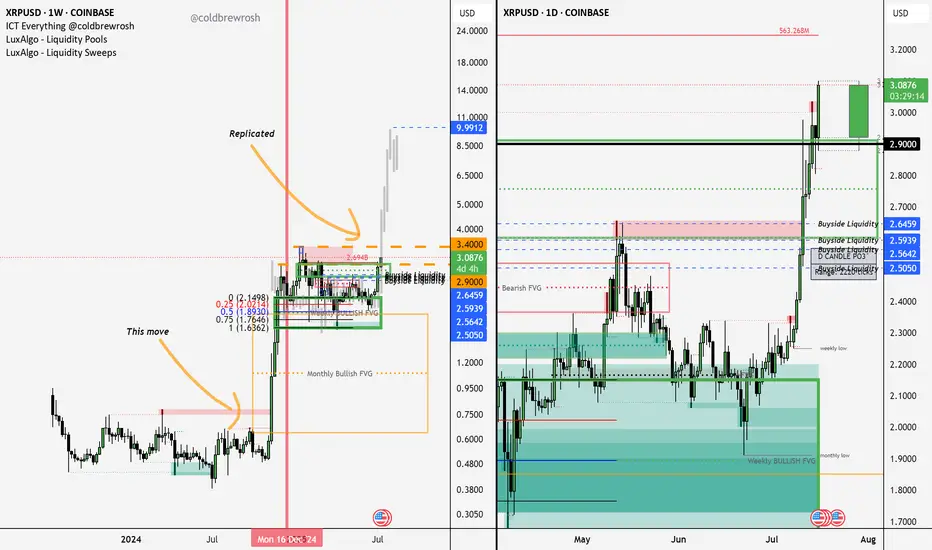
XRP Price Action – Market Structure BreakdownThis chart illustrates a replication of XRP’s previous bullish move, with key price action and structure aligning closely with historical behavior. Here's the breakdown:
Accumulation Phase:
XRP consolidated between the $1.90–$2.20 range. This zone acted as a monthly bullish fair value gap (FVG), serving as a springboard for accumulation before the breakout.
Massive Breakout:
A large impulsive move occurred just before July 14, 2025, coinciding with the anticipated go-live of ISO 20022 standards, which many believe could support utility tokens like XRP.
Market Replication:
The breakout structure is mirroring a previous bullish cycle, highlighted by the labeled replication arrows on the left side of the chart. This pattern confirmation supports the projection of a move toward $9.99–$10, aligning with a key liquidity target and psychological round number.
Targets and Gaps:
Price is shown aggressively pushing through bearish FVGs and reaching above previous highs, suggesting that liquidity above $10 could be the next target. The $9.99 level is marked as a clear draw on liquidity.
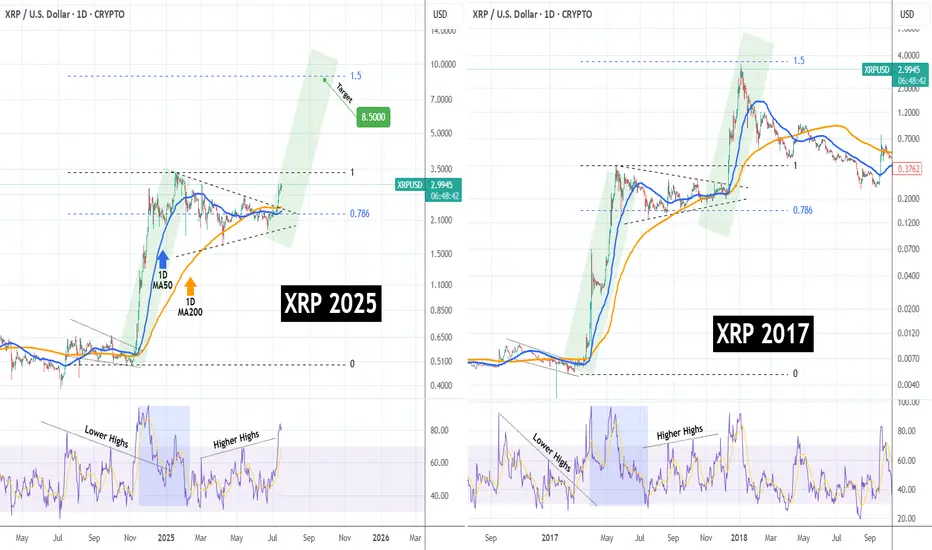
XRPUSD Has it started the mega rally to $8.500??XRP (XRPUSD) has been trading within a Triangle pattern for the past 6 months (January - July 2025) and only recently, it broke to the upside. Ahead of a pending 1D Golden Cross, this pattern is no different than the one of the previous Cycle from May - December 2017.
That setup resulted into the final Parabolic Rally of the Cycle that peaked just below the 1.5 Fibonacci extension. As you can see, both fractals are identical even from their starts, both initiated after a Falling Wedge that produced the first Parabolic Rally (green), which transitioned into the Triangle we described. Even their 1D RSI sequences are similar.
As a result, it is more than probable to see XRP hit $8.500 (Fib 1.5 ext), by the end of the year.
-------------------------------------------------------------------------------
** Please LIKE 👍, FOLLOW ✅, SHARE 🙌 and COMMENT ✍ if you enjoy this idea! Also share your ideas and charts in the comments section below! This is best way to keep it relevant, support us, keep the content here free and allow the idea to reach as many people as possible. **
-------------------------------------------------------------------------------
💸💸💸💸💸💸
👇 👇 👇 👇 👇 👇
Birthday Month&All I Want Is for XRP Retest Those Previous HighRight now, XRP is sitting at $2.99. But once it reclaims and surpasses that $3.84 level, we’ll officially be in uncharted territory. Some people say XRP is going to $100... others say $525... and there are even calls for $10K.
All I know is this: once XRP prints a true higher high, the chart’s going parabolic. And I truly believe a lot of the Bitcoin maxis who clowned on XRP are going to be eating their words.
We’ve waited, we've studied, and we've held through the chaos.
So on my birthday, I’m not asking for much — just a retest of that all-time high, and a chance to ride the wave that’s been building for years.
📈 Let’s make history.


XRP Cools Near $3.00 Amid Overbought SignalsFenzoFx—XRP remains bullish after piercing $3.00 earlier this week but cooled near resistance. Trading around $2.90, Stochastic (~84) and RSI 14 (80) indicate overbought conditions, suggesting consolidation.
We anticipate a pullback toward $2.66 support before resuming the uptrend. Alternatively, a decisive break above $3.00 would target $3.21 next.

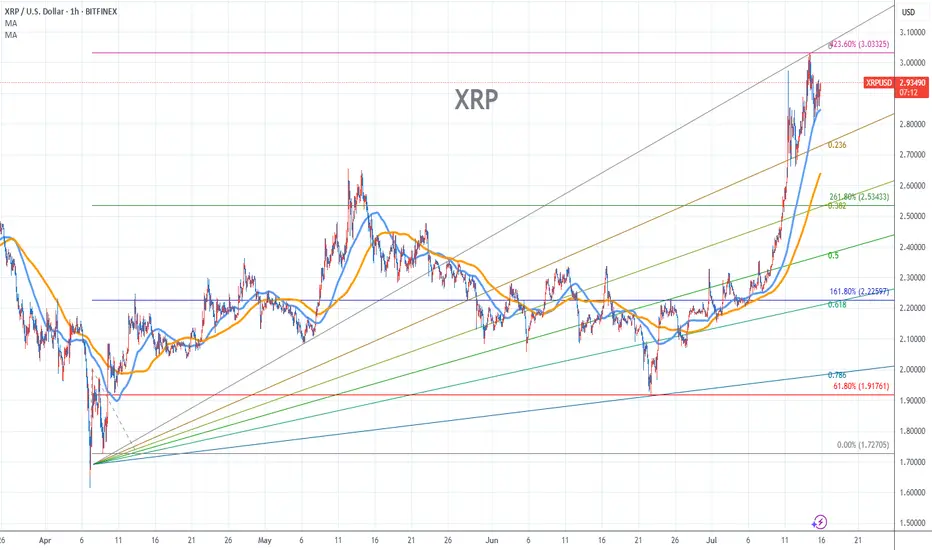
XRP Stock Chart Fibonacci Analysis 071525Trading idea - Hit the top - 3.03/423.60%
Chart time frame:B
A) 15 min(1W-3M)
B) 1 hr(3M-6M)
C) 4 hr(6M-1year)
D) 1 day(1-3years)
Stock progress:E
A) Keep rising over 61.80% resistance
B) 61.80% resistance
C) 61.80% support
D) Hit the bottom
E) Hit the top
Stocks rise as they rise from support and fall from resistance. Our goal is to find a low support point and enter. It can be referred to as buying at the pullback point. The pullback point can be found with a Fibonacci extension of 61.80%. This is a step to find entry level. 1) Find a triangle (Fibonacci Speed Fan Line) that connects the high (resistance) and low (support) points of the stock in progress, where it is continuously expressed as a Slingshot, 2) and create a Fibonacci extension level for the first rising wave from the start point of slingshot pattern.
When the current price goes over 61.80% level , that can be a good entry point, especially if the SMA 100 and 200 curves are gathered together at 61.80%, it is a very good entry point.
As a great help, tradingview provides these Fibonacci speed fan lines and extension levels with ease. So if you use the Fibonacci fan line, the extension level, and the SMA 100/200 curve well, you can find an entry point for the stock market. At least you have to enter at this low point to avoid trading failure, and if you are skilled at entering this low point, with fibonacci6180 technique, your reading skill to chart will be greatly improved.
If you want to do day trading, please set the time frame to 5 minutes or 15 minutes, and you will see many of the low point of rising stocks.
If want to prefer long term range trading, you can set the time frame to 1 hr or 1 day.
Why XRP Holders Are About to Get Super Rich!I believe XRP is heading into a mass adoption cycle—something even bigger than what Bitcoin saw in 2021. We’re looking at a truly sustainable growth pattern fueled by a longer accumulation phase and crypto being adopted and invested in by major institutions.
This means we could see XRP skyrocket to $22 as my lowest target— and potentially even well over $100 per coin . This coin is truly ready for massive things. Be prepared!
Let me know what you think: Will XRP crash? Or is it heading for mass adoption? Share your thoughts in the comments below.
As always, stay profitable,
– Dalin Anderson
XRPUSD – Broke Out, Not BrokenXRP surged to just above $3, forming a local top. The breakout we tracked above $2.80 played out nicely. Since then, it’s stair-stepped down, but each dip got bought — structure still bullish. Currently stabilizing above $2.88. Clear new upside trigger is $2.97–$3.00 retest zone.

$XRP All Tie High After Shallow Pullback?CRYPTOCAP:XRP had a fantastic week smashing all resistances. I am looking for a shallow pull back to test the High Volume Node support at $2.7 at the .236 Fibonacci retracement before continuing to challenge the all time high.
Wave (3) of a motif wave appears complete adding confluence to a shallow retracement for wave (4).
Daily RSI is extremely overbought.
Safe trading

XRP Price Corrects After Strong Rally: Support Levels in Focus
In the lead-up to the ETF announcement, XRP experienced a powerful rally, surging to fresh highs and demonstrating significant bullish momentum. The token climbed to the $2.85 zone, marking a substantial gain and outperforming many of its peers in the top tier of cryptocurrencies. This impressive run was fueled by a combination of factors, including the broader market upswing led by Bitcoin, growing optimism around Ripple's legal clarity, and the increasing institutional interest that the ETF launch now epitomizes.
However, following this strong upward move, a period of price correction was both expected and healthy. Profit-taking from short-term traders and the natural ebb and flow of the market have led to a slight pullback, bringing key support levels into the spotlight. Currently, XRP is trading above the crucial $2.80 mark and the 100-hourly Simple Moving Average, indicating that the underlying bullish sentiment remains intact.
A key technical feature that has emerged on the hourly chart of the XRP/USD pair is a bullish trend line with strong support forming at the $2.820 level. This trend line is acting as a critical floor for the price, and as long as XRP continues to trade above it, the potential for another upward leg remains high. The ability of the price to hold above this level suggests that buyers are actively stepping in to defend it, absorbing selling pressure and laying the groundwork for the next move higher.
Should the price dip below this immediate support, the next significant level to watch is the $2.750 zone. A successful defense of this area would further solidify the bullish case, demonstrating the resilience of the current uptrend. A break below this level, however, could signal a deeper correction and a potential shift in short-term market sentiment. For now, the price action suggests that the path of least resistance is to the upside, provided these key support levels hold firm.
The recent price correction, therefore, should not be viewed as a sign of weakness, but rather as a necessary consolidation phase before the next major rally. It has allowed the market to shake out over-leveraged positions and build a more solid foundation for future growth. The focus for traders in the immediate term will be on the interplay between the established support levels and the renewed buying pressure that is expected to accompany the ProShares XRP ETF launch.
A ‘Highly Rare’ Setup Eyes a 60% Gain Past $3
Adding to the bullish narrative surrounding XRP is a compelling technical analysis from a veteran trader who has identified a "highly rare continuation compound fulcrum" setup on the weekly price chart. This complex and infrequently observed pattern suggests that XRP is in the process of forming a major price breakout. The resolution of this setup, according to the analyst, could see the token's value surge by approximately 60%, pushing it past the psychological $3 barrier and towards a target of $4.47 in the coming months.
The "compound fulcrum" is a sophisticated chart pattern characterized by a complex base formation. It often consists of multiple smaller patterns, such as failed breakdowns, minor ranges, and wedges, that develop over an extended period. This intricate dance of price action serves to confuse the market, shaking out weaker hands while allowing more determined, long-term investors to accumulate their positions. Once this accumulation phase is complete and the balance of power shifts decisively in favor of the bulls, the price is expected to break out with significant force in the direction of the prevailing uptrend.
This bullish outlook is further substantiated by XRP's recent market performance. The token has posted its strongest weekly gain since last November, a clear indication of the growing momentum behind it. This rally has been accompanied by a significant increase in the number of "whale" wallets – those holding at least 1 million XRP. The accumulation of XRP by these large holders has reached a record high, signaling a profound and growing confidence among institutional and high-net-worth investors. This is a powerful leading indicator, as these market participants often have a longer-term perspective and their actions can foreshadow major price movements.
A break below the support line near $1.80 would invalidate this particular bullish setup. However, given the current market dynamics and the positive catalysts on the horizon, the probability of such a breakdown appears to be diminishing. The confluence of a rare and powerful technical pattern with strong fundamental developments creates a potent recipe for a significant price appreciation.
On-Chain Sentiment Transitions to "Belief-Denial"
Beyond the technical charts and institutional news, on-chain data provides another layer of insight into the current state of the XRP market, and the picture it paints is overwhelmingly positive. On-chain sentiment analysis shows that XRP is transitioning from the "optimism-anxiety" phase into the "belief-denial" phase. This shift is a crucial indicator of market psychology and often precedes a period of sustained price growth.
The "belief-denial" phase is characterized by a growing conviction among investors that the asset's value will continue to rise, despite any short-term corrections or pullbacks. It is a phase where the market begins to price in the long-term potential of the asset, moving beyond the initial excitement and into a more steadfast and resilient bullishness. This transition suggests that the current rally is not a fleeting speculative bubble, but rather a more sustainable and healthy uptrend.
Further supporting this view is the Net Unrealized Profit-Loss (NUPL) metric, which gauges the overall profitability of the market. In previous bull cycles, XRP's price corrections have often coincided with the NUPL entering the "euphoria-greed" zone, a sign of excessive speculation and an overheated market. However, the current data shows that the NUPL is indicating rising investor conviction without any signs of panic selling. This suggests that the current rally is built on a more solid foundation and has room to run before reaching a state of market euphoria.
The combination of increasing whale accumulation and the shift in on-chain sentiment points to a market that is maturing and gaining strength. The growing institutional confidence, as evidenced by the record number of whale wallets, is a testament to the long-term value proposition of XRP. As more large investors enter the market, they bring with them not only capital but also a sense of stability and a long-term investment horizon, which can help to dampen volatility and support a more sustainable price trajectory.
In conclusion, the upcoming launch of the ProShares XRP ETF on July 18 is set to be a watershed moment for Ripple and its native token. This event is not just a symbolic victory; it is a tangible catalyst that is expected to unlock significant institutional investment and propel XRP into a new era of mainstream adoption. The recent price correction, while causing some short-term uncertainty, has served to strengthen the underlying bullish structure, with key support levels at $2.820 and $2.750 holding firm.
The technical outlook is exceptionally bright, with a rare and powerful chart pattern suggesting a potential 60% rally to $4.47. This bullish forecast is strongly supported by the record accumulation of XRP by whale wallets and a clear shift in on-chain sentiment towards a more resilient "belief-denial" phase. As the worlds of traditional finance and digital assets continue to converge, XRP is positioning itself at the forefront of this revolution. The confluence of these powerful factors suggests that the stage is set for a significant and sustained upward movement in the price of XRP, making the coming weeks and months a period of intense interest and opportunity for the entire cryptocurrency market.

Double topA short term correction on this double top as the RSI is loosing momentum, providing a regular divergency. It could be sellers taking advantaged of high price, buyers taking profit or trapped buyers from previous highs getting out.
