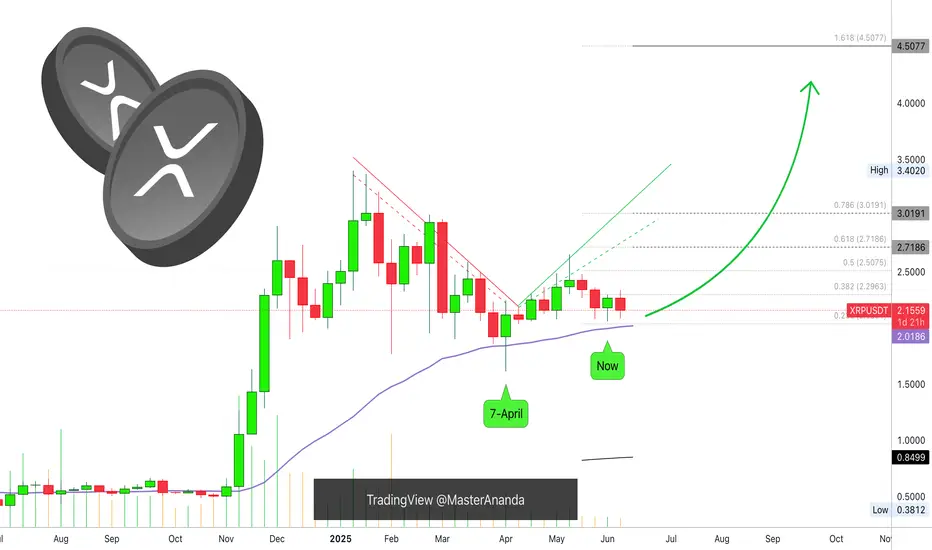
XRP Weekly UpdateThe line on the chart stands for EMA34. Notice two things about this level: 1) It was challenged 7-April but the action closed above. 2) The action "now" remains above this level but it has not been tested again, this is a bullish signal.
When it comes to the weekly timeframe, long-term, XRPUSDT continues bullish, with a bullish bias aiming higher. What we are seeing now is consolidation, accumulation, nothing changes and we can expect more growth.
Yes, the market shakes a little bit but this is the classic short-term noise. Zoom out, what do you see? You see just a few candles, red and green, but no change at all. The market is advancing to the side, after this side-advance, it will advance up; a bullish jump.
EMA34 sits at $2.01. We are strongly bullish above this level. We can expect growth in matter of weeks. Can be 1-3 weeks but it can also happen within days.
The retrace was small, consolidation has been going long enough. We are ready to start the next bullish wave.
Namaste.
XRPUSDT.3L trade ideas
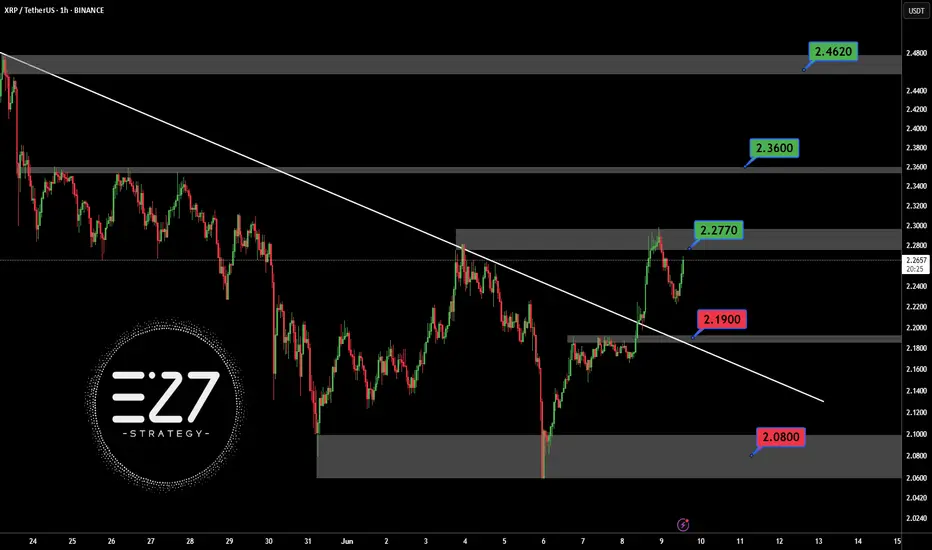
XRPUSDT BINANCE:XRPUSDT Price broke above the downtrend line but faced resistance at 2.2770 dollars and started correcting. Key supports are at 2.1900 and 2.0800 dollars. If it bounces, resistances to watch are 2.2770, 2.3600, and 2.4620 dollars. Price is currently between key levels.
Key Levels:
Support: 2.1900 – 2.0800
Resistance: 2.2770 – 2.3600 – 2.4620
⚠️Contorl Risk management for trades.
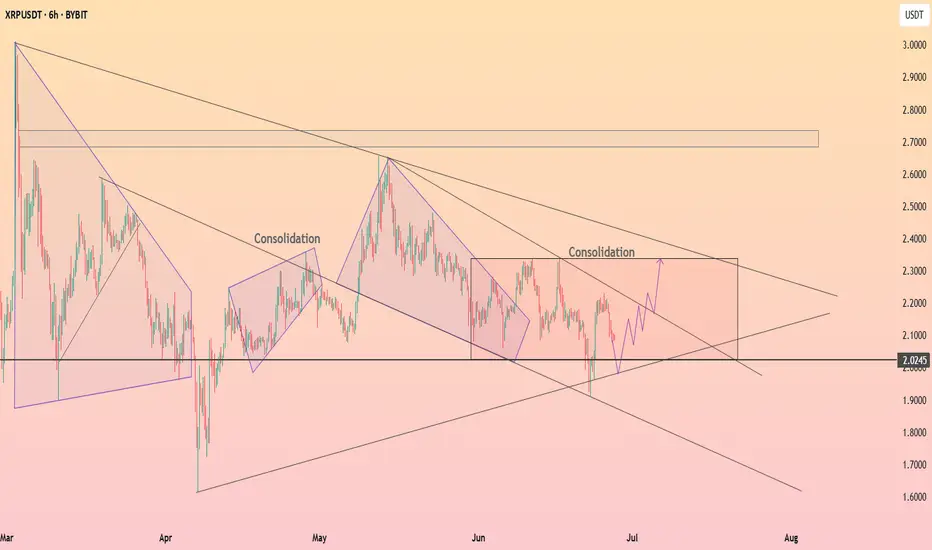
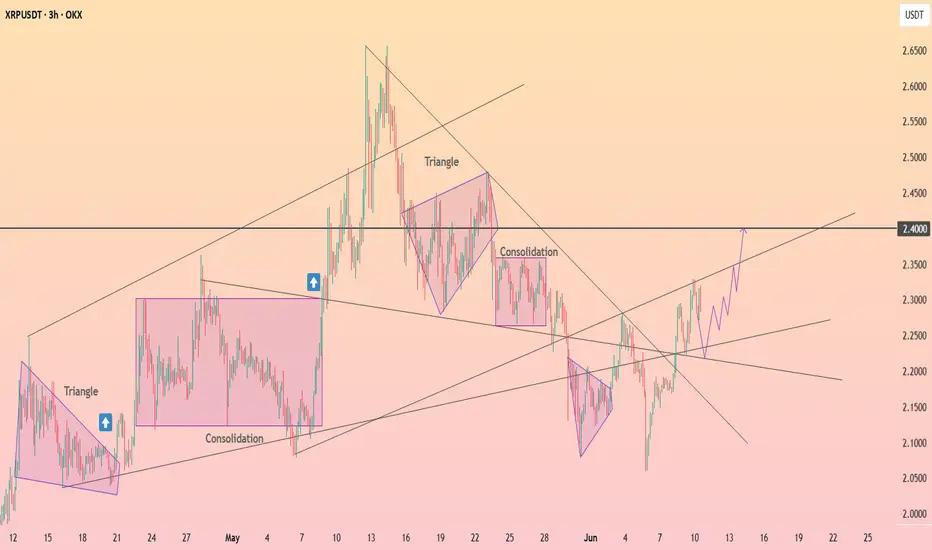
HolderStat┆XRPUSD consolidation of the assetBINANCE:XRPUSDT has bounced from the 2.02 level and is approaching the upper edge of a large consolidation structure. Multiple prior consolidation zones have led to breakouts, and the current bounce hints at continuation toward 2.30. A clean close above resistance would confirm bullish intent.
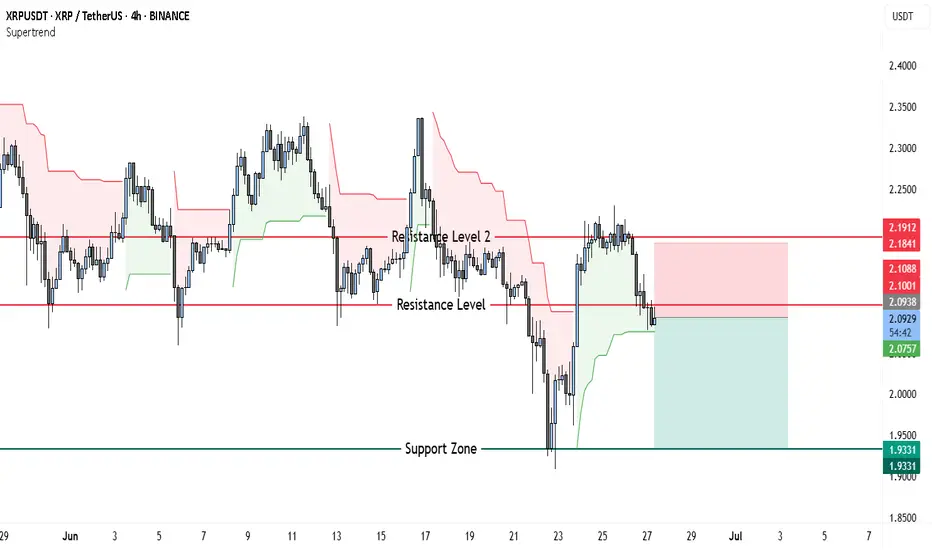
XRP Bears Ready to Feast? Short Setup Targets $1.93 With 1.6:1RROn the XRPUSDT 4-hour chart, price action shows a clear rejection of higher levels and a transition to a bearish tone. After rallying up toward the 2.19–2.18 USDT resistance zone, XRP failed to sustain momentum and rolled over sharply. The Supertrend indicator flipped to red, signaling renewed selling pressure.
Currently, the market is retesting the 2.09–2.10 USDT zone, which previously acted as strong support but is now functioning as resistance. This is a classic bearish retest structure, often confirming further downside if price fails to reclaim the level decisively. Beneath the current price, the most significant support area rests near 1.93 USDT, where buyers previously defended with strong volume.
This backdrop supports a short-biased trade setup. The ideal entry would be around 2.09–2.10 USDT, where the market is testing the broken support as resistance. The stop loss should be positioned just above the prior swing high and the top of Resistance Level 2, at 2.19 USDT. If the rejection holds, the take profit target aligns with the clear structural support around 1.93 USDT. This setup offers a risk of roughly 0.10 per XRP and a potential reward of about 0.16, maintaining a sound risk-reward profile near 1.6:1.
While a bullish reversal is possible if XRP can reclaim 2.19 USDT on a strong daily close, current price action and trend signals favor sellers in the near term.
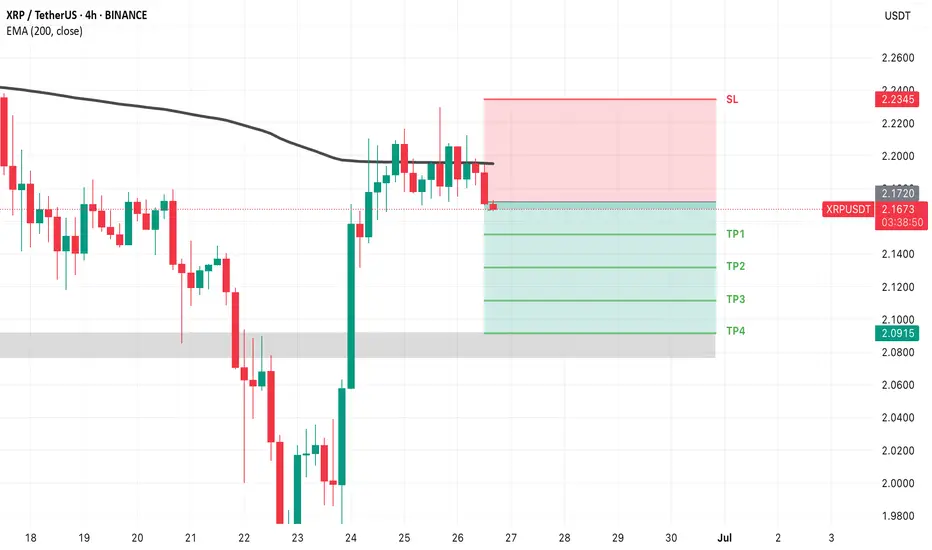
XRP SHORT TRADE SETUPXRP/USDT is currently holding at a strong resistance zone, with a high probability of an downward price move. Also 200 EMA acting as a strong resistance .
XRP ANALYSIS🔮 #XRP Analysis - Update 🚀🚀
💲 As we said earlier #XRP performed the same. Resistance1 achieved easily. Now we can see that there is a formation of Falling Wedge Wedge Pattern in #XRP and we can see a more retest before a bullish movement again.
💸Current Price -- $2.1729
📈Target Price -- $2.5964
⁉️ What to do?
- We have marked crucial levels in the chart . We can trade according to the chart and make some profits. 🚀💸
#XRP #Cryptocurrency #Breakout #DYOR

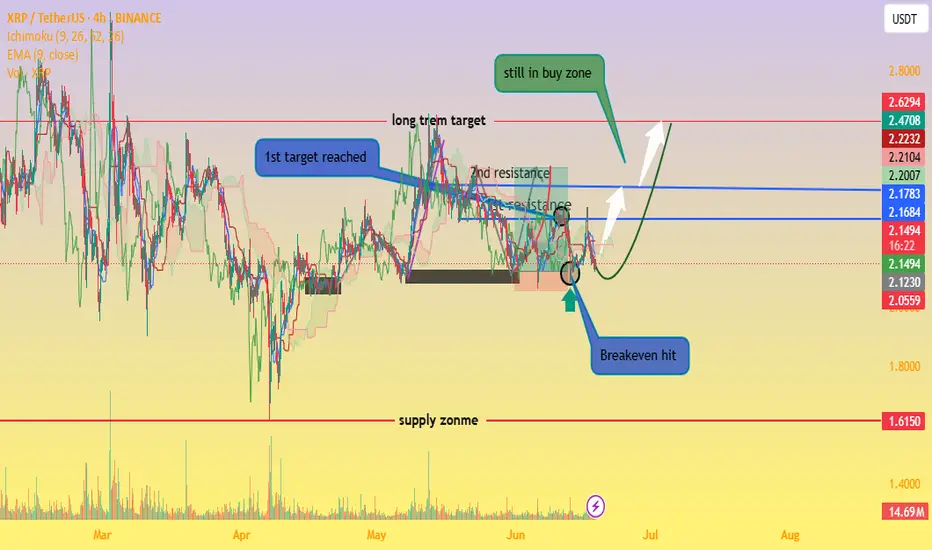
XRP Still in Buy Zone – Eyes on $2.50+our chart clearly marks that XRP has bounced off a strong buy zone (around the $2.10–$2.15 range), aligning well with a classic setup: price hitting support, creating a small base, and starting an upward rotation. 👇
Support area respected – The highlighted circle shows XRP revisiting the demand zone and quickly rebounding, very bullish behavior.
Lower wicks & volume spike – Indicate absorption of selling pressure and possible institutional interest.
Green arrow projection – Suggests a break above the immediate resistance (~$2.17 EMA/Ichimoku levels) could trigger a rally toward the next resistances around $2.22, $2.47, and potentially $2.63.
“Still in buy zone” annotation – Absolutely valid: as long as XRP stays above that key base ($≈$2.10), the bullish case holds.
🔍 Market Context
Range consolidation between ~$2.10–$2.30 has been the dominant theme, awaiting a breakout catalyst (e.g., ETF approvals or legal clarity)
thecryptobasic.com
+14
fxempire.com
+14
crypto.news
+14
.
Analysts highlight a falling wedge and support zone between $2.00–$2.20—if price holds, a move toward $3–$4 is plausible .
A range-bound weekly outlook anticipates a push toward $2.50 resistance before exploring higher targets .
✔️ Summary
Buy zone holding: Bullish pattern confirmed with rebound from support.
Key resistance levels: Watch for a breakout above $2.17/EMA and then $2.22–$2.30/$2.50.
Ideal strategy: Maintain position above support; add on breakout, targeting $2.50–$3.00.
Risk points: A drop below $2.10 could test $2.00 or even $1.85 support.
#XRP/USDT#XRP
The price is moving within a descending channel on the 1-hour frame, adhering well to it, and is heading towards a strong breakout and retest.
We are experiencing a rebound from the lower boundary of the descending channel, which is support at 2.11.
We are experiencing a downtrend on the RSI indicator that is about to be broken and retested, supporting the upward trend.
We are looking for stability above the 100 Moving Average.
Entry price: 2.16
First target: 2.20
Second target: 2.24
Third target: 2.28

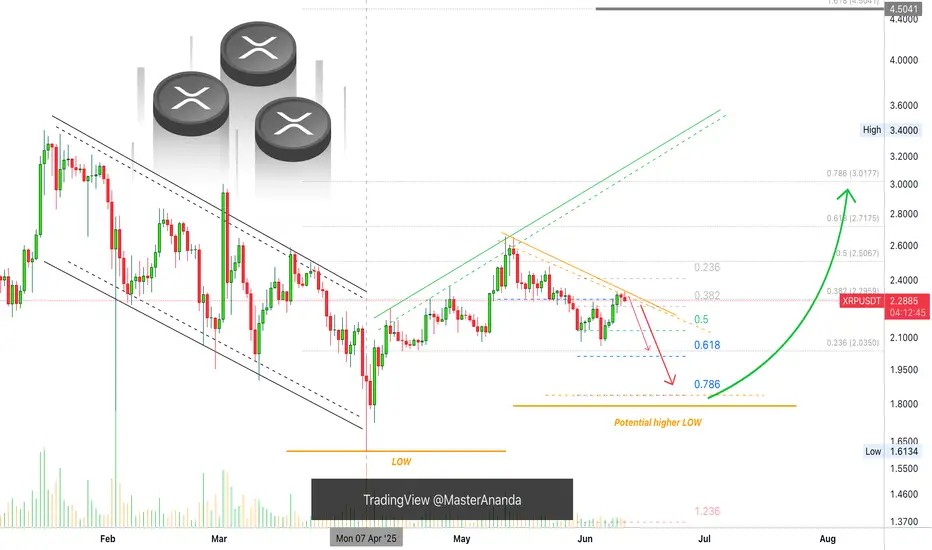
DeGRAM | XRPUSD out of the triangle📊 Technical Analysis
● XRP has retested the long-term purple trend-line it broke in May and bounced at the $2.05–2.15 support, locking in a higher-low on the new rising base.
● Price is coiling inside an ascending triangle capped by $2.44; the pattern’s 1 : 1 swing and the channel roof intersect at $2.81. RSI stays above 50, showing buyers still control momentum.
💡 Fundamental Analysis
● In the remedies brief the SEC trimmed its disgorgement request, and the judge set a July settlement check-in, reducing tail-risk.
● Santiment notes whale wallets (>10 M XRP) accumulated ~60 M XRP since 14 Jun, hinting at renewed institutional demand.
✨ Summary
Buy $2.10–2.20; sustained break above $2.44 targets $2.60 then $2.81. Invalidate on a 16 h close below $1.98.
-------------------
Share your opinion in the comments and support the idea with a like. Thanks for your support!

XRP - Straight HorseSight!XRP Vision is quiet clear - The two areas are areas of hold and from this side straight up move can be seen, though slow death move can be seen on the line marked, but its mostly due to liquidity sweeps!

HolderStat┆XRPUSD narrowing of volatilityCRYPTOCAP:XRP
→ Higher-low ladder pushes into falling-wedge roof
↳ Daily close > 2.40–2.45 = breakout to 2.55–2.65
⇢ Rising base holds at 2.10
⤴ Break < 2.10 opens 2.00–1.95 liquidity pit
XRP/USDT Reversal Play: Bounce from Strong Demand Zone🔍 Chart Analysis:
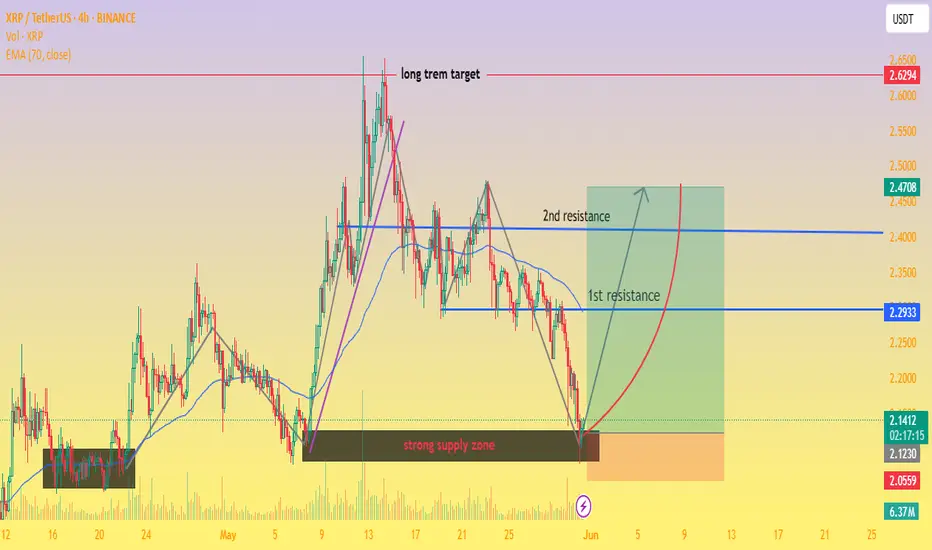
🟫 Strong Supply Zone: The price has bounced perfectly off a strong demand zone (labeled "strong supply zone" in the chart, but likely intended to be demand), showing buyer interest near the $2.05–$2.12 range.
📉 Recent Downtrend: XRP recently experienced a sharp decline, but the price has now touched this critical zone, suggesting a potential bullish reversal.
🔁 Potential U-Shaped Recovery: A rounded reversal pattern is indicated with the red curve, aiming for a U-shaped recovery targeting higher resistance levels.
📊 EMA 70 (2.2932): Current price is trading below the EMA, which acts as a short-term resistance. A break above it would be bullish confirmation.
📌 1st Resistance: Around $2.2932, which aligns with the EMA. This is the first challenge for bulls.
📌 2nd Resistance: Near $2.40–$2.47, a critical barrier before long-term targets.
🎯 Long-Term Target: Set near $2.63, the peak from the previous rally, aligning with major resistance.
🕯 Volume: Decent volume spike at the bounce, confirming interest from buyers.
🧠 Trade Setup: Reversal from Strong Demand Zone
📍 Entry Zone:
🔹 Enter between $2.12 – $2.15 (ideal after confirming a bounce or bullish candle above the zone)
🛡️ Stop-Loss (SL):
🔻 Place below the demand zone — $2.05
(Protects from deeper downside if support breaks)
🎯 Take Profit (TP) Targets:
TP1 – $2.29 (🟦 1st Resistance / EMA 70)
🔸 Partial profit booking here; break-even SL for the rest
TP2 – $2.40 (🟦 2nd Resistance)
🔸 Major resistance zone; expect a reaction
TP3 – $2.63 (🔴 Long-term Target / Previous High)
🔸 Full target for position holders
📊 Risk/Reward Ratio:
Approximately 1:2.5 to 1:3.5, depending on entry
🔔 Extra Notes:
📈 Watch for bullish engulfing or hammer candle confirmation before entering.
🔄 If price fails to reclaim EMA 70, re-evaluate trade.
🧠 Manage position size properly — avoid over-leverage.
🔮 Summary:
XRP is attempting a bullish reversal from a key demand zone with potential to target $2.47 and even $2.63 long term, provided it clears resistance at $2.29 and $2.40. The setup favors swing traders and position holders looking for a recovery play.
💡 Strategy Tagline:
"Buy the bounce, trail the breakout, ride the reversal!" 🚀📈💹
support my idea and comment down your thoughts thanks .
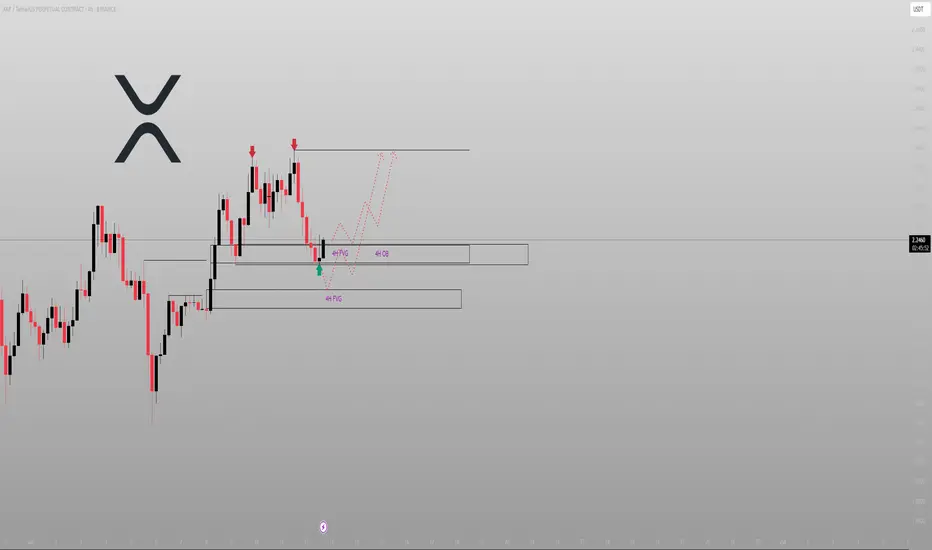
Three taps. One trap. I entered on the fourth.This was engineered. Price printed a clean triple top — classic liquidity bait. Retail saw resistance. I saw intention.
Setup logic:
We had multiple 4H FVGs and a refined Order Block sitting directly under that equal high setup. Price didn’t just fall — it delivered into confluence. That’s the difference between volatility and purpose.
The entry came right off the lower FVG sweep — rejecting from the midpoint of the OB with precision. No randomness. No confusion. Just Smart Money stacking positions while the crowd waited for a ‘breakout.’
Here’s how I see it:
Current PA is hovering inside the 4H OB, with the reaction candle holding
First sign of strength: reclaim 2.26–2.28
Above that, price will hunt the triple top zone — clean liquidity sitting near 2.35
Expectation:
Entry: ~2.24–2.25
SL: Below the 4H FVG (2.20 invalidation)
TP1: Liquidity sweep of 2.35
TP2: Breakout expansion toward 2.42+
If we lose the lower FVG? I wait again — but not from emotion, from structure.
Final thought:
“Liquidity doesn’t resist price — it attracts it. Learn the difference.”
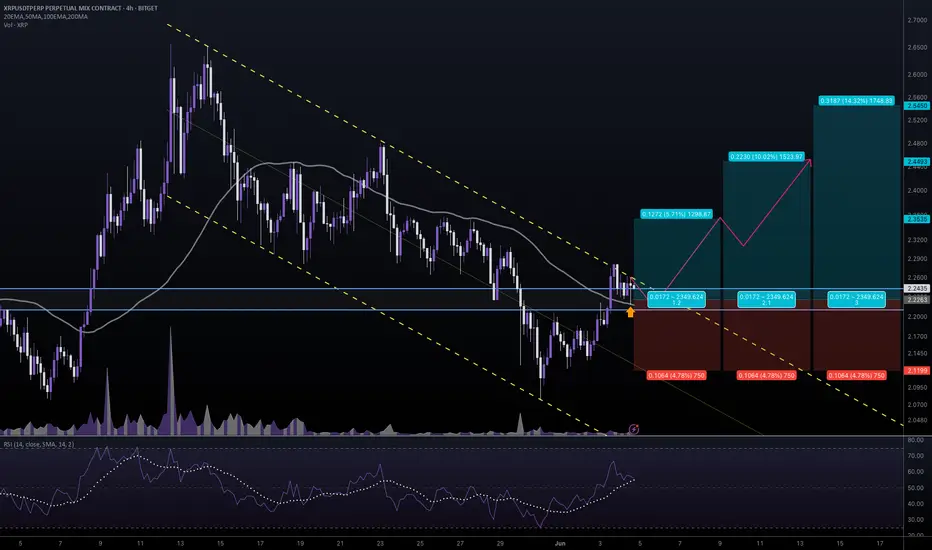
#XRPUSDT #4h (Bitget Futures) Descending channel near breakoutRipple just printed a dragonfly doji resting 50MA regained support, looks ready for short-term recovery.
⚡️⚡️ #XRP/USDT ⚡️⚡️
Exchanges: Bitget Futures
Signal Type: Regular (Long)
Leverage: Isolated (8.0X)
Amount: 5.2%
Entry Zone:
2.2438 - 2.2088
Take-Profit Targets:
1) 2.3535
2) 2.4493
3) 2.5450
Stop Targets:
1) 2.1199
Published By: @Zblaba
CRYPTOCAP:XRP BITGET:XRPUSDT.P #4h #Ripple #MadeInUsa xrpl.org
Risk/Reward= 1:1.2 | 1:2.1 | 1:3.0
Expected Profit= +45.7% | +80.1% | +114.5%
Possible Loss= -38.2%
Estimated Gaintime= 1-2 weeks
XRP Showing Some Weakness But...Here the bearish signals are not as pronounced as they are on Bitcoin or some other pairs which are basically trading near their all-time high, XRP is in a different situation. Still, a lower high is in place and trading volume is really low right now. This low volume always works as a continuation signal, which means it has no value. Whatever the chart is doing that is what is happening for real.
The main high happened 12-May and then a retrace. The lower high happened 9-June but then again today. Today's session wicked higher but it is already full red. Again, the signals are weak but we know the market is all the same. The big cap. projects move together, if Bitcoin goes down, Ethereum goes down, if Ethereum goes down, Cardano goes down, if Cardano goes down XRP is going down, etc. But we can also look at the charts individually.
On the other hand, smaller pairs can be growing strong and thriving, some will grow while others move down, why? Because we are in bull market zone. When the market is bearish, a bear market, Bitcoin goes down and everything follows. When the market is bullish, many can grow while some go down. This is what is happening today.
Wait patiently (SHORT), once support becomes established we can enter again.
We don't know if the market will produce a higher low short-term, vs 5-June or a lower low. But it is wise to secure your position because things can change in a flash. A higher low is possible which would mean a non-event, but, seeing the lower high and the low volume weakness, a market flush is likely to take place.
If we are set to experience new heights in late 2025, the correction must happen now, and with this statement the chart agrees. Down we go. It is still early though for this pair.
We will see how it goes.
Thank you for reading.
Namaste.
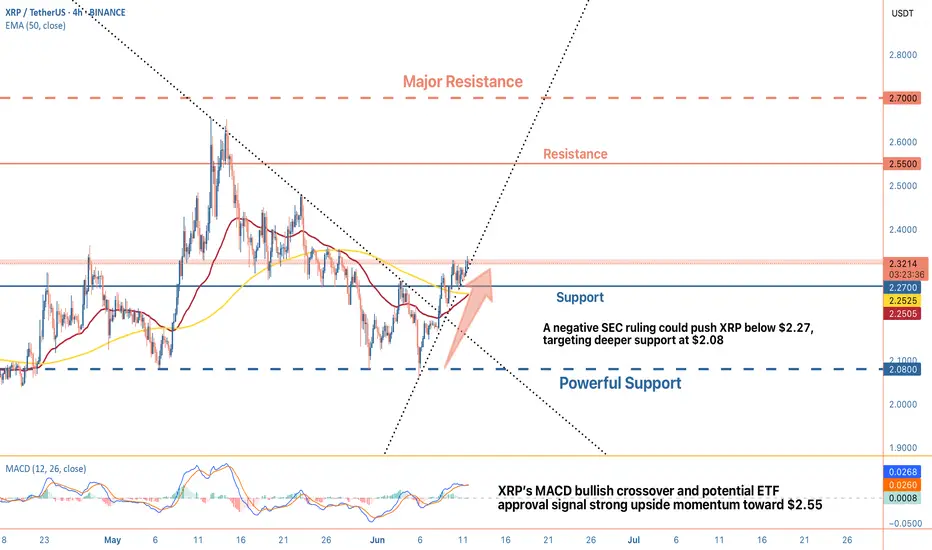
XRP's Consolidation with Bullish SignalsXRP has formed a higher low after rebounding from the $2.08 level. This hints at underlying bullish strength, but resistance looms near $2.55 and $2.70, levels that have capped previous rallies.
A breakout above $2.32 could signal renewed momentum, while a drop below $2.27 might test lower support.
The MACD has recently completed a bullish crossover, with the MACD line crossing above the signal line, indicating potential short-term upside. Additionally, the 50 EMA is nearing the 100 EMA, forming a mini-golden cross a pattern often associated with bullish continuation.
Market News:
Several developments are shaping XRP’s outlook. Ripple recently gained regulatory approval from Dubai, a move that could enhance XRP’s adoption and bolster investor confidence. Rumors of a spot XRP ETF, potentially launching in June 2025 with an SEC decision deadline on June 17, are also stirring excitement, approval could drive significant demand. However, the unresolved SEC lawsuit remains a dark cloud.
While Ripple has scored some legal wins, any adverse ruling could spark selling pressure. Regulatory headlines will likely play a pivotal role in XRP’s near-term trajectory.
XRP’s 4H chart presents a cautiously optimistic picture. Technicals lean bullish, with the MACD crossover and EMA alignment suggesting upside potential, especially if $2.32 resistance gives way. Positive catalysts like Dubai’s approval and ETF speculation could fuel gains, possibly targeting $2.55 or higher. That said, the SEC case introduces uncertainty—traders should brace for volatility if legal updates emerge. Key levels to watch: $2.32 for a breakout, $2.27 as near-term support, and $2.08 as a deeper floor.
HolderStat┆XRPUSD kept the support trend lineCRYPTOCAP:XRP has successfully consolidated above trendlines that have previously acted as resistance on multiple occasions, but the market could still retest 2.25. A break of 2.35 opens the way to 2.4.
Weekly trading plan for XRPAt the moment bearish divergence is visible on the 1h time frame, so it is possible to see a local correction before the next growth. But it is also possible to see a fast growth to the marked zones if the resistance zone is broken
Write a comment with your coins & hit the like button and I will make an analysis for you
The author's opinion may differ from yours,
Consider your risks.
Wish you successful trades ! mura

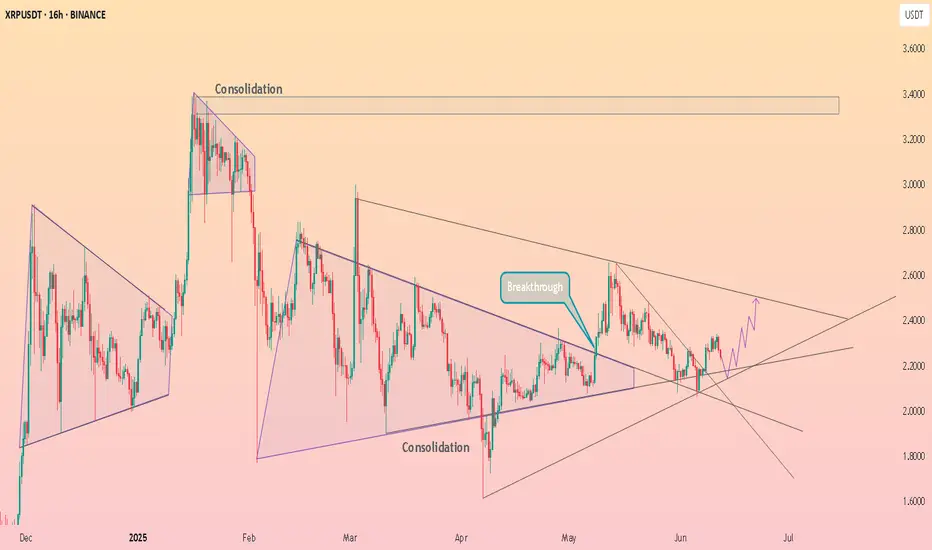
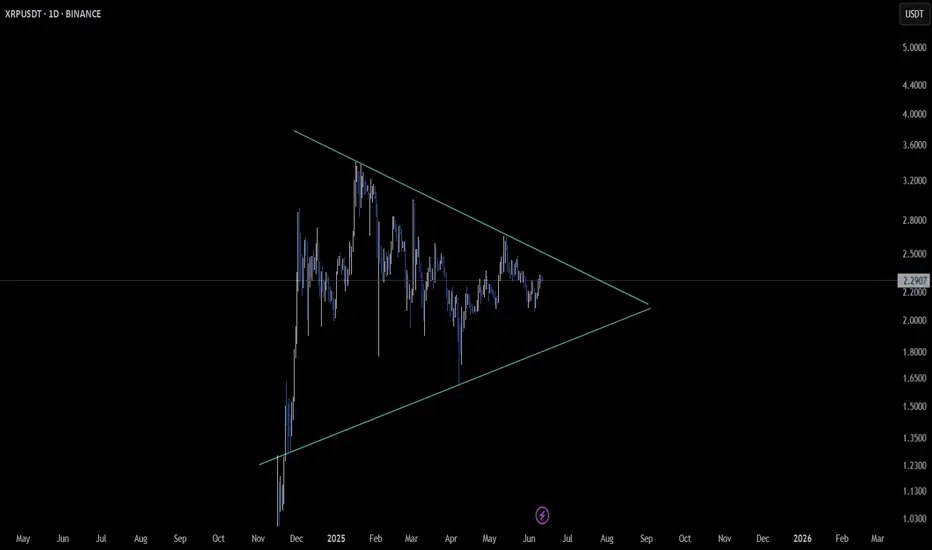
XRP Eyes Symmetrical Triangle – Big Move LoadingCRYPTOCAP:XRP is tightening within a symmetrical triangle on the daily timeframe 🔷, hinting at a major breakout or breakdown on the horizon 👀.
This coiling structure is often the calm before the storm – price is compressing and preparing for a decisive move.
Traders, watch this space closely: a clean breakout could unlock fresh momentum 🚀, while a breakdown may test lower levels again.
Stay patient and let the chart reveal its next chapter!
XRP? intraHi
I'm still bullish
Dont know what to do?
Let's do this.
Buy Stop 2.32
SL 2.28
Target 2.41
Money management. 1:2
All the best.
Not a guru

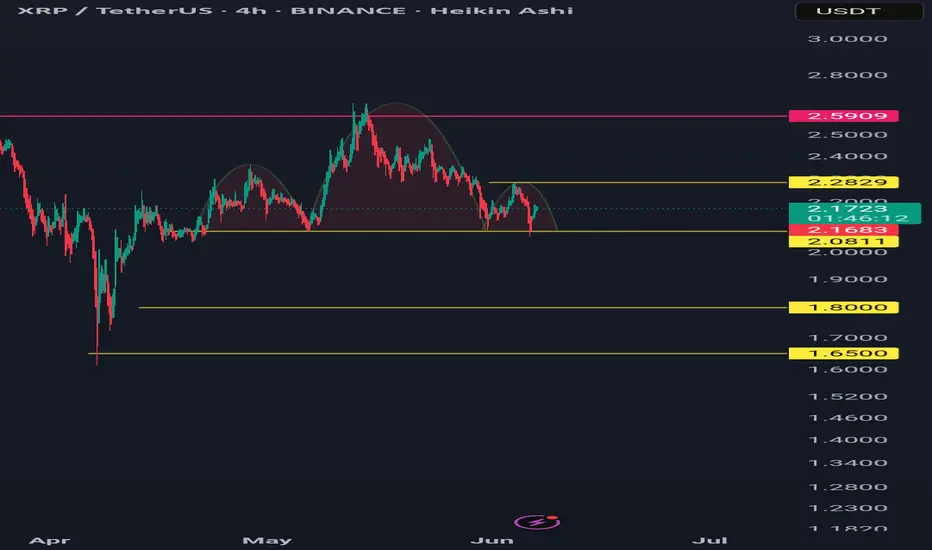
Xrpusdt 4hr bearishIf it closes below 2.0811 on the 4-hour timeframe, the bearish head and shoulders pattern may activate.
Targets are 1.8 and 1.65.
Invalidation occurs if it closes above 2.2829, assuming it didn't make a new high above that level before dropping down.
It is currently trading below the 100-day moving average.

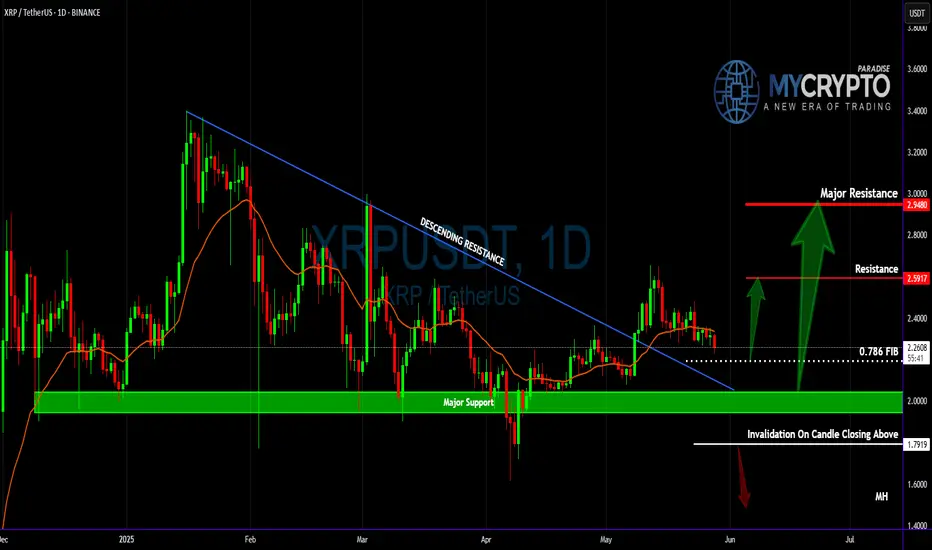
XRP Is Quiet—But This Calm Is Deceptive!Yello Paradisers—have you noticed how #XRP isn't on anyone’s radar right now? It’s not trending, no one’s hyping it, and to many, it’s just another slow mover. But here’s the thing: this type of silence often comes before the real storm, and the technical are quietly lining up.
💎#XRPUSDT is seeing now a period of consolidation The 1D bullish trend structure has been broken, and since then, price has entered into a tightening consolidation phase. While this may seem like indecision, it’s more likely a preparation for a potential high-probability upside expansion.
💎Price is now hovering just above the 0.786 Fibonacci level (~$2.25), which has started acting as a soft support. This is not a level to blindly trust, but one to monitor for reactions. If price manages to hold here, the next high-probability target lies at the short-term resistance around $2.5917, followed by major resistance at $2.9480, which aligns with a broader liquidity zone.
💎One key factor to keep in mind: the descending trendline liquidity has not been swept for a long time. That uncollected liquidity still sits just overhead, and markets usually don’t leave such inefficiencies behind forever. A spike toward that zone becomes increasingly probable the longer we range here.
💎At the same time, the MTF EMA on the daily chart is acting as a soft dynamic resistance, pushing the price down gradually. This setup increases the probability that we may see another touch of the 0.786 level. If that fails to hold decisively, the next likely area of interest will be the major support zone around $2.00.
💎Still, that major support remains unbroken and continues to act as a probability-backed structure for potential bullish defense. Until we get a clean daily candle close below $1.791 (invalidation level), this entire zone remains technically favorable for a potential reversal or liquidity sweep to the upside.
We are playing it safe right now, Paradisers. If you want to be consistently profitable, you need to be extremely patient and always wait only for the best, highest probability trading opportunities.
MyCryptoParadise
iFeel the success🌴