XRPUSDT.3L trade ideas

XRP: Bullish Breakout -> Short-Term Pullback Before Bigger GainsXRP: Bullish Breakout -> Short-Term Pullback Before Bigger Gains
Market Overview
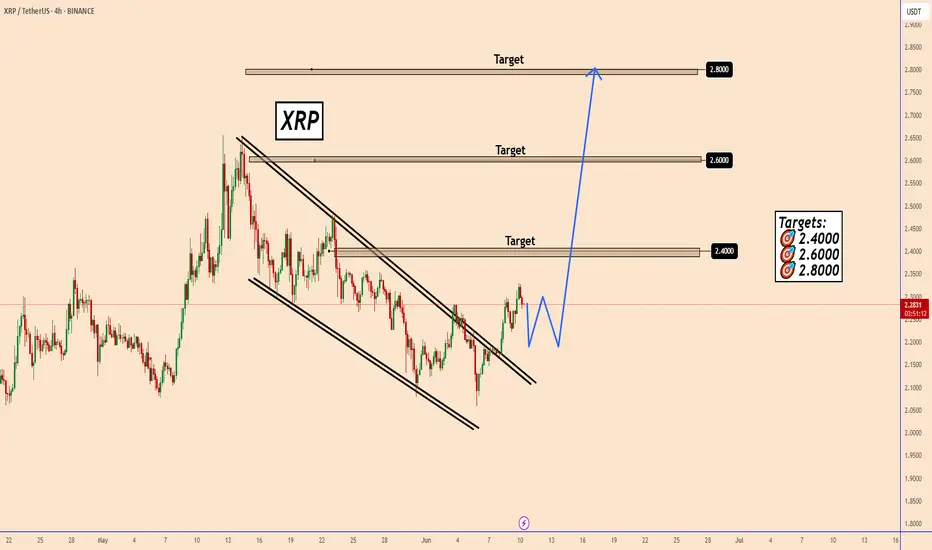
XRP has broken out from a larger bullish pattern, signaling the end of its accumulation phase. However, with the market’s attention currently on the U.S.–China trade deal and the Trump–Musk developments, short-term uncertainty could push XRP lower, possibly toward 2.1700.
Bigger Picture Outlook
Despite potential near-term volatility, XRP's broader bullish structure remains intact, indicating a strong upside potential in the coming days or weeks.
Targets:
🎯 2.4000 🎯 2.6000 🎯 2.8000
You may find more details in the chart!
Thank you and Good Luck!
❤️PS: Please support with a like or comment if you find this analysis useful for your trading day❤️
$XRP - Falling Wedge Breakout is CookingRipple is forming a simple yet perfect setup
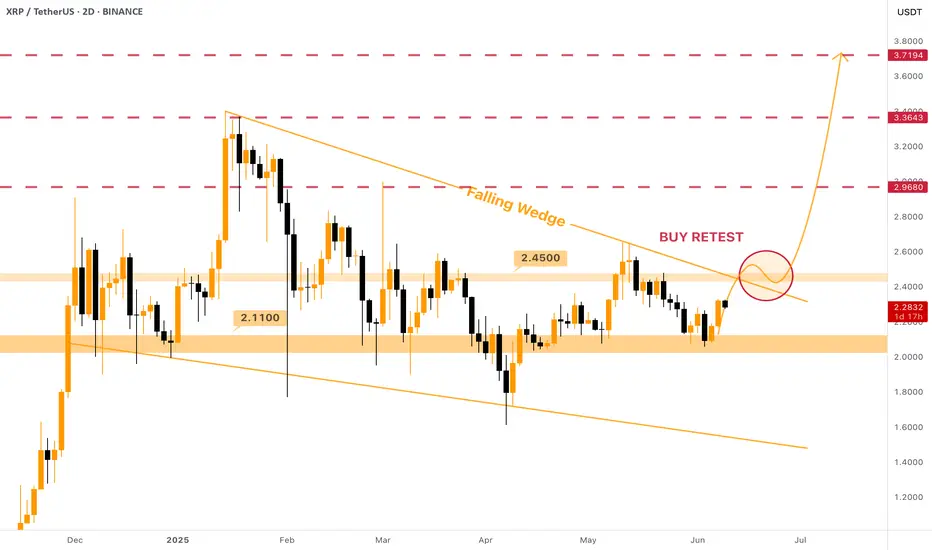
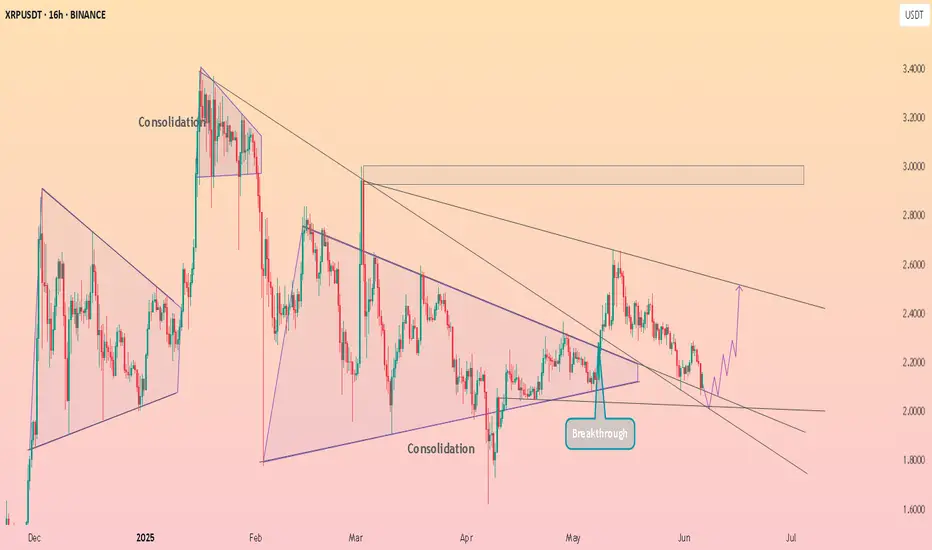
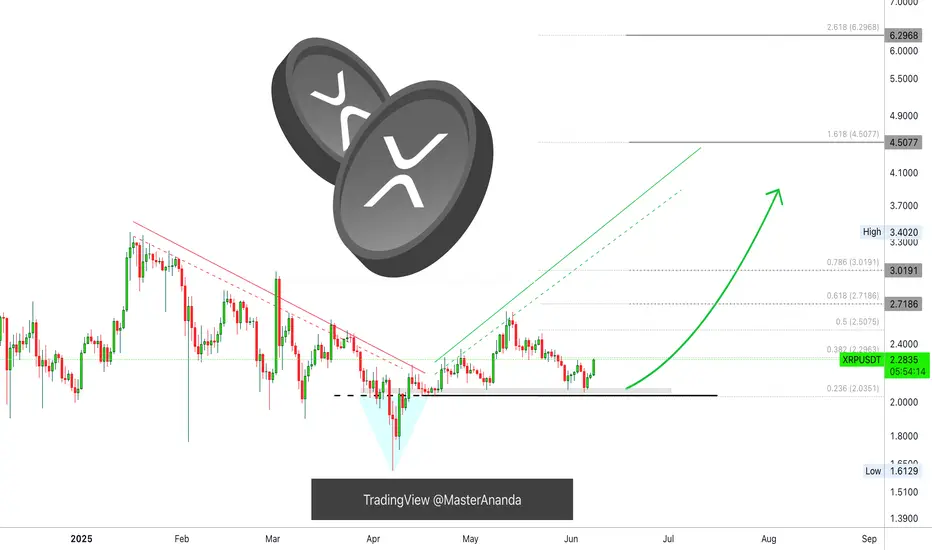
There is a strong horizontal support level of $2.11 that was established back in December of 2024 and has held the price perfectly (with only one breakdown) since then. Moreover, at that time a massive Falling Wedge started forming and is still doing it up to this day.
Talking about resistances, there is a $2.45 one. Not very strong, but solid enough to form a decent horizontal channel within which the price moves.
So, as the result we have the following structure: CRYPTOCAP:XRP has been consolidating above strong support for 6 months already and formed a pattern that suggest upcoming upward movement. The perfect entry spot in LONG will be at the breakout&retest of the both $2.45 resistance and Falling Wedge resistance (they perfectly correlate) .
Target zone of $3.5 - $4 can be reached within the next 3 - 5 months.
XRP set to moon to $5.20Big retracement & re-test done. So what we are now looking at is $5.20 target which if FIB extension 1.618.
Enjoy the alt season ladies & gents!

Explosion Imminent?As Bitcoin ( BINANCE:BTCUSDT ) is digesting price action towards further continuation of its preceding trend (Up), BINANCE:XRPUSDT is a prime candidate to gain great percentages to the upside, as a saying goes....
"A rising tide lifts all boats"

$XRP / USDT Daily Chart 🚨 CRYPTOCAP:XRP / USDT Daily Chart
✅ Breakout from long-term descending channel
✅ Currently trading at $2.25 (+326%)
✅ Bullish retest holding strong
📈 Next target zone: $2.80 – $3.00
A confirmed breakout here could trigger the next big move.
Momentum building — breakout watch ON!

Crypto Patience or Crypto Poison? Escape the Trap of HopeIs sitting on a losing position without a plan still called patience—or just chronic self-deception? How many times have we told ourselves, “Just one more pump, and it’ll come back,” only to watch our capital get sliced in half?
Hello✌
Spend 3 minutes ⏰ reading this educational material.
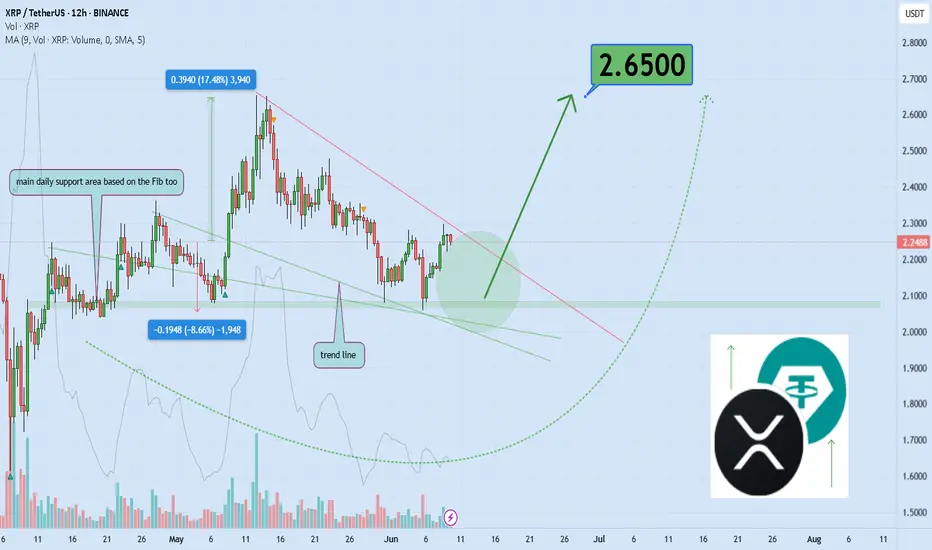
🎯 Analytical Insight on XRP:
XRP is currently testing a key daily support zone, aligning with a descending trendline — a high-probability confluence area 📉. If this level holds, a potential upside move of around 17% could follow, with a primary target set near 2.65. Risk management remains essential as price action unfolds 🚀.
This analysis dives into one of the harshest truths in the market: when patience stops being a strength and becomes your biggest weakness.
🧩 The Victim Mindset: Why Do We Hold?
Most traders hold losing positions not because of logic—but because of fear. Fear of being wrong. Fear of realizing the loss. So the mind creates false hope to avoid pain. Every extra minute you “wait,” without a proper update to your thesis, you're letting the market control you—not the other way around.
📊 Smart Usage of TradingView Tools
TradingView isn’t just for drawing lines—it gives you smart tools that help prevent emotional traps. Let’s explore a few that can reshape your trading mindset:
Risk/Reward Ratio Tool: If you haven’t defined your loss tolerance from the start, patience becomes meaningless. This tool visually shows you whether your hold is strategic—or just emotional.
Fixed Range Volume Profile: Traders often get stuck in zones of high trading volume. This tool shows where the market traps liquidity and traders alike.
Alerts: If you don’t set exit alerts beforehand, emotions will make the decision for you. Use alerts to guide your logic—not your fears.
Replay Tool: Go back in time, relive your bad decisions, and study them. This helps build psychological awareness through chart practice—not just technical analysis.
Using these tools consistently turns your trades into structured decisions, rather than emotional guesses. TradingView gives you everything—you just have to use it wisely.
🪤 Patience or Behavioral Trap?
Have you noticed how after long periods of “holding,” your next move tends to make things even worse? That’s called a behavioral trap. After investing time and energy into a trade, you subconsciously want to “recover” that loss. So you increase your risk—or worse—re-enter the same losing coin.
🔍 Mental Positions vs. Market Positions
Most traders think they only have a position on the chart. But there's also a mental position—made of hope, fear, regret, or ego. More often than not, it's the mental position that makes us stay stuck—not the chart itself.
🧠 Spotting Real Patience vs. Emotional Holding
A quick checklist to test your patience:
Did you define your stop-loss and target before entering?
Are you holding because of a technical level—or just fear of realizing a loss?
Did you update your analysis—or are you clinging to outdated hope?
If this trade setup happened again, would you still hold?
💣 When "HODL" Becomes Mental Paralysis
In crypto, “HODL” isn’t always strategy—it can become mental paralysis. You can’t sell, not because of logic, but because of fear. That’s not conviction—that’s a warning sign.
🧱 Didn't Go Risk-Free? Then Patience Is Gambling
Patience only makes sense if your position is at least partially risk-free. If your capital is still fully exposed, your so-called patience is just emotional gambling. The market has no mercy for those without a plan.
🧭 Smart Exits: The Only Productive Patienc e
Sometimes patience means waiting for a better exit—not for a complete recovery. Kill your fantasy scenarios and look at what risk control really means. If your patience isn’t supported by structure, it’s a ticking time bomb.
🔚 Final Thoughts
Patience in crypto is not always a virtue. Without proper tools, structure, and psychological awareness, it becomes destructive. Use TradingView's tools wisely, build discipline, and know when you're waiting with logic—or just with fear.
📜 Please remember to do your own research before making any investment decisions. Also, don’t forget to check the disclaimer at the bottom of each post for more details.
✨ Need a little love!
We put so much love and time into bringing you useful content & your support truly keeps us going. don’t be shy—drop a comment below. We’d love to hear from you! 💛
Big thanks,
Mad Whale 🐋
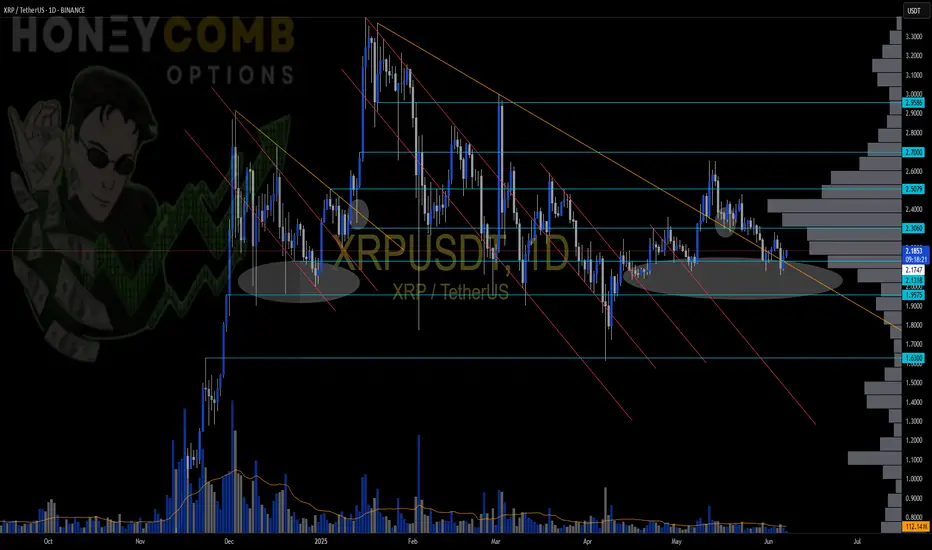
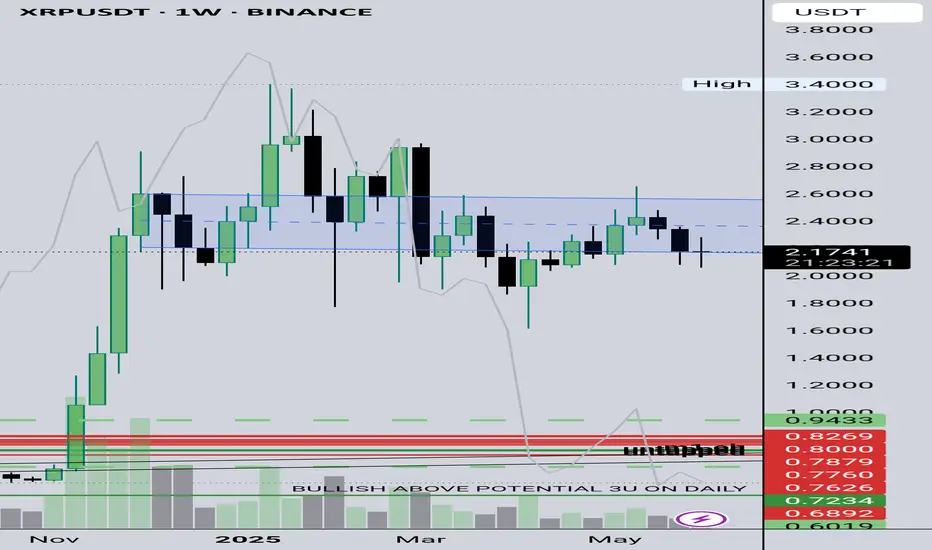
HolderStat┆XRPUSD eyes 2.50 breakoutCRYPTOCAP:XRP coils between 2.10 footing and a falling roof after May’s breakout. Ripple price shows serial consolidation; punching through 2.50 unlocks the 2.90 supply block, while failure under 2.00 would stall the bulls’ script.
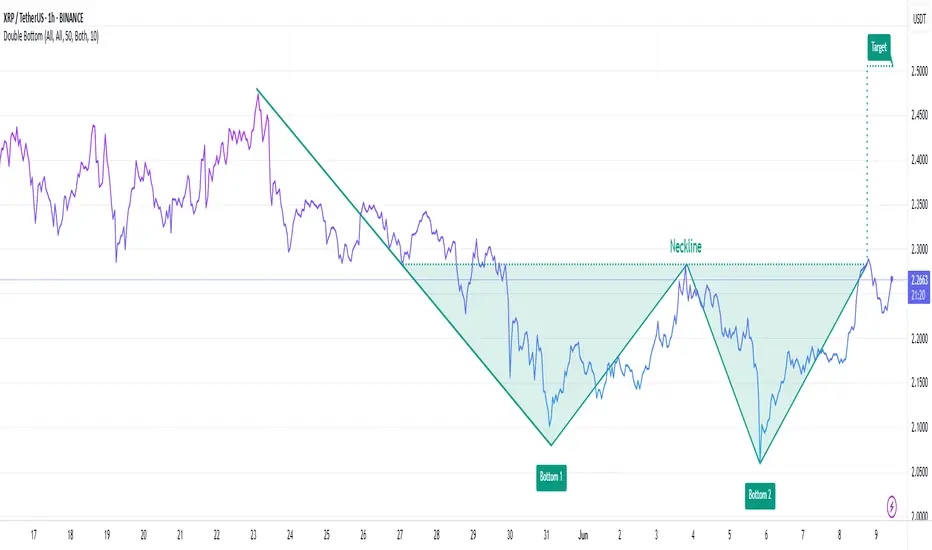
XRPUSDT Double-Bottom Breakout: $2.50 Target in Sight?The classic double‑bottom breakout appears to be unfolding between ~$2.06–2.10, confirmed when price broke above the neckline at ~$2.28.
Traditional analysis suggests measuring the distance from the bottoms to the neckline, and projecting this upward, setting a breakout target near $2.50
Key Levels to Monitor
Support zone: $2.06–2.10 — must hold above this area to keep the bullish structure intact
Near-term resistance: $2.28 – recent neckline sit here
Next resistance levels: $2.50, $2.65–2.70, and even $3.00 if momentum supports it
Volume & Confirmation
Confirmation of this breakout should come with increased volume. The current volume has been relatively subdued, indicating possible weakening momentum.
A clean breakout above $2.28 accompanied by a volume spike and bullish candlestick (e.g., engulfing pattern) would solidify the breakout.
Invalidation
A drop below $2.06–2.10 would break the double‑bottom structure, opening the door to deeper support tests around $2.00 or even $1.70
Not financial advice.
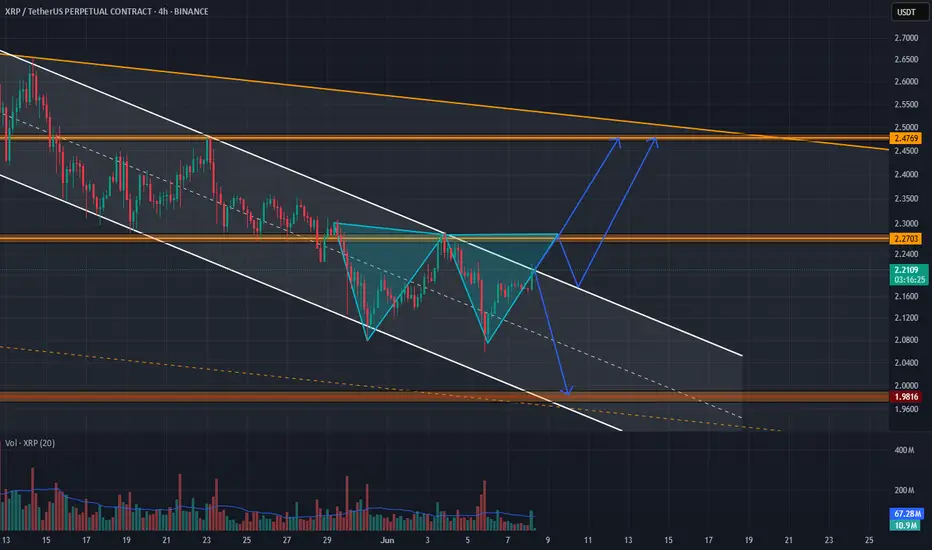
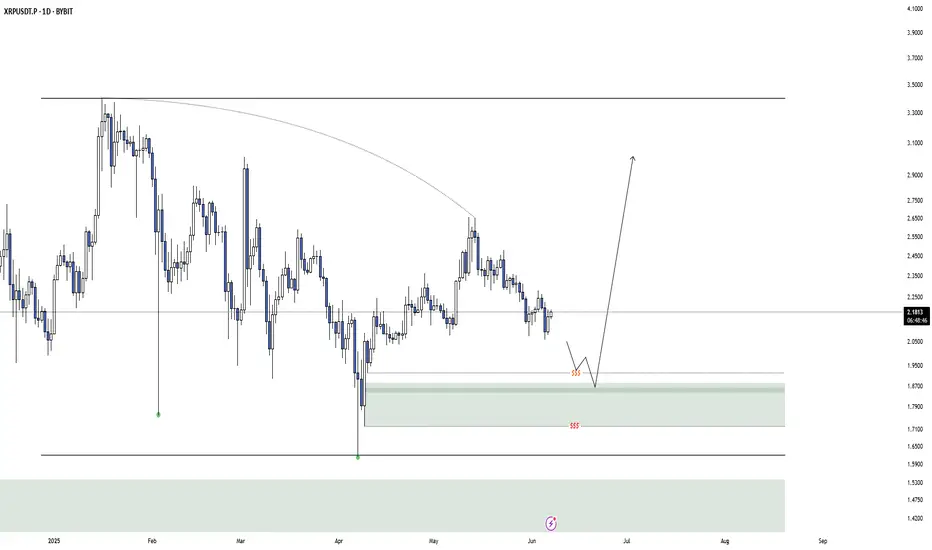
Xrp can make a double bottom patternBINANCE:XRPUSDT.P
Xrp is in a bearish channel, if it breaks and complete the double bottom pattern we go to 2.45-2.50$ area which is a double resistance.
When the double bottom completed we can see a retest to do channel, or directly go up.
İf xrp want to go down, we see a movement to channel bottom to 2$ area, which is a double support.
XRP tapped the 0.786 retracement and is reacting sharply — Smart📍 Key Entry Zone: 2.2182 (deep liquidity grab just under FVG 15m & BTS 15m zone)
🔁 Context: Liquidity sweep → FVG mitigation → Signs of displacement
Bullish Case 🎯
TP1: 2.2482 (0.5 fib + imbalance refill)
TP2: 2.2750 (0.236 fib — classic reaction zone)
TP3: 2.2989 (local high; likely liquidity target)
Max Target: 2.2819 (Volume Imbalance top POC zone)
Bearish Invalidation ⛔
A candle body close below 2.1975 invalidates the bullish structure (1.0 fib)
STB 15m block becomes absorption, not rejection — sign to reassess
Momentum shifts are born in the shadows of liquidity — and this looks like Smart Money speaking.
Check my profile for more tactical breakdowns and sniper entries.

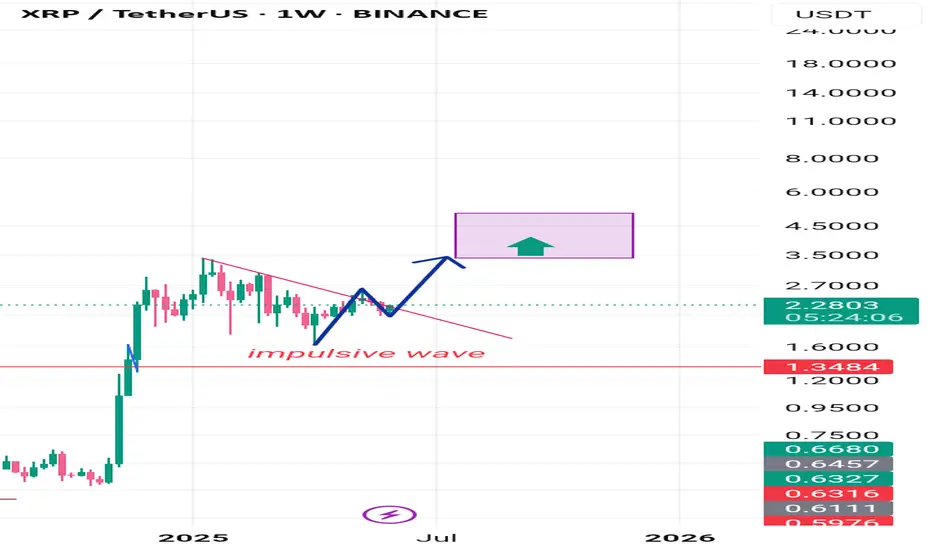
Ripple in impulsive wave, 3.5-5 target is possible personal idea: Ripple grew extensively in past bull run and went cool period, currently as the chart shows, in my opinion Ripple is starting new impulsive wave and in my opinion target of 3.5-5 easily accessible. Good 🙂luck 👍
XRP Moves Forward—How To Maximize Profits, Aim At $4.5 Or Higher5-June gave us the confirmation for a higher low.
8-June is telling us the continuation of the bullish move is true. XRP moves forward.
How are you doing my friend in this beautiful Sunday?
I hope you are doing great.
The bottom happened 7-April, the peak happened 12-May.
24 Days for the retrace to be completed, between 12-May and 5-June.
It's been 27 days since we last saw some bullish action, almost an entire month.
I fully understand how people become bored, it is just too long, the market never moves straight up. But this can be taken in different ways. If the market were to move straight up, there is no chance to adapt, to recover, to plan and to learn. Now that the market made a full pause, we are ready for a new wave of growth and this time we can maximize profits on the way up.
How to maximize profits?
Hold strong. Hold long. Wait for higher targets.
Let's revisit the targets and how to approach them.
The "selling for profits" strategy where we sell a portion at each target is for blind traders. This method is used when we are trading with a high level of uncertainty about the next wave top. This method we can ignore here because we know where prices are headed next. To maximize profits with XRPUSDT, ignore $2.71, ignore $3.02, ignore the new ATH and aim straight at $4.51 with your full position with high lev. That's how to maximize profits.
Take some profits at this level only to buy more when the next retrace shows up. We are going higher, so you can keep on holding and wait for $6 or more. While we ignore the lower targets, when prices are higher we do not ignore them anymore. It doesn't matter how far up it goes, but we have to be careful after reaching $4.4.
Aim high because we are going high. The market is preparing for several months of sustained growth. Some of the older projects, mid-size and small size based on market cap., are showing signals of an entire year of bullish action ahead. It is not yet confirmed, but if it happens, this will be the biggest and best bull market in the altcoins history. A very big one.
For example, XRP peaks early because it started early and we get maximum profits from this pair. When the correction starts for XRP, the rest of the market continues growing. We can move capital from this pair to smaller pairs. And there will be thousands of those.
While XRP can grow 50% in a matter of weeks or months, a small pair can grow 150% in a single day. We have to take advantage of the big and the small ones. Diversification.
If you enjoy the content, consider follow.
Thanks for the continued support.
I'll see you at the top.
Namaste.
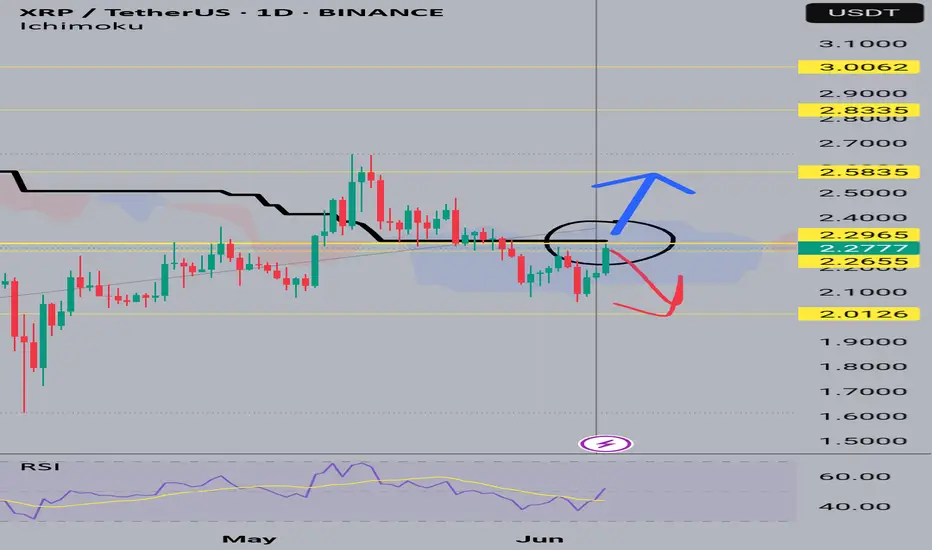
XRPUSDTHi snipers. We are witnessing good news regarding XRP. The price has also grown well in the one-day timeframe and has reached a sensitive point. If it breaks and crosses the (black) moving average line, we will witness another price jump. I am learning and practicing. This is not a trading offer.
XRP is preparing for breakout !XRP / USDT
Xrp is forming small flag pattern above previous big accumulation zone
Looks like a breakout could happen soon
Keep an eye on this chart and trade / follow accordingly
Best of wishes

IS XRP AT SHORT TERM BULLISH REVERSAL ?The overall trend has been bearish with a series of lower highs and lower lows. Around 2.05 ,2.10, where price previously found support multiple times.Price formed a double bottom / higher low near 2.08, If rejected at 2.22–2.25 zone, price may revisit 2.10 or even 2.05.

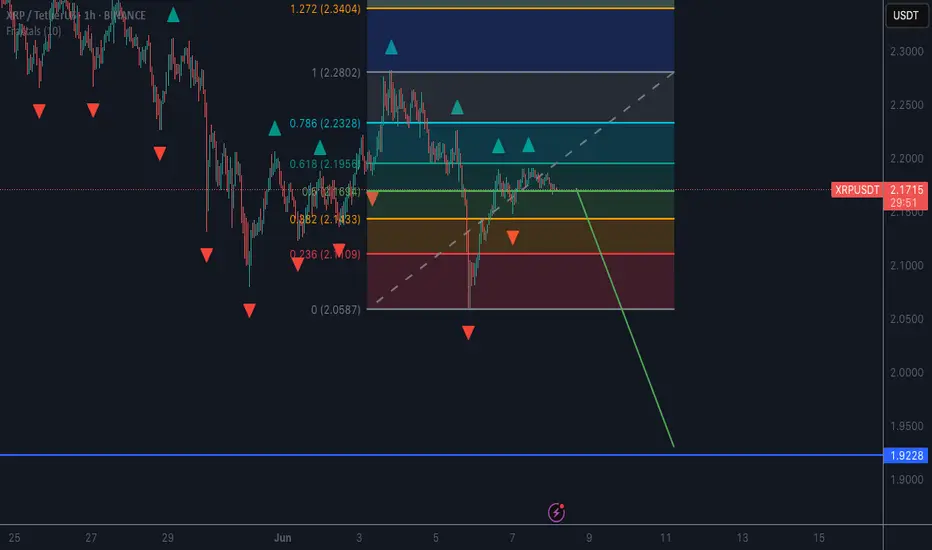
XRP Bearish? Bull Run ExhaustedFractal formed on 1 hr chart within 0.618-0.5 fib zone after price retraced towards 2.2 supply zone. Looks like bulls are exhausted. Expecting further downside below 2
XRP Back on the MENU! XRPUSD Ripple next move? XrpUsdtIt's been a while since we looked at this chart.
🌍 SeekingPips 🌎 View remains the same and so we are strictly looking for strategic LONG entry points in
TIME & PRICE. 👌
Yes it's a WEEKLY chart and I understand that many of the trigger happy TRADERS or in some cases GAMBLERS can't stand to look at anything longer than a 30 minute chart BUT really sometimes you really just have to STEP RIGHT BACK to see the BIGGER PICTURE👍
✅️This week's candle CLOSE really has the potential to setup the next few weeks for easy MULTIDAY TRENDING MOVE TRADE SETUPS 👍
ℹ️ Note the price location on what we viewed as a HTF FLAG MANY WEEKS AGO .
Yes it was breached both sides but 🌎SeekingPips🌍 doesn't trade the patterns themselves but the HUMAN PSYCHOLOGY AROUND THESE PATTERNS.🤔
ℹ️ Note where most of the volume has been trading and also note the moves around the extreems of the dead patteren too.💡
In an even higher TIMEFRAME THE FLAG would still be valid and forming the flag itself too.
📊 [ b]CHECKOUT the MONTHLY chart for the example. 📉
Anyway we will see what the next 48 hours🕦 hold but no doubt this one is on our RADAR this week.
✴️ 2.048 to hold otherwise a potential for current low of this year to be tested.
✴️ Alternatively if support starts to form on the 240min chart at current levels last weeks high could expected to be tested
✴️ if so Xrp could easily give a multiday upside trending move.
Now like a NINJA we wait and stalk...
As always ladies and gentlemen whilst Seeking Pips 🌍 SeekingPips 🌎 says
" NO TRIGGER NO TRADE"
& "STICK TO YOUR PLAN"✅️
👍 Have a GREAT WEEK and we will see you soon with an UPDATE...
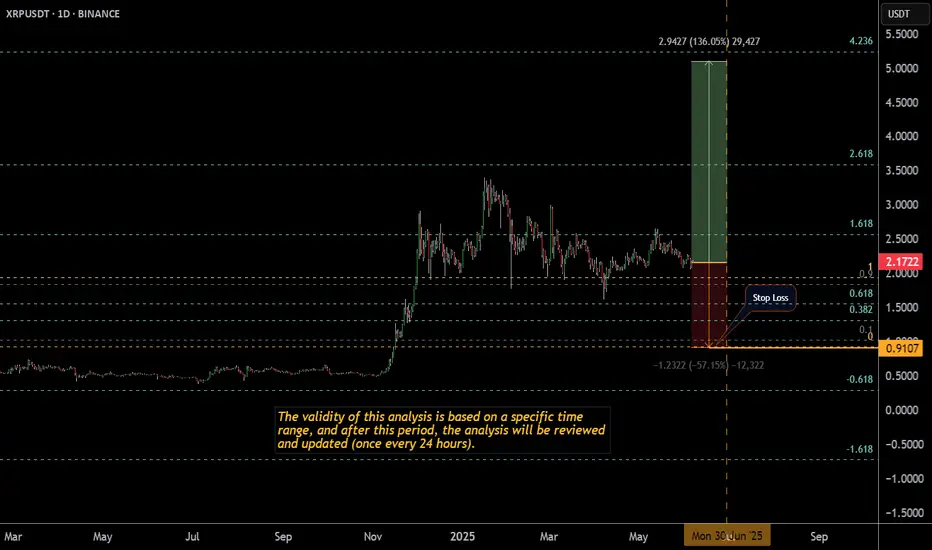
Ripple-XRPUSD Periodic Analysis-ssue 87 (Free Access)The analyst believes that theprice of Ripple will increase within the time specified on the countdown timer. This prediction is based on a quantitative analysis of the price trend.
___Please note that the specified take-profit level does not imply a prediction that the price will reach that point. In this framework of analysis and trading, unlike the stop-loss, which is mandatory, setting a take-profit level is optional. Whether the price reaches the take-profit level or not is of no significance, as the results are calculated based on the start and end times. The take-profit level merely indicates the potential maximum price fluctuation within that time frame.
XRP AccumulationI'm looking for a Model 2 on XRP, either from the liquidity, extreme demand, or extreme liquidity.
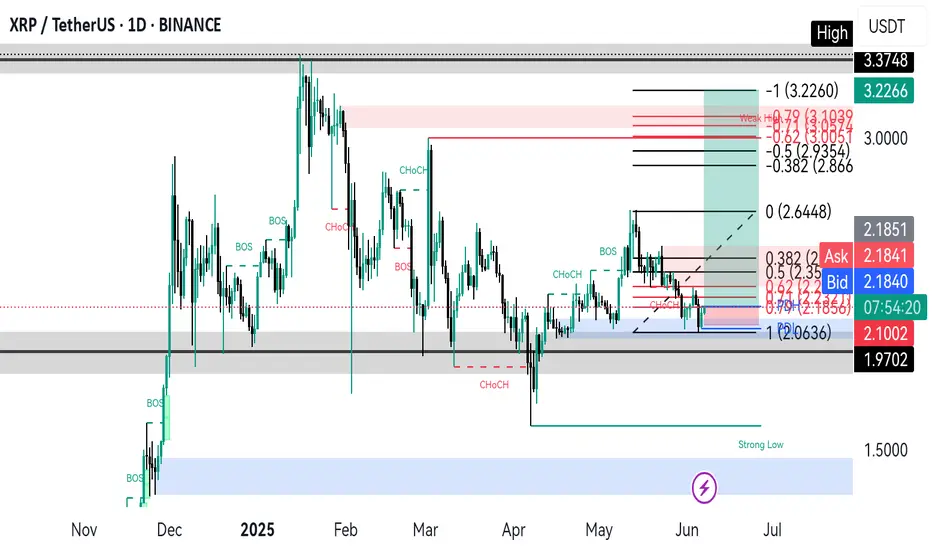
Xrp Buy zone📊 XRP/USDT Chart Breakdown
1️⃣ Price Structure Overview
* The chart spans roughly from November 2024 to June 2025.
* We observe clear market structure changes:
* BOS (Break of Structure) and CHoCH (Change of Character) labels mark shifts between bullish and bearish trends.
* The current price is consolidating around the \$2.17–\$2.18 level.
* Recent local low at \~ \$2.06 (marked as a strong liquidity area).
2️⃣ Key Levels and Zones
* Demand Zones (Support)
* \$2.06 (strong low marked).
* Grey and blue shaded zones from \~ \$2.00–\$2.18 acting as a major support cluster.
* Supply Zones (Resistance)
* \$2.42 (0.382 Fib retracement).
* \~\$2.85 (0.618 Fib) to \$3.19 (recent weak high) – high probability resistance on rally.
* Psychological resistance around \$3.00.
3️⃣ Fibonacci Retracement & Extension
* The Fib tool is applied from the last significant swing high (\~\$3.22)cto the current local swing low (\~\$2.06).
* Fib Key Levels:
* 0.382 → \$2.42
* 0.5 → \$2.64
* 0.618 → \$2.85
* Full extension → \$3.22
* Price currently testing the 0.382–0.5 range, signaling potential bullish continuation if broken.
4️⃣ Liquidity Zones
* The blue shaded region (\~\$2.00–\$2.18) is a major liquidity zone with strong historical reaction.
* Multiple CHoCH points in May-June indicate a possible trend shift to bullish if price holds above \$2.06 and clears \$2.42.
5️⃣ Market Context
* Daily Structure:Range-bound but with an emerging bullish bias after the \$2.06 low held.
* Current Pattern: Accumulation phase after liquidation sweep below \$2.06, possibly gearing for breakout if market conditions stay favorable.
🏆 Correlation with BTC – Recent 7 Weeks of Bullish Momentum
1️⃣ BTC Context
* Bitcoin has been on a sustained 7-week bullish run, breaking key resistance levels and reaching new 2025 highs.
* This has improved overall crypto market sentiment, leading to increasing altcoin interest.
* BTC Dominance is slightly high but showing signs of topping → good for large-cap altcoins like XRP.
2️⃣ Impact on XRP
* XRP is attempting to reclaim major levels and follow BTC’s momentum.
* BTC’s rally is pulling liquidity into the crypto market, benefiting XRP’s chances of a **breakout above \$2.42–\$2.64.
* If BTC consolidates or slightly pulls back without major weakness, XRP could see a strong move towards **\$2.85–\$3.00.
---
3️⃣ Watch For
* BTC holding above recent highs → more confidence for altcoins.
* BTC correcting sharply → XRP may retest **\$2.06** or lower.
* XRP key breakout: **\$2.42–\$2.64** → if broken with volume, targets \$2.85+.
📈 Summary
✅ XRP is currently in **accumulation mode** above a strong demand zone.
✅ Market structure shows **recent CHoCH indicating potential bullish reversal**.
✅ BTC’s 7-week rally has provided a **favorable environment** for XRP to rally if momentum continues.
✅ Critical level to reclaim: **\$2.42**.
✅ Bullish target if broken: **\$2.85–\$3.22**.
✅ Caution: BTC correction could stall XRP at current support.
XRP looks like a good area needs volume to push up throughThe volume shelf is holding down, respecting the trendline of a previous bullish area