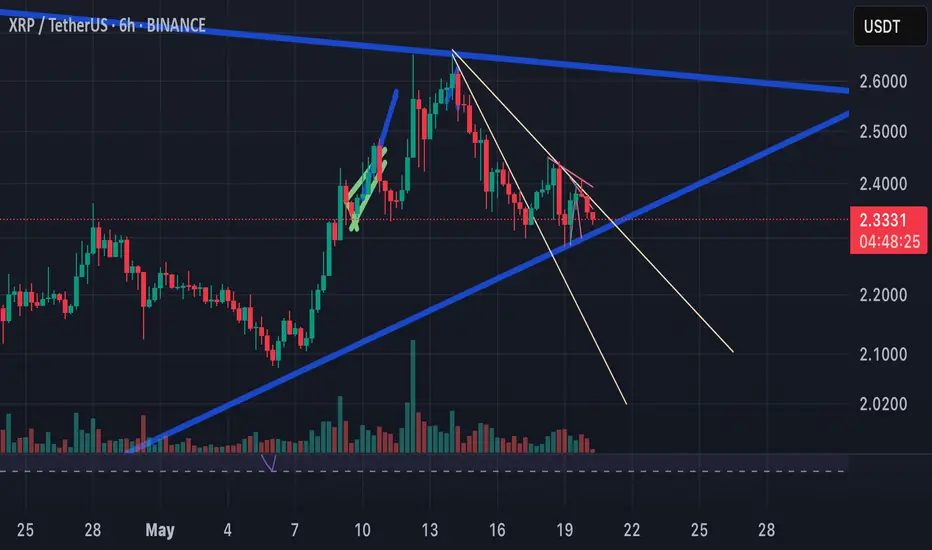
XRP? Diamond recap
Hi
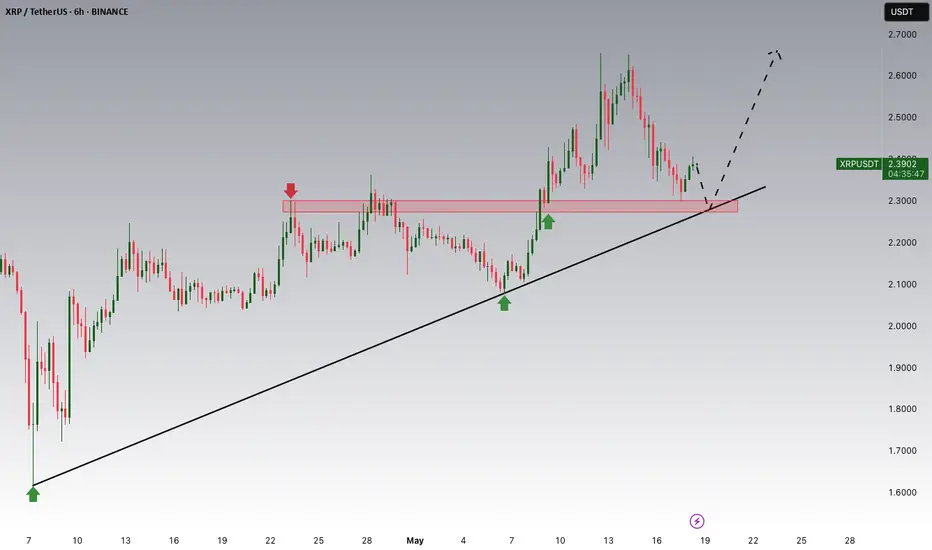
Seems XRP don't want to go down.
What I have to look : Will it turnaround and become bullish back.
= respecting the up trendline.
Price will need to be 2.38/39
BTC also booked higher than the resistance
All the best
Not a guru
XRPUSDT.3L trade ideas
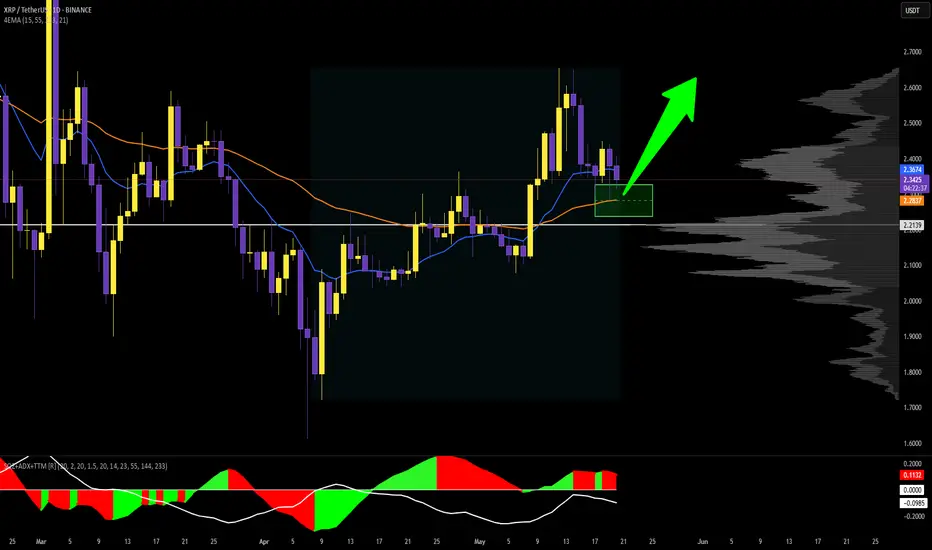
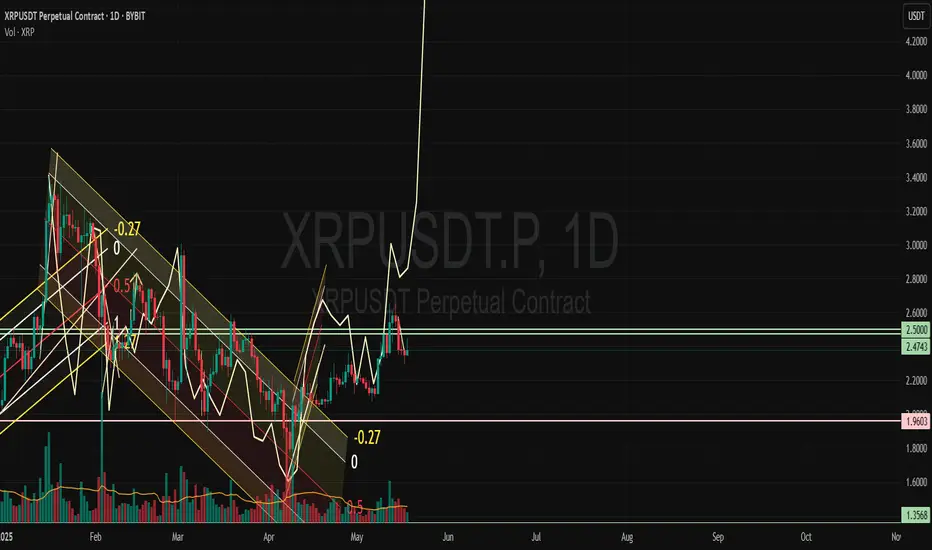
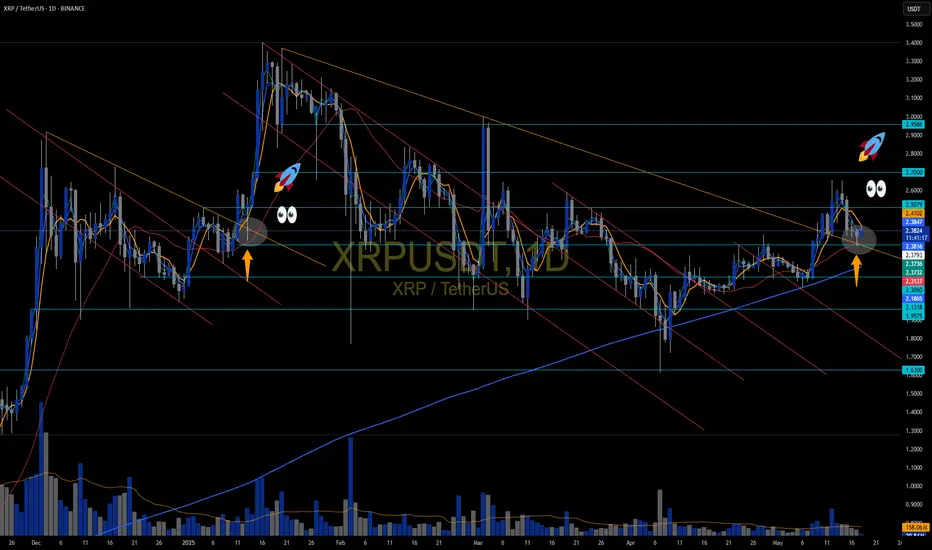
1D XRP/USDT Projection, in accumulation zone or bullish entries.For the XRP chart, the price retraces the moving average of 55 periods, which gives us the possibility of making spot purchases or upward entries with Zone leverage ($2.32 - $2.23).
The SQZ still maintains directionality but the strength in the ADX does not accompany the movement so, according to the strategy, the probabilities of having a bullish rebound increase, either by seeking relative maximums ($2.65 dollar) or approaches to maximums ($3 dollar).
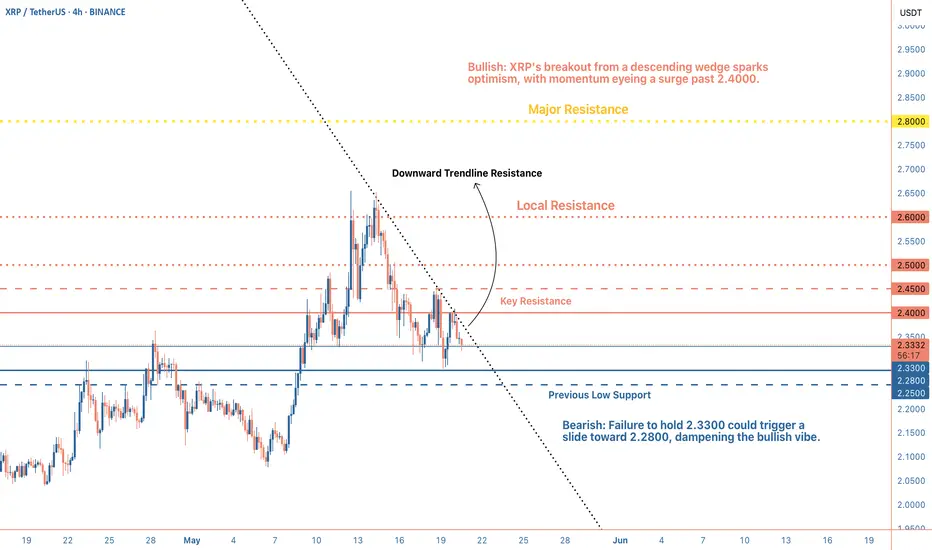
Potential Surge Ahead for Ripple?XRP is currently trading around 2.3300 and showing signs of a recent breakout from a descending wedge pattern (a classic bullish reversal signal). This move is backed by a bullish divergence on the Stochastic RSI, hinting at building upward momentum. However, the RSI is nearing overbought levels, suggesting a potential short-term pullback might be on the horizon before any sustained rally.
Technical Analysis:
Key support levels to monitor are 2.2800 and 2.2500, both of which have acted as reliable floors in the past. On the upside, resistance sits at 2.4000 and 2.4500 (levels XRP will need to conquer to confirm the bullish trend). The 50-period moving average is currently below the price, reinforcing the bullish bias, but traders should watch for a possible correction if the price struggles to break through the resistance zone.
Market Sentiment and News:
The market sentiment around XRP is cautiously optimistic. Despite $170M in net market selling over the past week, XRP has climbed 11%, pointing to strong accumulation by passive buyers. The recent launch of XRP-based futures by CME Group adds a layer of credibility, potentially drawing institutional interest. That said, the ongoing SEC lawsuit continues to linger as a concern for some investors, possibly tempering enthusiasm.
Looking ahead, XRP could push higher if it clears the 2.4000 resistance, with potential targets at 2.5000 and 2.6000 in the short term. However, if the price fails to stay above 2.3300, a dip toward the 2.2800 support could unfold. Traders should keep a close eye on price action for confirmation of either scenario.
Looking for a bounceI’m looking for entry around 2.30. Short term target 2.35, break above I’m looking for 2.40.
SL is tight
XRP/USDT: Triangle Breakout Setup With 13% Upside PotentialXRP appears to be forming a symmetrical triangle pattern after recent consolidation. The price is currently at a critical decision point with several technical factors suggesting a potential upward breakout:
Technical Analysis
Price is currently testing the lower boundary of the symmetrical triangle at $2.3482
EMA alignment shows bullish potential: 5-period ($2.3608) > 10-period ($2.3676) > 20-period ($2.3675)
RSI (14) at 43.53 indicates room for upward movement before reaching overbought conditions
Volume profile (672.64K) shows accumulation during this consolidation phase
Trade Setup
Entry Zone: $2.3450-$2.3550 (current price area)
Target 1: $2.5000 (psychological resistance)
Target 2: $2.6637 (projected from triangle breakout measurement)
Stop Loss: $2.2288 (below recent support)
Rationale
This trade capitalizes on the triangle pattern completion with confirmation from EMA support.
The projected move could represent approximately 13% upside from current levels. The risk-to-reward ratio is favorable at roughly 1:3.
Key timing appears to be critical now as we approach the apex of the triangle. A sustained move above the 20 EMA would confirm the bullish scenario, while failure to hold current support could invalidate this setup.
Wait for volume confirmation on the breakout before committing significant position size.
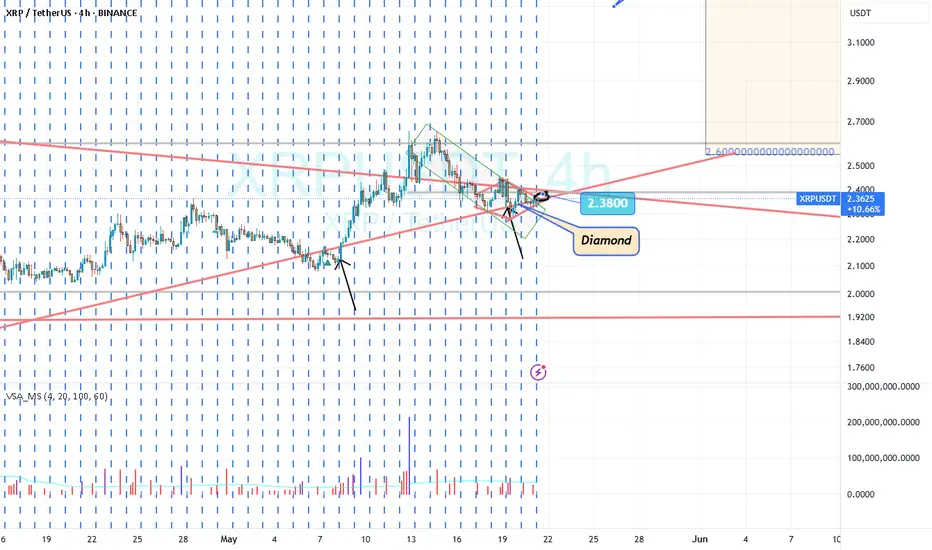
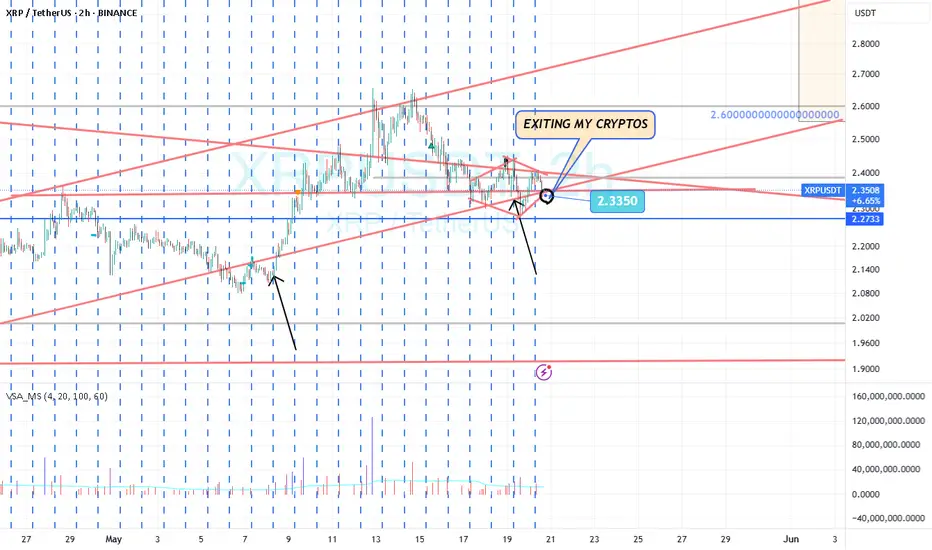
XRP? exits
Hi
This is a Diamond formation.
The location is at UP trendline.
Looking for a break below trendline this this diamond.
If this happens. Gonna see a weekly break to downside, testing lower prices
Have to watch.. will it respect or not
All the best
XRP pull back, it's time to buy?Toching the trend line for the 2nd time, CRYPTOCAP:XRP after candle verification could become bullish.
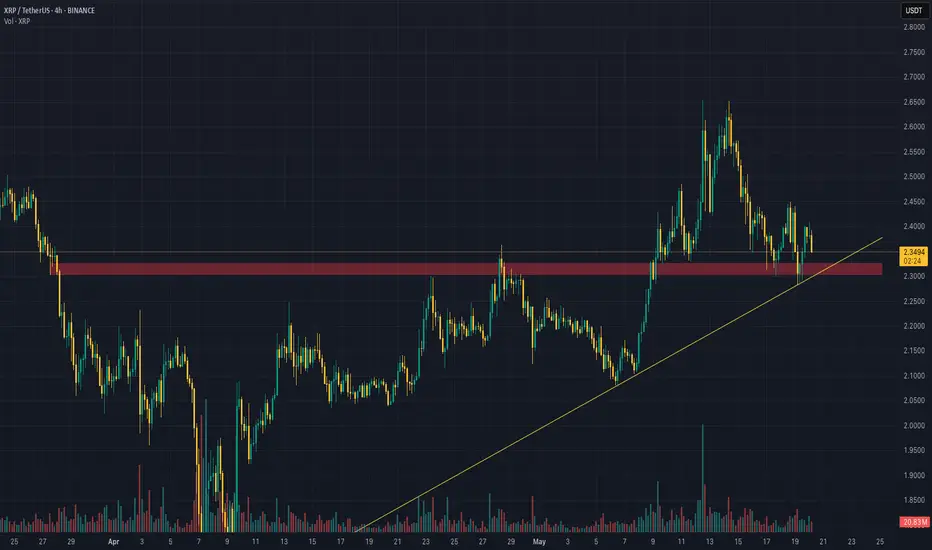
Ripple is Nearing The Daily TrendHey Traders, in today's trading session we are monitoring XRPUSDT for a buying opportunity around 2.28 zone, Ripple is trading in an uptrend and currently is in a correction phase in which it is approaching the trend at 2.28 support and resistance area.
Trade safe, Joe.
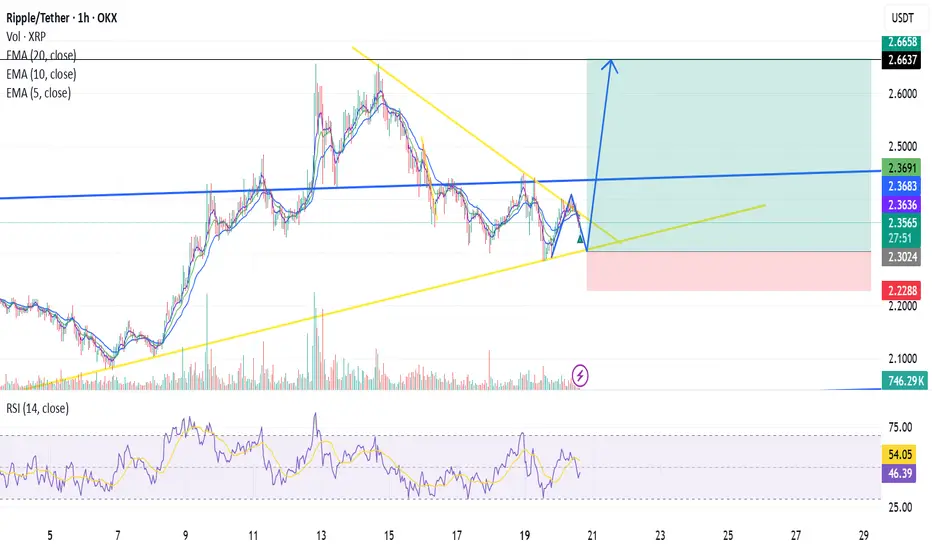
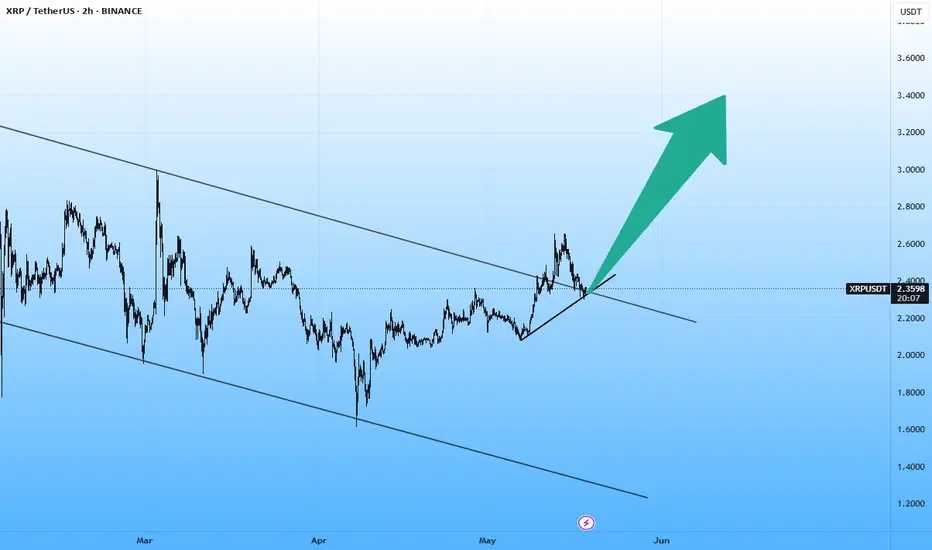
Trend line XRP/USDT Long Setup – 2H Chart (BINANCE)
Published: May 19, 2025
Trade Idea:
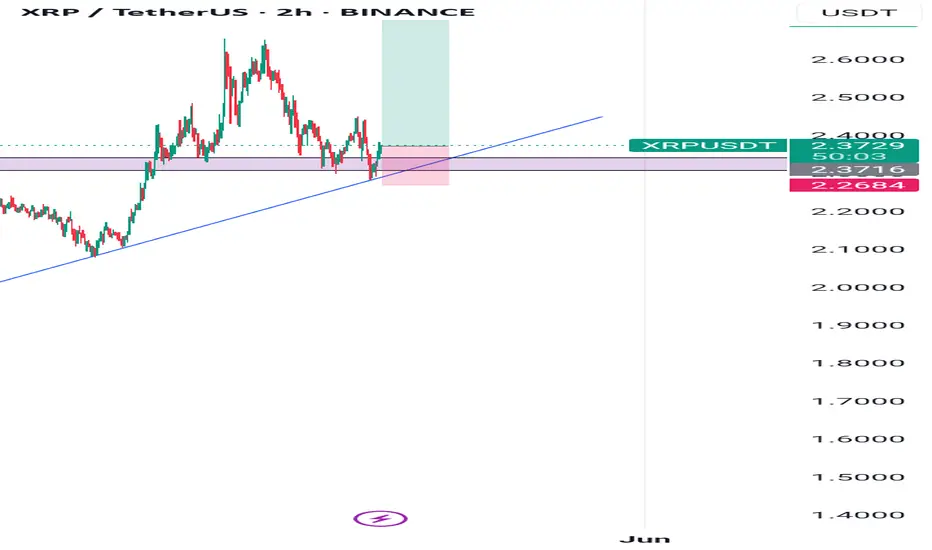
This is a bullish continuation setup on XRP/USDT based on a confluence of support zones and trendline structure. Price is currently reacting to a key horizontal support level (around $2.36), which aligns with a long-term ascending trendline that has held since early April.
Key Technical Elements:
Support Zone: A clear horizontal demand zone between $2.26 and $2.37, where price previously consolidated and broke out from. Price has returned to this zone, suggesting a potential retest.
Ascending Trendline: The market has consistently formed higher lows since April, creating a strong bullish trendline acting as dynamic support.
Bullish Rejection: The recent candles show a bounce off both the trendline and the demand zone, indicating buyer interest.
Risk-Reward Ratio: The setup suggests a favorable risk-reward ratio.
Entry: Around $2.36
Stop Loss: Below the demand zone at approximately $2.26
Take Profit: Above $2.60, aligning with previous highs
Bias: Bullish
As long as price holds above the $2.26-$2.36 support and trendline, the bullish structure remains intact.
Confirmation Needed:
A strong bullish candle close above the resistance at $2.37 would confirm the continuation of the upward trend and increase the probability of hitting the target.
XRP ready to move up.Based on its current chart structure, underlying fundamentals and on‑chain metrics—and with XRP trading today at $2.29—XRP appears ripe for a near‑term 13% rally to roughly $2.59. Technically, XRP has been carving out a textbook ascending triangle over the past month, with steadily higher lows and a firm resistance level right at $2.33–$2.34; a decisive breakout above that ceiling—ideally on volume exceeding the 30‑day average—would project XRP toward our $2.59 target. From a fundamental standpoint, the network’s fee‑burn mechanism continues to shrink the circulating supply, while growing institutional adoption—illustrated by the recent integration of XRP liquidity rails by multiple payment providers—underscores real‑world demand. On‑chain analytics reinforce this bullish view: the NVT (network‑value‑to‑transactions) ratio has begun to decline off its multi‑year highs, signaling that transaction throughput is rising faster than market valuation, a classic precursor to price appreciation, and addresses holding over 1 million XRP have increased by 8% in the last two weeks. Taken together—structural setup, deflationary supply dynamics, improved usage metrics and concentrated buying by large holders—XRP is well positioned to deliver roughly a 13% advance from $2.29 to ~$2.59 in the coming sessions.
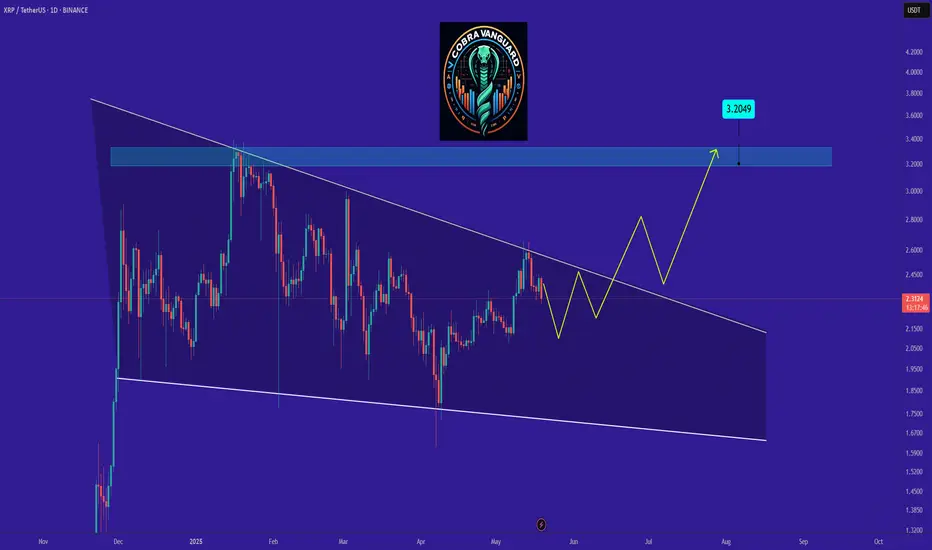
XRP's situation+ Target PredictionThe XRP is in a Bullish phase by a Falling Wedge Pattern.
A falling wedge indicates the potential for price to reach to $3.
Note if the Wedge Pattern is broken downwards with the strength of Bearish candles , this analysis of ours will be failed.
Give me some energy !!
✨We spend hours finding potential opportunities and writing useful ideas, we would be happy if you support us.
Best regards CobraVanguard.💚
_ _ _ _ __ _ _ _ _ _ _ _ _ _ _ _ _ _ _ _ _ _ _ _ _ _ _ _ _ _ _ _
✅Thank you, and for more ideas, hit ❤️Like❤️ and 🌟Follow🌟!
⚠️Things can change...
The markets are always changing and even with all these signals, the market changes tend to be strong and fast!!
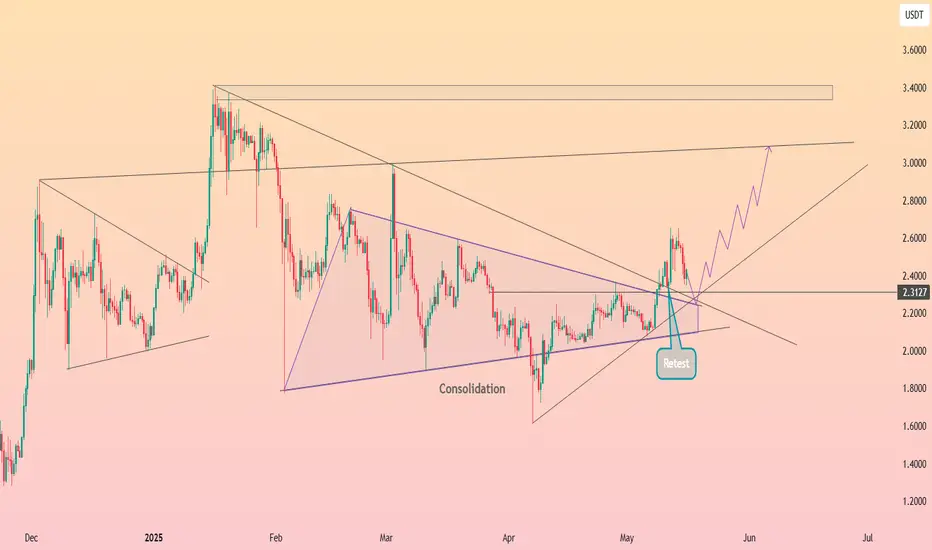
HolderStat┆XRPUSD textbook triangle retest fuels 2.9-3.0 aimCRYPTOCAP:XRP pierced a five-month symmetrical triangle and instantly wicked back to retest the breakout line near 2.20 USDT, leaving a long tail labelled “retest.” The rebound has carved a series of higher lows, indicating accumulation above trend support. As long as 2.20 holds, the measured move projects toward the 2.85-3.00 resistance band drawn by February’s highs. Closing beneath the retest level would neutralise the immediate upside bias but broader ascending guides remain constructive.
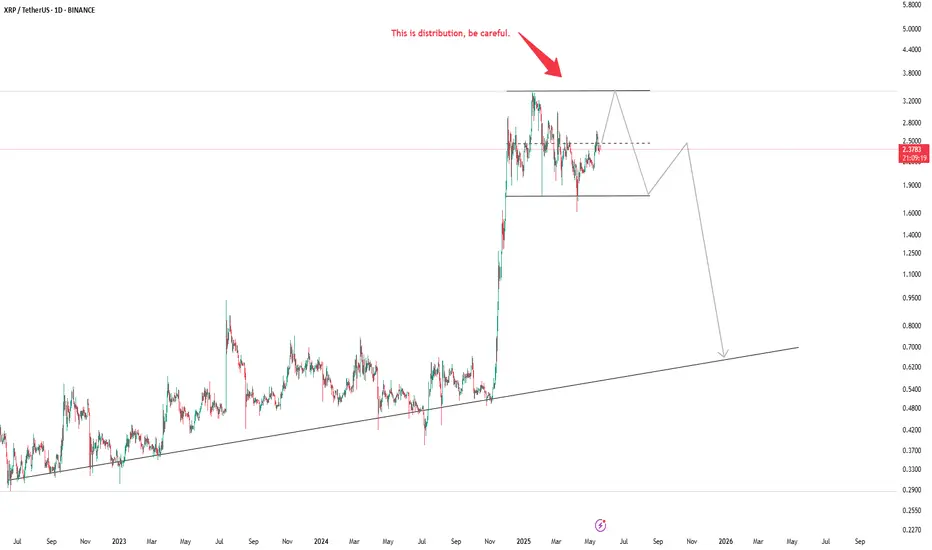
I am not gonna long XRPXRP is in the Distribution phase, I will not take any long position here.
I would rather wait until it reaches the trendline.
XRP : LONG FOR THIS WEEK !Hello friends
Considering the good growth we had, you can see that the price has formed a double top pattern and corrected after reaching its ceiling.
Now, with the price correction, there is a good opportunity to buy in stages and with capital management and move with it to the specified goals.
*Trade safely with us*

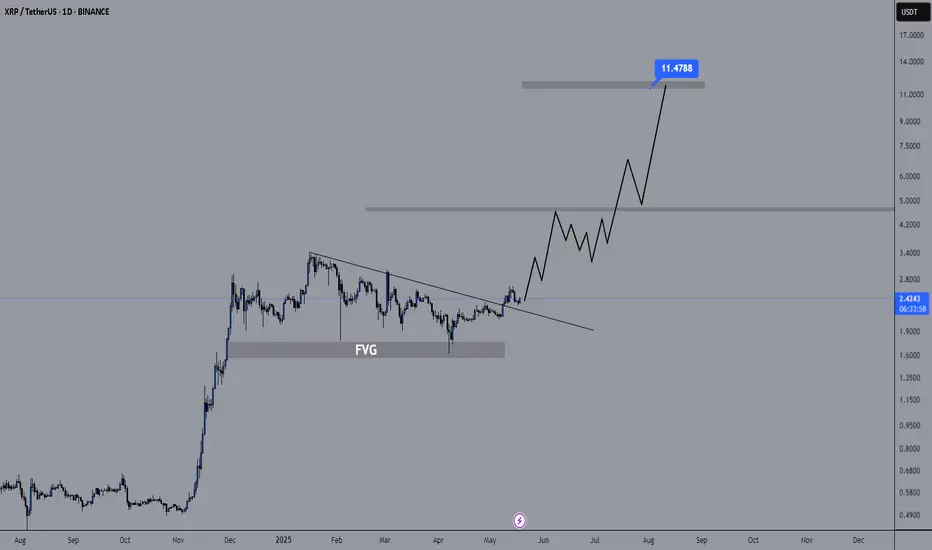
Going up..According to this fractal pattern, XRP is showing strong signs of a bullish trend. The repeating price structure closely mirrors previous upward movements, indicating that XRP could be gearing up for a significant rally. If the pattern continues to unfold as expected, we might see a breakout, pushing the price higher in the coming sessions. Traders should keep a close eye on key support and resistance levels to confirm the bullish momentum.
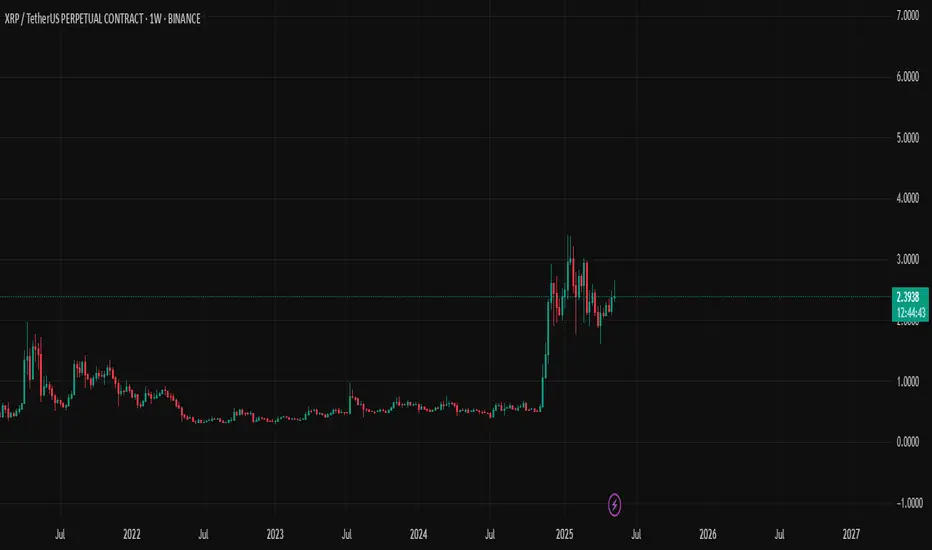
Will Ripple see $11?If we analyze based on the previous growth, and Ripple repeats the previous upward step it made, it could see $11 by the end of next year.
I hope you have used our analysis well.
Follow our page to see more analysis.
Xrp master layout chat gptplease check if this is right this is about chat gpt setting me up to learn how to read charts and what everything means and how they correlate with each other
Is XRP the Next Crypto Rocket?$2,5 Breakout Targets $3.5 or moreI see a clear setup with actionable insights. The chart shows XRP forming a range and deviation at 1.77$, with a recent bullish breakout attempt. Here’s my breakdown:
Technical Analysis
Deviation of the global range points at potential consolidation(blue horizontal line)
Breakout Attempt: A sharp green candle pushed above the $2,36 resistance, but it’s yet to close convincingly above it. The red arrow projecting upward suggests optimism for a move toward $3–$3,5if the breakout holds.
Given today’s date (May 18, 2025, 03:40 PM EEST), this setup aligns with recent crypto market trends. XRP’s price action could be reacting to broader market sentiment, regulatory news, or Ripple-related developments, which have historically driven volatility.
This chart screams opportunity if the breakout holds. However, watch for a false breakout—crypto is notorious for shakeouts. A failure to close above $2,5 could see price retrace to $2,3 or lower. I’d monitor the next 2-3 weeksfor confirmation.

XRP is in a very familiar spot.This looks very bullish to me. It is very similar to the last pump I marked on the chart.
Is a Rally Starting, or Is Another Trap Being Set?
Markets Have Been in the Green for 2 Weeks – But How Long Will It Last?
Over the past two weeks, the cryptocurrency markets have shown clear signs of recovery. Bitcoin even touched the $105,000 mark, while altcoins have begun to bounce back. Social media is once again echoing with “the bull is here” chants. Traders are rushing into long positions, fueled by green candles and fresh hope.
But let’s ask the tough question:
Is this truly the beginning of a bull market—or just another “bait rally” inside a much larger downtrend?
What Has Happened Since March 2024?
Since March 2024, altcoins have suffered massive losses—on average, between 85% and 90% from their previous highs. Many investors didn’t just lose profits—they lost a significant portion of their initial capital.
Now here's the painful truth: If a coin has dropped 90%, it needs to rise 900% just to return to breakeven. In financial recovery, the math is never symmetric.
Losses come easy and linear. Recovery is exponential, and often elusive.
Summer Season: The Historical Pattern
Let’s get real: how many true bull markets have ever started during the summer months?
Almost none. Historically, summers in the crypto world have meant low liquidity, lower volumes, and more consolidation or downtrends.
So, what makes this year different?
This brief green period might feel exciting—but is there real structure behind it, or is it simply a cleverly timed “buy-in lure” before the next leg down?
Why CMA Technologies Never Falls for These Traps
Here’s the good news: At CMA Technologies, we’ve never built algorithms that chase emotional momentum or seasonal noise.
We don’t try to predict markets. We listen to them. We measure. We respond. Our systems don’t act on green candles—they act on probability and mathematical precision.
We don’t care when a trend begins. We care when it ends, and we act accordingly.
Have we continued to profit? Yes. But why? Because we trade with math, not with emotions.
What’s Your Strategy?
Markets are green. People are euphoric again. But what is the architecture behind this rally?
If you zoom out, these two-week surges often prove to be nothing more than rest stops in a larger downtrend.
At CMA Technologies, we don’t respond to sentiment—we respond to data. And that’s the difference.
Conclusion: Bull Market or a Setup for the Next Fall?
I'd love to hear your thoughts in the comments. Some things never change. But systems that are built on math—they only get stronger with time.
👇 💬 Do you believe this rally is real? Or just another summer trap? 🧠 Drop your insights below
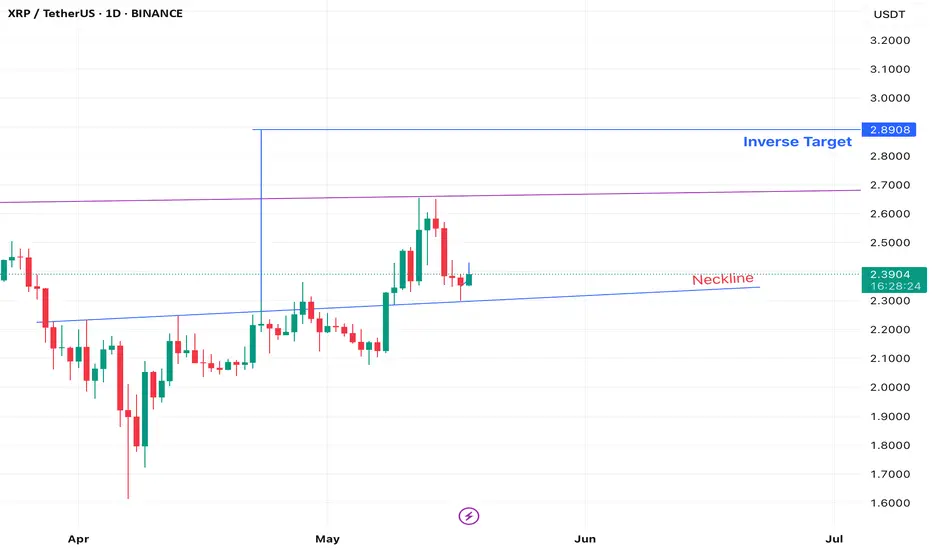
XRP Inverse Head And Shoulders $2.89 TargetWe've had this sitting here for awhile, but we just confirmed a strong perfect bounce off the neckline signaling another attempt to break through the strong resistance above around $2.50 to get to our $2.89 Target
XRP LONG IDEAXRP LONG IDEA. MAKING BULLISH PATTERN AND ALSO RETESTED TREND LINE. EXPECTING ALL TIME HIGH. ALSO BTC.D GOING DOWN.
TO 5$ AT LEAST XRP LONG IDEAXRP LONG IDEA
Very soon, nothing will be holding XRP back.
No lawsuit. No distractions.
At that point, it all comes down to the utility we’ve been talking about for years.
Judgment day is coming—and we’ll see if we were right.
Will we see explosive growth?
Or a slow and steady climb?
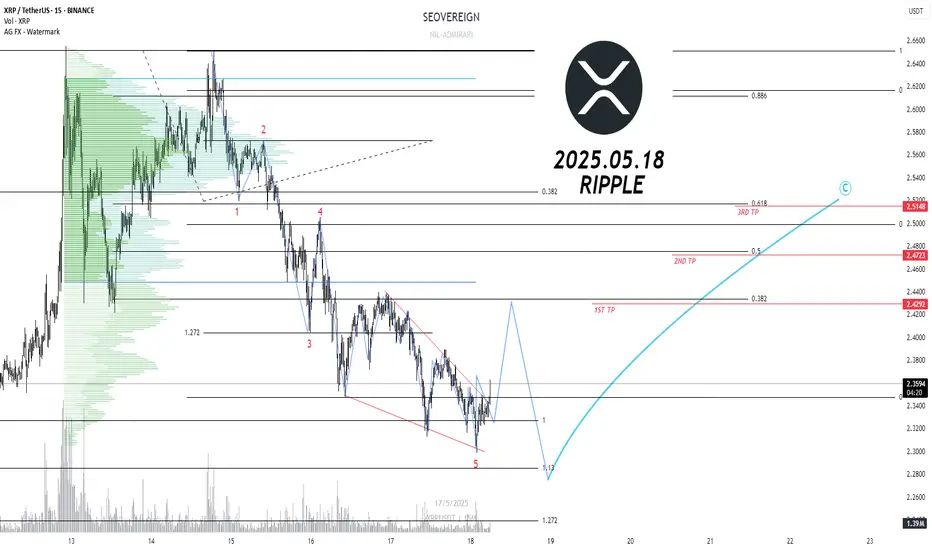
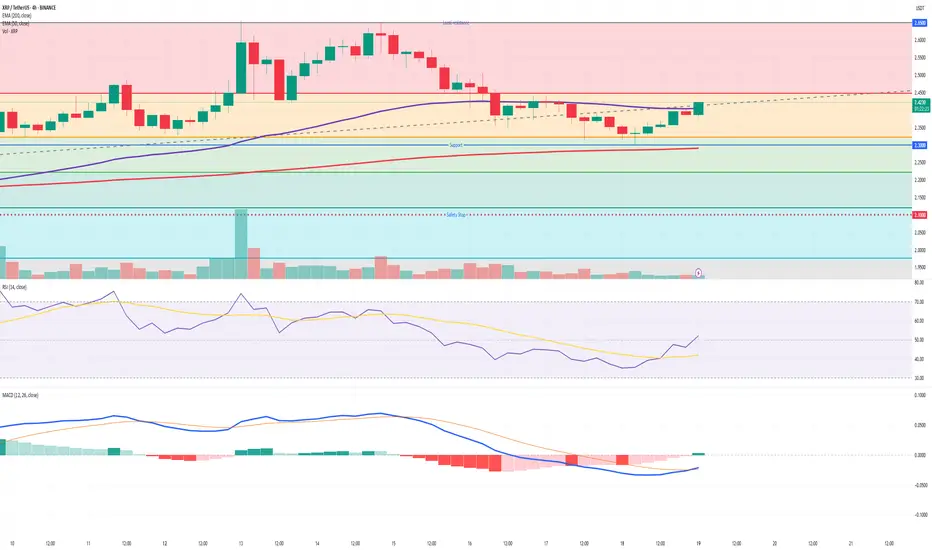
2025.05.18 RIPPLE Short-term long positionWe are the SeoVereign Trading Team.
With sharp insight and precise analysis, we regularly share trading ideas on Bitcoin and other major assets—always guided by structure, sentiment, and momentum.
🔔 Follow us to never miss a market update.
📈 Ripple (XRP) Long Position Strategy
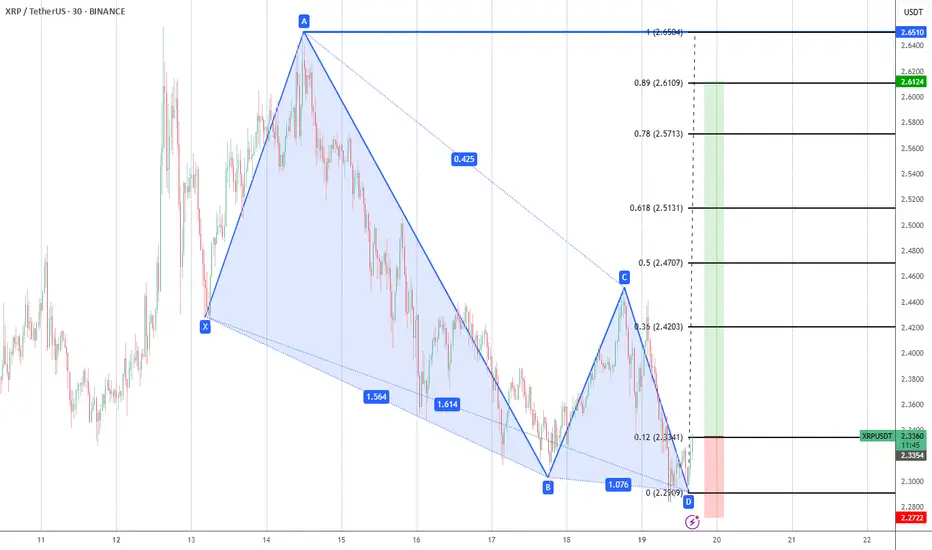
Currently, XRP appears to have completed a 5-wave structure with an ending diagonal pattern in the final wave. Notably, Wave 3 respected the 1.272 extension of Wave 1 with precision, adding confidence to the Elliott Wave count. This setup typically suggests a trend exhaustion, followed by a potential move higher after a corrective phase.
✅ Entry Strategy
Enter long after confirmation of support in the current correction zone.
Stop-loss should be placed tightly below the invalidation level of the structure.
🎯 Target Levels
1st Target: $2.42 — Breakout above the diagonal resistance
2nd Target: $2.47 — Retest of previous high resistance
3rd Target: $2.51 — Potential completion of the extended move
🔍 Technical Notes
MACD is attempting a bullish crossover after forming higher lows
RSI is recovering after exiting the overbought zone
Volume is tightening, suggesting a strong move may follow on breakout