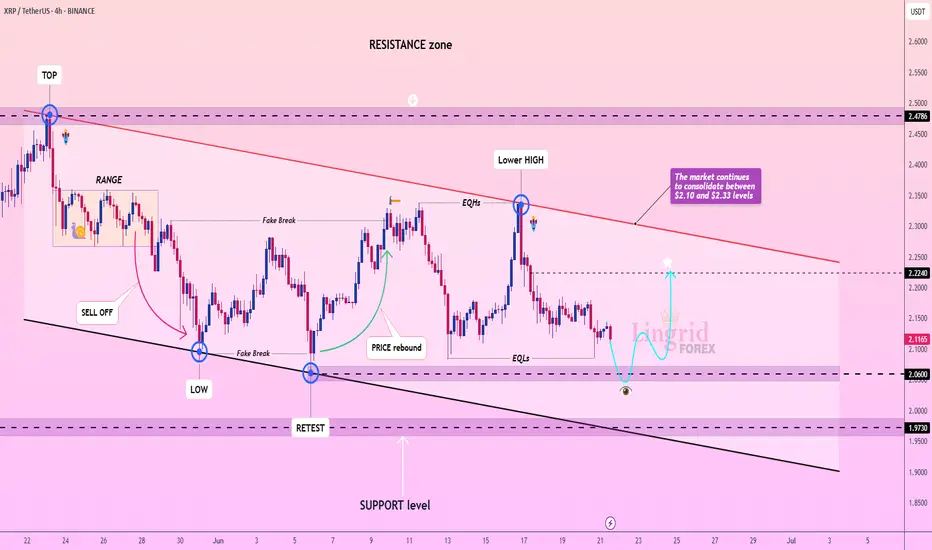
Lingrid | XRPUSDT sideways MOVEMENT ContinuesBINANCE:XRPUSDT is consolidating within a defined horizontal channel, currently sitting just above the 2.06 support after multiple fake breaks and failed attempts at a higher high. A bullish rebound from this zone could launch price back toward the descending resistance trendline. The 2.2240 level
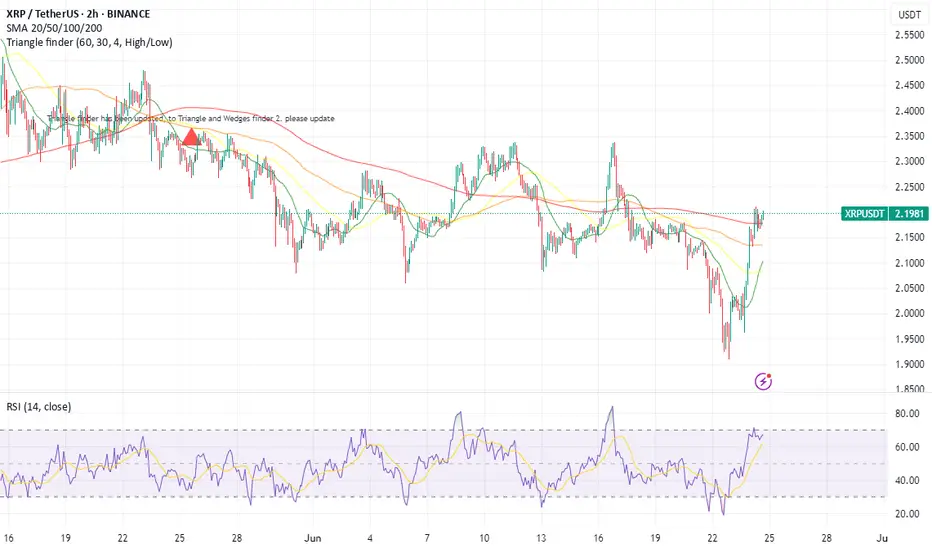
Ripple (XRP): Seeing Smaller Bullish Movement To AccumilateRipple coin has extended itself heavily since november but what we noticed is how close the 200EMA line on the daily timeframe has come to the market price, which is our main point of interest as of now.
More in-depth info is in the video—enjoy!
Swallow Academy

XRP Price Soars Past $2.15: Next Stop $2.38? XRP Price Prediction: What’s Next After Breaking $2.15 Resistance?
Ripple’s XRP has been making waves in the cryptocurrency market, recently breaking above the critical $2.15 resistance level and surging nearly 8% in the last 24 hours to trade at $2.18. With a further 9% climb in recent sessions an
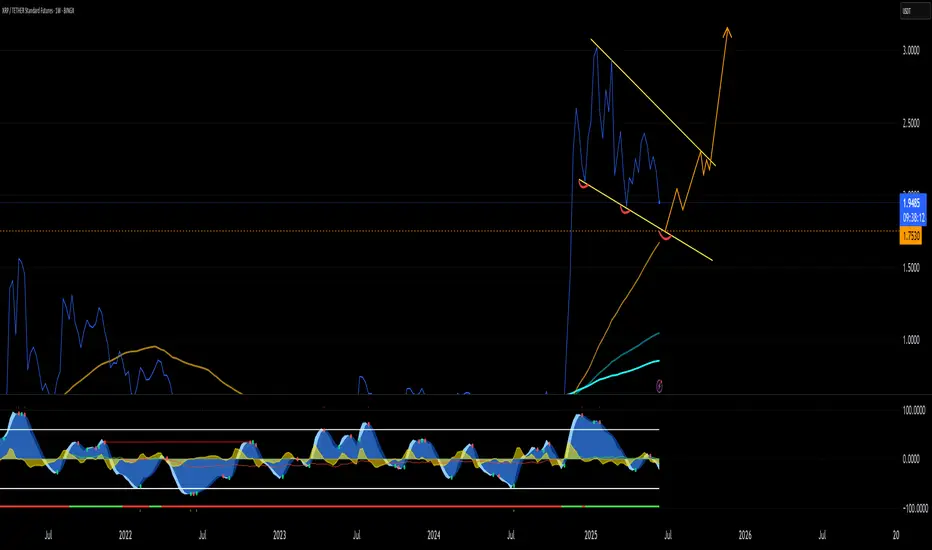
XRP 3 Line Drive and Bull FlagXRP about to make 2 major chart patterns for a bullish move to $5 range. 3 Line drive and trendline hit on a bull flag.
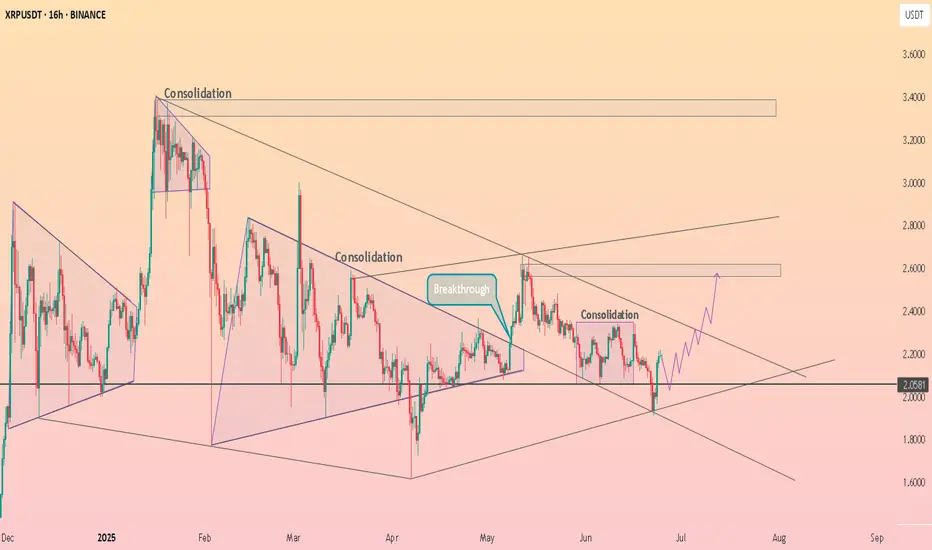
HolderStat┆XRPUSD held the supportBINANCE:XRPUSDT on the 16h chart is showing strength above $2.05 after breaking out from consolidation. The path is clear toward $2.30 and $2.60 as buyers regain control. The bullish pattern sequence continues to develop.
XRPUSDT Has Breakout down channel bullish strong from bullish obXRPUSDT BREAKOUT ALERT!
4H Timeframe Analysis
XRP has officially broken out of its downward channel, confirming a strong bullish reversal from the key demand zone at 2.1600, where major buy orders were stacked. Momentum is building fast! 💥
🎯 Technical Targets Ahead:
🔹 1st Target: 2.3370 – Suppl

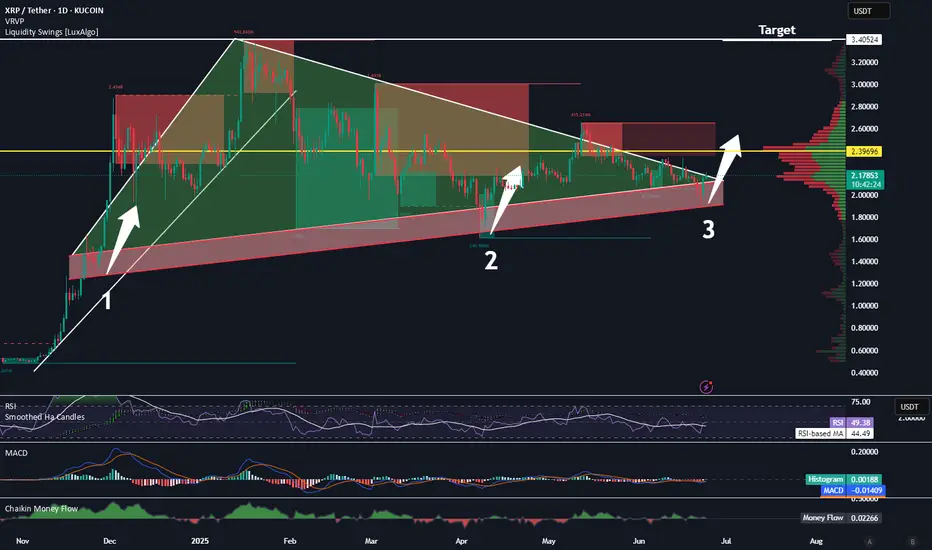
XRP About to Break Out! 3.40 Target.Trading Fam,
It's really this simple. This is a bullish triangle. Three hits in the premium buy zone (bottom of the triangle) and we're done. Once we break, there will be some resistance at that VRVP PoC (2.39) and then we're gone. 3.40 is an easy target.
Stew
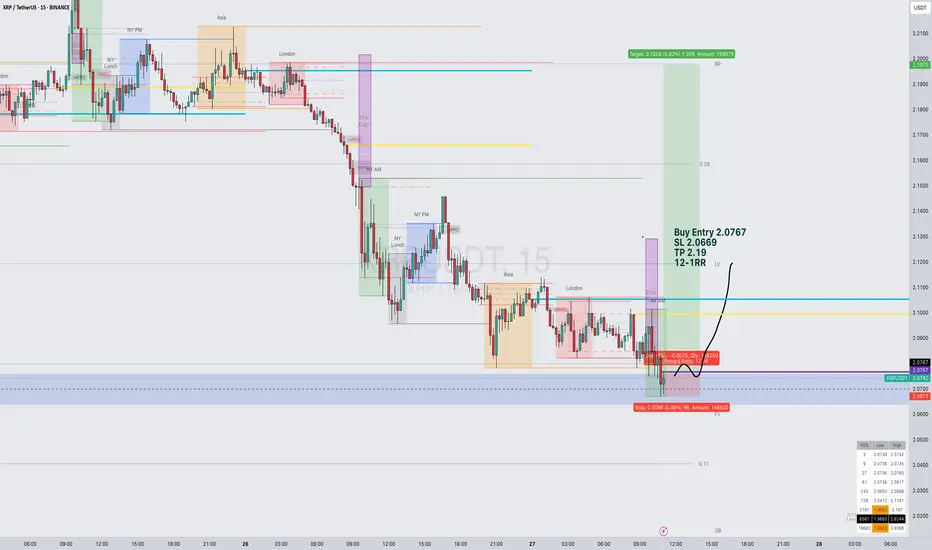
Pair: XRP/USDTSession: NY Open
Framework: Smart Money Concepts x Goldbach Precision
Swept the Asia Low — textbook liquidity grab.
Price retraced perfectly into a Goldbach Fair Value Gap (FVG) following the sweep, aligning beautifully with Smart Money logic.
This setup confirms internal liquidity was cleared and
$XRPUSDT 6h Chart. $XRP/USDT 6H chart shows a clean breakout above the descending trendline, followed by a successful retest at the key demand zone.
This confluence suggests bullish momentum is building up.
As long as price holds above the $2.1023 support, the setup points toward a potential 17% upside move target

Your Liquidation can be Exchanges Business & Profit Ever feel like the market is designed to move against you ?
That your stop-loss is a magnet for price action?
What if it’s not just in your head? Behind every liquidation wave lies a structure and maybe even a strategy.
In this post, we dive deep into how exchanges might be benefiting from y

See all ideas
Summarizing what the indicators are suggesting.
Oscillators
Neutral
SellBuy
Strong sellStrong buy
Strong sellSellNeutralBuyStrong buy
Oscillators
Neutral
SellBuy
Strong sellStrong buy
Strong sellSellNeutralBuyStrong buy
Summary
Neutral
SellBuy
Strong sellStrong buy
Strong sellSellNeutralBuyStrong buy
Summary
Neutral
SellBuy
Strong sellStrong buy
Strong sellSellNeutralBuyStrong buy
Summary
Neutral
SellBuy
Strong sellStrong buy
Strong sellSellNeutralBuyStrong buy
Moving Averages
Neutral
SellBuy
Strong sellStrong buy
Strong sellSellNeutralBuyStrong buy
Moving Averages
Neutral
SellBuy
Strong sellStrong buy
Strong sellSellNeutralBuyStrong buy
Displays a symbol's price movements over previous years to identify recurring trends.