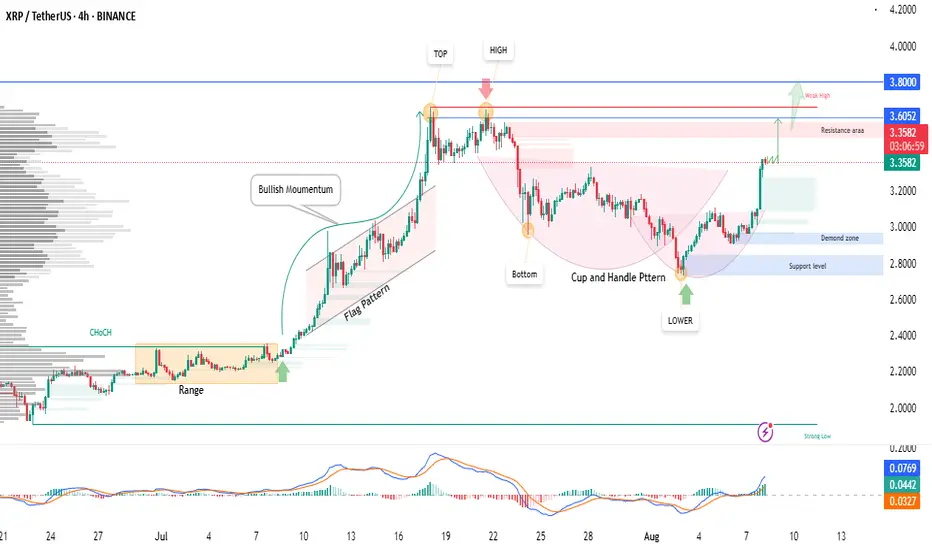
XRPUSDT–Cup & Handle Breakout Targeting $3.80|Bullish Momentum XRPUSDT is showing strong bullish momentum after forming a clean Cup & Handle pattern on the 4H chart.
Key observations:
Pattern Formation: Cup & Handle breakout in progress, signaling continuation of the uptrend.
Demand Zone: Strong buying interest from the $2.80 – $3.00 support area.
Resistance Levels: Watching $3.6052 as the first key level; breakout above could push price towards $3.80.
Market Structure: Higher highs and higher lows intact, with a recent Change of Character (CHoCH) flipping to bullish.
MACD: Positive crossover confirming upward momentum.
📈 Bullish Scenario: A sustained close above $3.6052 could trigger an extended rally to $3.80 and beyond.
⚠ Invalidation: A close back below $3.00 support may delay the bullish move.
XRPUSDT.P trade ideas
XRP - FUTURES SIGNALXRP - FUTURES SIGNAL
Coin: XRP
Direction: LONG
🟢Input range: market
✔️ТР: 3.0088/3.0580/3.1047
❌SL: 2.8975
We open a long trade according to the trend, after reaching a correction of 0.5 according to Fibonacci
XRY to 4.50 next weekthe case with the sec lines up with the cup and handle formation. it will pop after news gets out next Friday.

XRP and 200% proif After a 100% gain in the previous signal, Ripple has a target of more than 200% ahead, and with a good buy, you can make a great profit.
XRP : Will Ripple be pumped?Hello friends🙌
✅ considering the decline we had and the entire market, Ripple has also fallen like other currencies.
✅You can see that the price has hit resistance several times but failed to break it. Finally, in the last hit, which we also identified on the chart, the powerful price broke through the resistance.
✅Now, in the support area we identified on the chart, you can see that the price is supported by buyers and higher lows have been recorded.
✅Now that the price has pulled back and buyers have provided good support, you can buy in steps with risk and capital management and move with it to the specified goals.
🔥Follow us for more signals🔥
*Trade safely with us*

XRP may being its upward" Ripple (XRP) may begin its upward move from the price levels of 2.8865, 2.7984, and 2.6634, aiming for a first confirmed target at 3.6641 and then $4." BINANCE:XRPUSDT

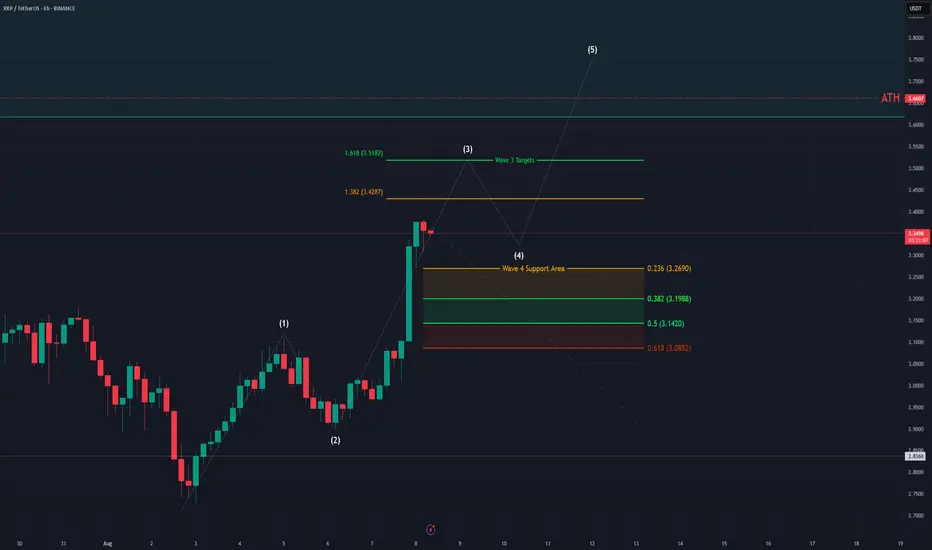
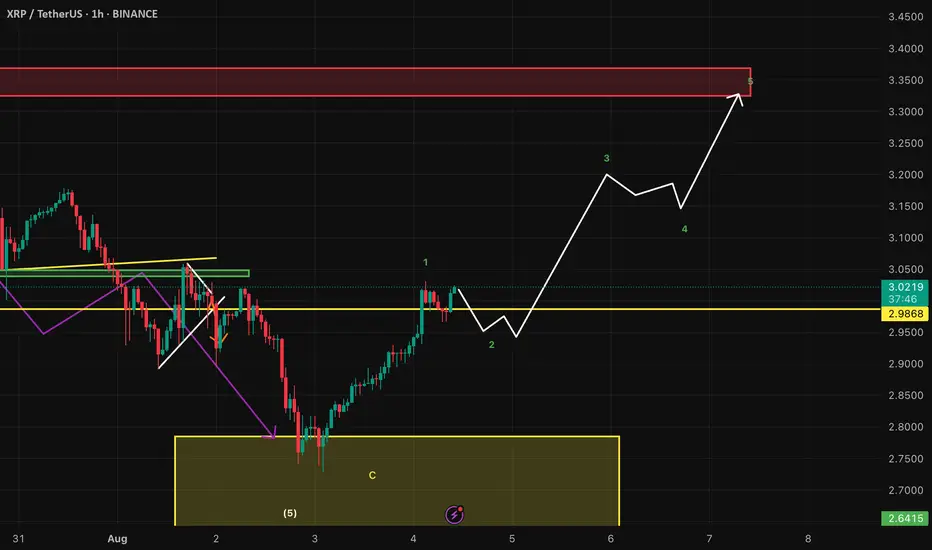
XRP - 4H Elliott Wave Analysis - 08.08.25Greetings, here's an Elliott Wave Count for the current price action of XRP.
We assumed we bottomed on the 3rd August and started a new impulse to the upside in the white 5 wave move of which we have finished Wave 1 and 2 and are working or have finished Wave 3.
We would prefer if the white Wave 3 goes a bit higher and hits at least it's 1.382 FIB target at 3.4287 USD or even better the 1.618 FIB at 3.5182 before we see white Wave 4.
We already added a provisional white Wave 4 support which sits between the 0.236 FIB at 3.2690 USD and the 0.5 FIB at 3.1420 USD. Going lower to the 0.618 FIB at 3.0852 USD would be a warning sign that we are not in this impulse.
Be aware the white Wave 4 support area move higher as the price climbs higher.
After we get white Wave 3 and 4 in we will be looking for white Wave 5 which should take us to new all time highs.
Thanks for reading.
NO FINANCIAL ADVICE.
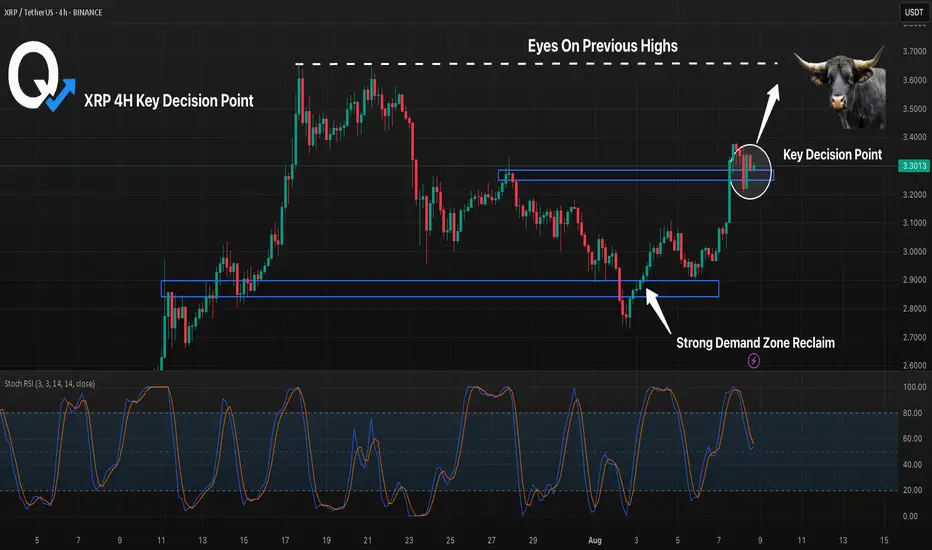
XRP 4H Key Decision Point, Will Resistance Flip Into Support?XRP has rallied strongly from the early August demand zone, reclaiming lost ground and pushing into a major resistance area near 3.30. Price is now stalling at this key decision point — a confirmed flip to support could spark continuation toward the next major highs, while rejection may trigger a retrace back toward the 3.05 zone. Both bulls and bears will be watching this level closely for the next move.
Ask ChatGPT
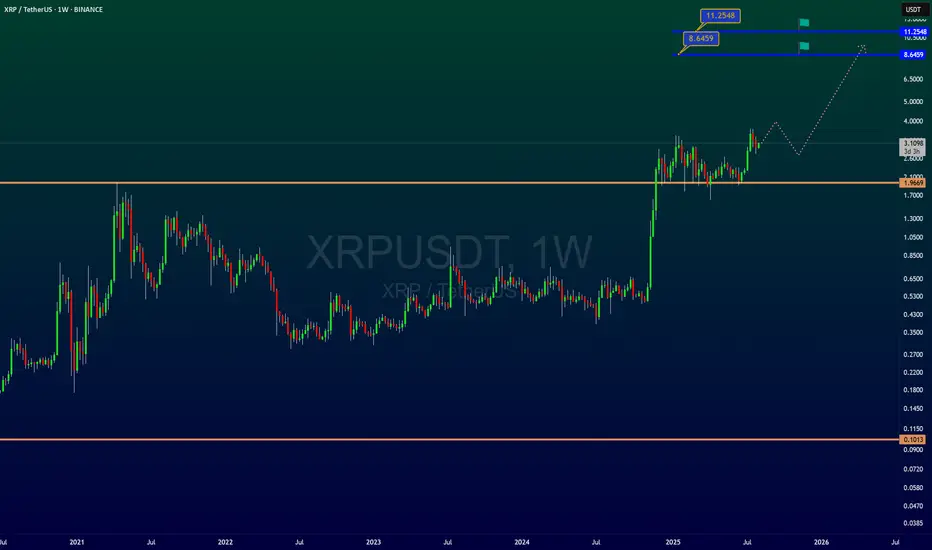
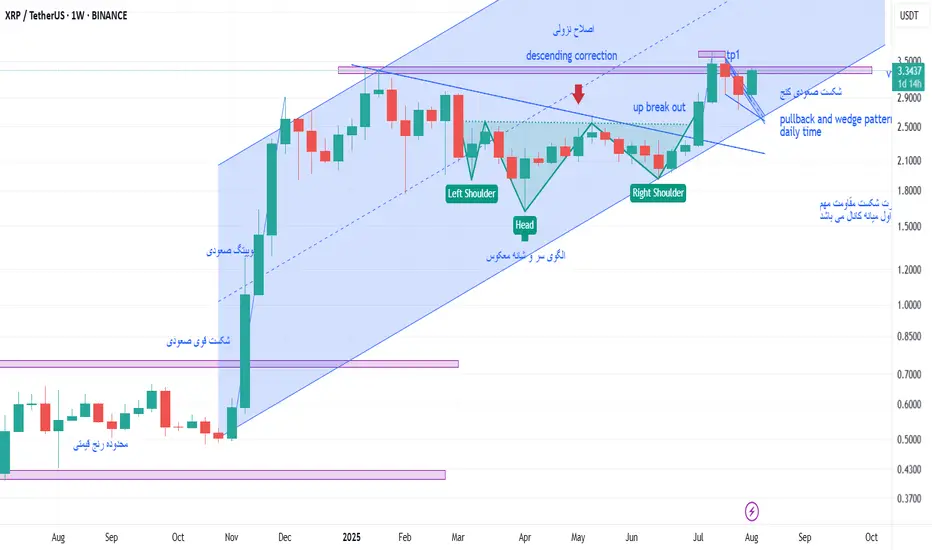
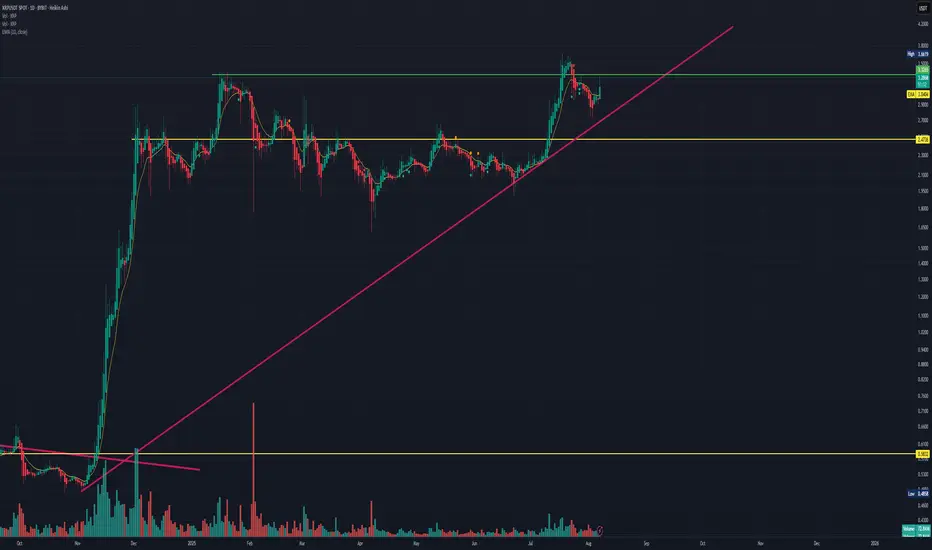
xrp weekly chartas we see total trend is ascending
tips :
1 after a midterm descending corretive trend it formed a head and soulder pattern which with macd positive divergence was a signal for the the end of correction
2 : by 7 july candle which is a strong ascending one the descending trend line was broken up and the buy signal was presented.
3 : when price reached to the vital static resistance made by candle 20 jan 2025 it stoped and formed a wedge pattern which is obvius on daily chart ,
4 : then we witness that the price broke up the wedge and now it is testing the static resistance level .
if it can break up that static resistance level I believe the first target price will be channel midline.
so we are waiting for closing weekly candle and starting new one , and for better decision we should control daily chart .
thank you
XRP 1H – Major Resistance Hit, But Can Bulls Break Through?XRP surged into the 3.32–3.34 resistance zone after a sharp vertical rally, bringing price directly into a key decision point. This level has acted as a rejection zone before, making it crucial for bulls to clear for further upside momentum.
If price breaks and holds above this resistance, the move could extend toward the mid-3.4s. However, a rejection here may lead to a retest of the mid-level support near 3.06, with deeper pullbacks targeting the 2.90 key support zone.
Key watchpoints:
– 3.32–3.34 resistance for potential breakout
– Mid-level support at 3.06 if rejection occurs
– Stoch RSI overbought, suggesting possible short-term cooldown

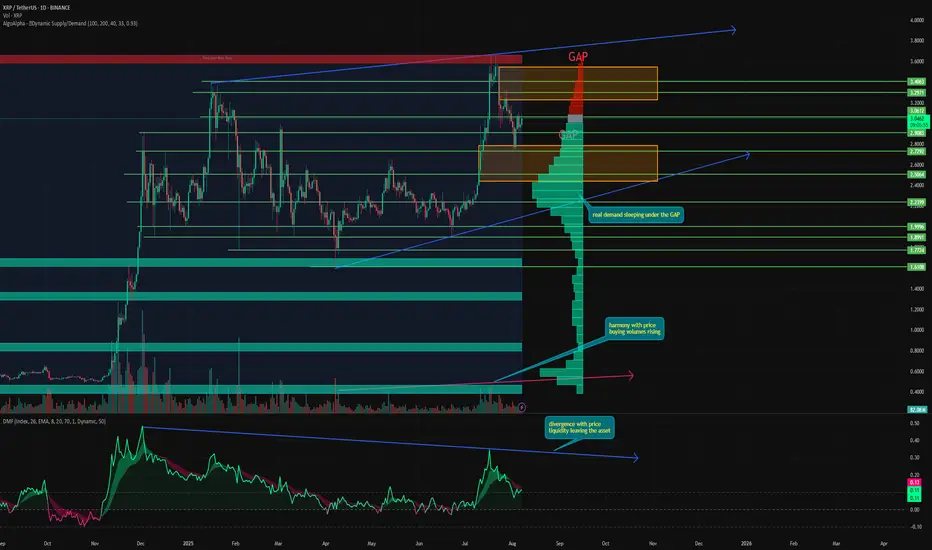
Is XRP setting up to update its ATH?A lot has changed since my last review of XRP, and it's time to take a look at why I'm so bullish now:
➡️ First, two gaps have formed during the growth: from below at $2.78 - 2.44 and from above at $3.54 - 3.23. And the price is currently heading to close the upper gap.
➡️ Second, I am more than confident that the upper GAP will be closed first, as XRP is currently one of the only tokens on the entire market with harmony in purchase volumes. This means that since April, purchase volumes have continued to grow, showing increasing interest in the token even at this price.
➡️ Thirdly, yes, Money Flow shows a divergence with the price, and this ATH required much less liquidity than even the December one. However, the indicator has hardly ever dropped into the neutral zone during the year. This shows how quickly any drawdown is bought back and how many people are willing to buy.
➡️ Fourth, Dynamic Supply Demand shows that there is currently huge demand concentrated at the bottom and virtually no supply above. Particularly notable is the huge cluster of demand below the GAP, from the $2.5 level, which is also a strong psychological level.
📌 Conclusion:
XRP looks incredibly strong right now, and even if it corrects after the new ATH, closing the lower GAP, such huge demand will almost instantly buy back all the decline, and we can expect a rebound higher.
So right now, for me, XRP is one of the most promising coins for trading LTF.
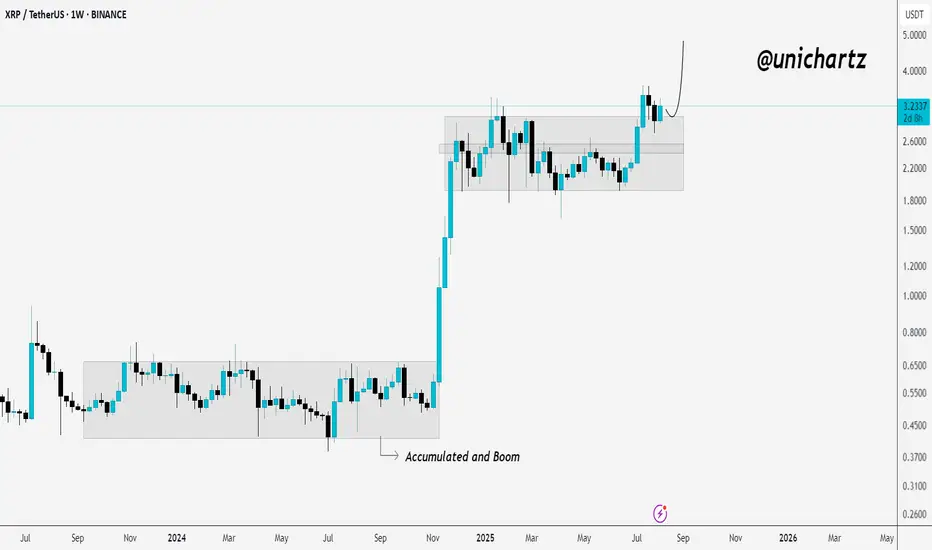
From Accumulation to Acceleration – XRP Ready to RunCRYPTOCAP:XRP has successfully retested the breakout level from its previous accumulation zone, showing strong bullish momentum.
After spending months consolidating in a tight range, price finally broke out with a sharp rally. The recent pullback found support right at the top of the old range, a classic breakout retest, and buyers stepped back in.
This retest confirms the breakout’s strength and could set the stage for the next leg up, with bulls now eyeing higher targets as long as price holds above the former resistance zone.
DYOR, NFA
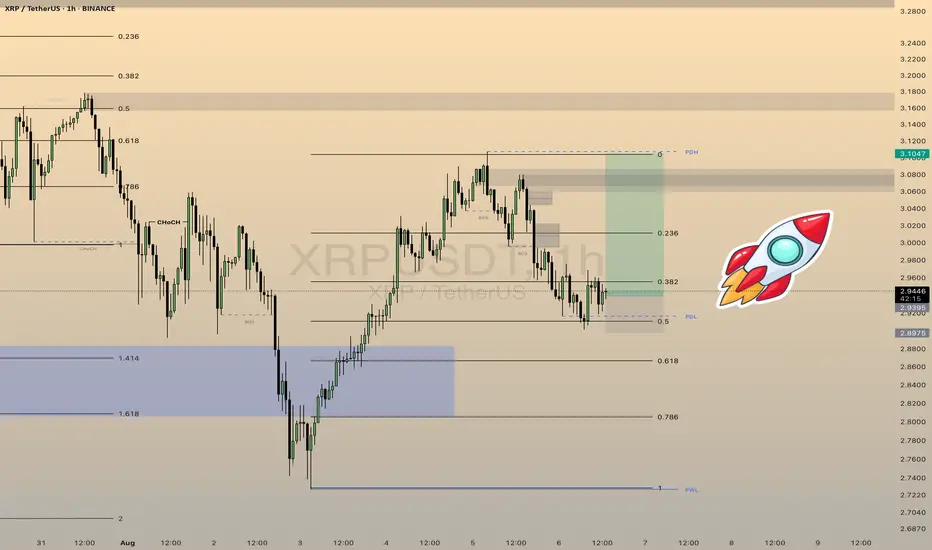
XRP 4H – Precision Bounce from Golden Pocket After All-Time HighXRP just executed a perfect technical pullback — retracing into the golden pocket (0.618 Fib) after hitting its all-time high. The 4H chart shows textbook structure: a breakout, clean Fibonacci retracement, and an instant reaction from key levels.
📍 0.786 (2.28) marked the original breakout
📍 0.618 (2.58) triggered an aggressive bounce
📍 0.5 (2.79) saw instant rejection on the rebound
📍 All-time high resistance still looms above ~$3.75
What makes this setup especially clean is how XRP respected each Fib level like a playbook — reacting on the dot while Stoch RSI reset completely and flipped upward.
This could be the beginning of a bullish continuation… if we reclaim the mid-range and break above $3.30–$3.50 cleanly.
Until then, this is prime territory for range-bound volatility.
How are you playing it: swing long, short fade, or watching for confirmation?
👇 Drop your setup below.

The Great XRP Escape Plan: Thief Strategy Deployed🌀 XRP/USDT – Thief Trader’s Master Heist Plan: Crack the Vault Before They Catch On! 🧠💰
🔐💸 Operation Code: Ripple Raid 3.9 - Eyes on the Prize, Hands on the Trigger 💥
🌍 Attention Global Market Robbers and Strategic Money Movers!
This ain't just another analysis—this is the Thief Trading Style Blueprint, surgically designed for the XRP/USDT Crypto Market. Whether you're a silent sniper or full-squad raider, this trade setup is your next high-voltage money heist.
🔍 Market Breakdown:
📊 Technical + Fundamental = Robbery Precision
Currently, Ripple (XRP) is showing bullish fuel—charging into our trap-the-bears zone. Volatility is tightening, resistance is trembling, and it smells like liquidity is about to get stolen.
⚠️ Warning: The market’s at a risky cross-zone – overbought with heavy consolidation – where big bears and trapped traders usually play defense. That’s exactly where we strike.
🔓 Entry Gameplan – “Wait, Trigger, Execute”
📈 Entry:
"The heist begins when the candle breaks the high and screams confirmation!"
Set Buy Stop Orders above the recent resistance (around 3.1000).
Alternatively, use Buy Limit Orders on pullbacks at key swing levels (15M or 30M timeframes).
We use a multi-layered entry strategy (aka DCA + stacking like a pro thief stacking vaults). Be surgical. Be patient.
📌 Pro Tip: Always set a chart alert at the trigger zone to avoid missing the breakout party.
🛑 Stop Loss – “Breakout First, Then Talk Safety”
🚫 NO SL BEFORE BREAKOUT. Period.
Once price breaks out, then:
🔐 SL = Nearest 4H candle wick swing low (around 2.8000).
But remember, your SL = your risk appetite.
Whether you're placing 1 big order or 10 mini traps, manage it smart.
🎯 Target – "Get Rich, Then Vanish"
🏴☠️ Primary Take Profit Zone:
Target: 3.9000
Or exit anytime you see signs of reversal.
Don't get greedy—get paid.
👀 Scalpers’ Note:
Only play the Long side.
If you're deep-pocketed, dive in straight. If not, ride with swing traders and trail your SL to protect profits.
🔥 Why This Trade is 🔐:
📈 Current price structure, liquidity zones, and momentum favor bulls.
📊 Correlated intermarket signals + on-chain activity + macro backdrop align with XRP strength.
🧠 Smart money accumulation is visible – this is your window before the big breakout.
🚨 News & Position Management Alert:
📢 Stay clear of opening trades during major news events.
Use Trailing Stop-Loss on running positions to lock gains while letting profits fly.
This is not hype. This is precision.
Thief Trader doesn’t guess – we plan, we trigger, we exit.
📌 Final Words:
Whether you're scalping seconds or swinging for days – follow the blueprint. XRP has a vault to crack, and we’re here to rob it clean.
Now go out there, set those traps, and let the market pay you like it owes you.
🧠💸🕶️ Next Heist Plan Coming Soon… Stay Sharp.

XRPUSD LongWe just finished the 5th wave as exspected and allready started the 1st wave of the next bullish move. I will wait for a correction and enter a long position.
This XRP Chart Screams Bullish – Target $3.66?XRP has been carving out a potential reversal after a deep correction from the $3.66 high. The price found strong support near the $2.72–$2.73 region — an area that acted as a launchpad during the July rally. That zone held firmly through multiple retests, suggesting solid buyer interest.
Now, price action is printing higher lows while gradually reclaiming structure. The recent reaction off support confirms a shift in momentum, with bulls stepping back in. The mid-range resistance at $3.06 is currently capping upside, but pressure is building for a breakout.
Sellers attempted to defend that level multiple times but failed to push price lower, which hints at absorption. A clean 4H candle close above $3.06 could be the ignition point for the next impulsive move.
Here’s the trade setup:
📌 Entry – On breakout and retest of $3.06
📌 Stop Loss – Below $2.85 (beneath support zone and higher low)
📌 Target 1 – $3.30 (partial profit)
📌 Target 2 – $3.66 (full target)
📌 Risk-to-Reward – Approx. 2.8R
While the full move aims for a retest of the highs, it's important to mature gains partially at $3.30 to lock in profits. This protects your capital and gives you flexibility in case momentum fades or price consolidates below resistance.
On the structure side, the recent wave sequence and price compression hint at the early formation of a bullish continuation pattern — possibly an inverse head & shoulders or ascending triangle. Either would confirm bullish strength if neckline/resistance at $3.06 is broken convincingly.
The broader sentiment supports a move higher, but don’t ignore short-term volatility around resistance zones. Risk management remains key — let the chart validate your thesis, and trail your stop once price moves toward $3.30.

XRP $XRP #XRP #LONG #bullish - Case DroppedTechnical break out was just under $3
News that the case is over and the turn in the market is driving the pump. A break above resistance at $3.30 will see this go higher towards the $4
Do your own research, take care of your emotional and financial capital.
xrpXRP is trading at a bigger resistance zone with a current inner context that could lead to a break to the upside rt tool 3.0 tg @wealthtransferclub

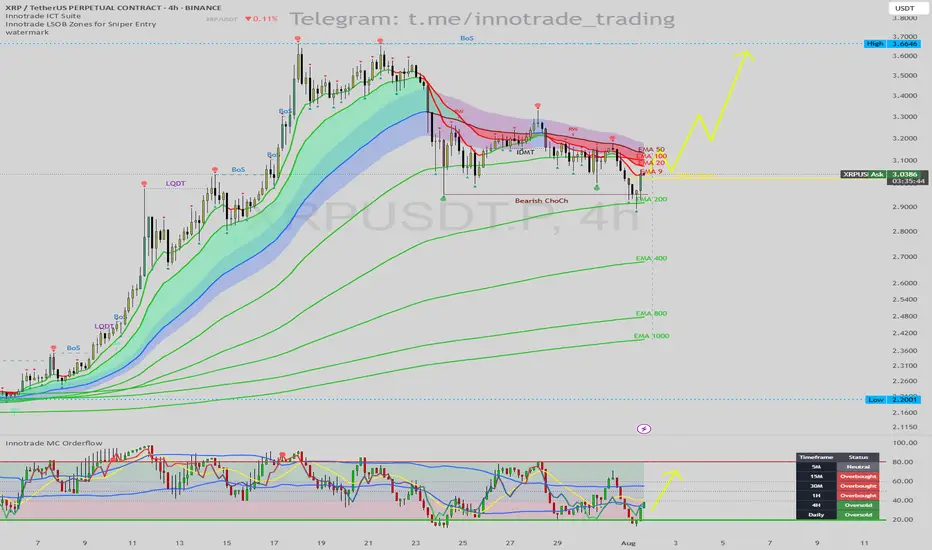
XRP/USDT: Bullish Reversal Setup at EMA 200 & Daily OversoldHello traders,
I'm seeing a compelling long setup forming on the XRP/USDT 4H chart. While the immediate trend has been bearish, multiple key indicators are now signaling that a significant bounce or reversal is highly probable.
1. Trend & Context (The "Why")
After a strong uptrend, the price has experienced a pullback, confirmed by a Bearish Change of Character (ChoCh). However, the price has now reached a critical support level where we can look for long opportunities.
Key Price Action Support: The price is currently finding support directly on the EMA 200. This is a major long-term moving average that frequently acts as a strong floor for price during a pullback.
Momentum Exhaustion Signal: The Innotrade MC Orderflow oscillator is giving a powerful confirmation for a potential bottom:
The oscillator is deep in the OVERSOLD zone (below 20), indicating that selling pressure is exhausted.
CRITICAL MTF CONFLUENCE: The Multi-Timeframe Cycle Table is the key to this trade. It shows that both the 4H and Daily timeframes are "Oversold". When higher timeframes like the Daily show exhaustion, it significantly increases the probability of a strong reversal on lower timeframes.
2. Entry, Stop Loss, and Targets (The "How")
This setup provides a clear, high-probability trade plan with a good risk-to-reward ratio.
Entry: An entry around the current price ($3.03 - $3.05) is viable as we are at the EMA 200 support. For a more conservative entry, wait for the MC Orderflow oscillator to cross back above its yellow MA.
Stop Loss (SL): $2.89. This places the stop loss safely below the recent swing low and the EMA 200. A break below this level would invalidate the bullish thesis.
Take Profit (TP) Targets:
TP1: $3.25 (Targeting the cluster of short-term EMAs and the recent swing highs).
TP2: $3.40 (The next logical area of resistance from the previous price structure).
TP3: $3.66 (The major swing high, a longer-term target if the bullish trend resumes).
Conclusion
This trade idea presents a strong case for a long position. The combination of a major technical support level (EMA 200) with a confirmed multi-timeframe momentum exhaustion signal (Daily Oversold) creates a high-probability environment for a bullish reversal.
Disclaimer: This is not financial advice. This analysis is for educational purposes only. Always conduct your own research and manage your risk appropriately.
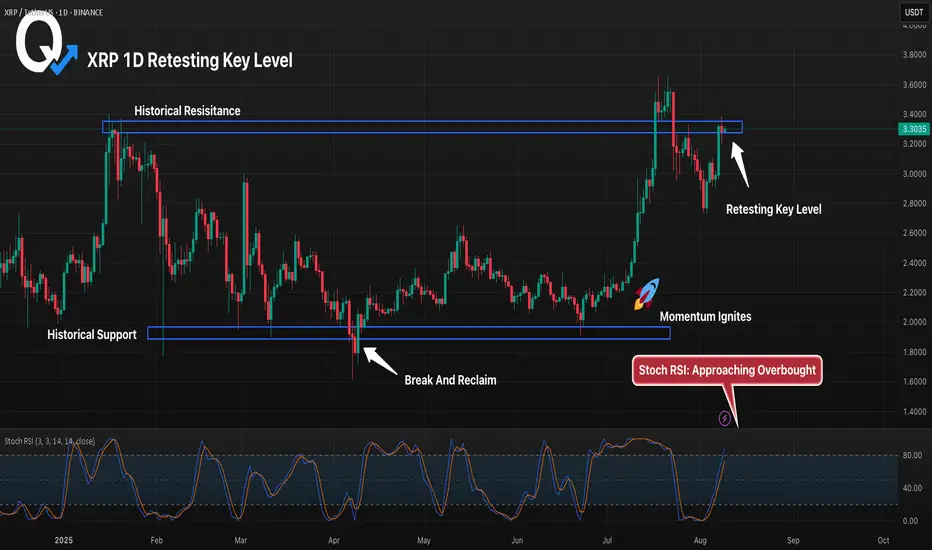
XRP 1D Retesting Key Level, Will Bulls Hold Above Historical ResXRP has broken and reclaimed a major historical support before rallying to retest the multi-year resistance near 3.30. Price is now pulling back into this zone, which will determine whether the breakout holds or fails. A successful retest could launch a push toward the July highs, while rejection here risks a drop back toward 3.07. Stoch RSI is nearing overbought, making this level even more critical for direction.
XRP go out from the wedge ┆ HolderStatKUCOIN:XRPUSDT faked a breakdown below 2.85 and is now recovering back into range. This aligns with previous bullish setups following consolidation. As long as the false break holds, price may attempt to move toward 3.40–3.50 again.

XRP/USD LOOOOONGS🔀 Varied risks vs rewards
Break of downward trend ⤴️
🐃 Bullish overall bias
XRP army aren't stopping here 🌙
1️⃣ Tightest is - 1% (3.29) / 3% (3.69)
2️⃣ Mid - 1% (3.18) / 5% (4.18)
3️⃣ Large - 1.5% (3.10) / 6% (4.8)
Lets see how we goes!!

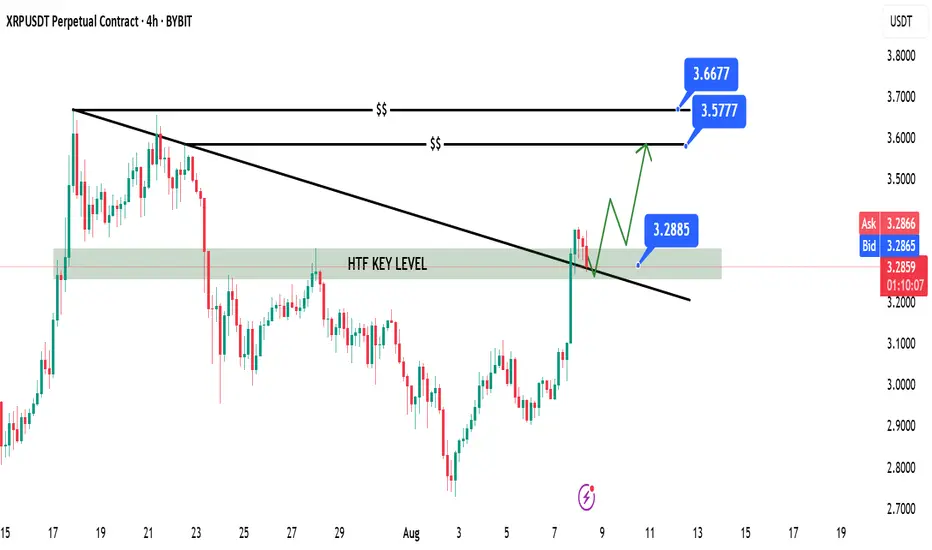
XRP | Ripple Game Plan - Swing Long Idea📊 Market Sentiment
Overall sentiment remains bullish, supported by expectations of a 0.25% rate cut in the upcoming FOMC meeting. The weakening USD and increased risk appetite across global markets are creating favorable conditions for further upside in crypto assets.
📈 Technical Analysis
Price broke the bearish trendline that had been driving the downtrend since July 18th.
A strong breakout and close above the trendline confirmed the move.
The breakout area also aligns with a significant HTF key level, adding strength to this zone.
📌 Game Plan
Looking for a quick retest of the broken trendline and HTF key level before a rejection.
🎯 Setup Trigger
Confirmation will come from a clear 1H break of structure after the retest.
📋 Trade Management
Stoploss: Below the 1H swing structure that caused the break of structure
Targets: TP1: 3.57 | TP2: 3.66
Will trail stop aggressively to secure profits as the move develops.
💬 Like, follow, and comment if this breakdown supports your trading!
More setups and market insights coming soon — stay connected!