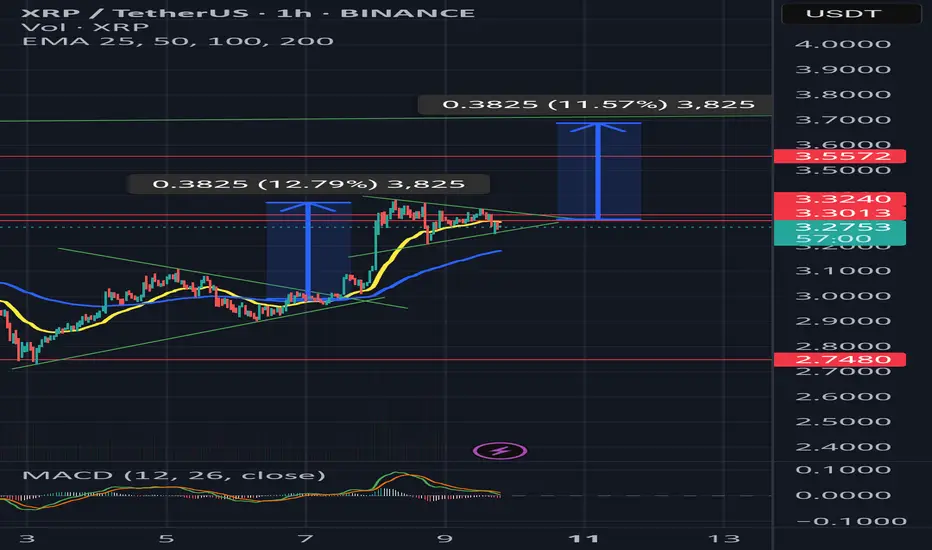
XRP 1H – Support Ladder Holding Strong Into Supply WallXRP continues to climb the support ladder on the 1H chart, forming a series of higher lows while building pressure against a well-defined supply zone around $3.15–$3.20. Each dip has been bought up quickly, with demand zones flipping into short-term support — a strong bullish signal in the short-term trend.
Momentum remains healthy, with Stoch RSI just turning back up from mid-range, suggesting there's still fuel left if the upper resistance breaks.
🔍 Key Highlights:
– Clear multi-step structure of higher lows and support retests
– $3.15–$3.20 has acted as major rejection twice — third test incoming
– Stoch RSI reset and turning upward = potential continuation
– Break above $3.20 could open up a move toward $3.50+
The key question now: Will bulls finally crack the wall, or will this zone continue to act as a ceiling?
👇 What’s your bias from here — breakout or fade?
XRPUSDT.P trade ideas

Bullish on XRPCurrently all eyes are on ETH, but XRP is doing the same thing. Its ultra strong (at least as strong as ETH), bullish on all timeframes, trading above major EMAs. Showed off a 10% growth since the EMA crossover. Now let it cool down a little bit and wait for a entry around 3.20$. From there we may catch the next leg up 3.90$.
For more trade ideas check and insights check our profile.
Disclamer: only entertaining purpose, no financial advice - trading is risky.

Still bullishMy overall bias for XRP is still bullish.
I have one major Fibonacci line in the daily chart that I have been using to analyse the price action.
The Fib line is drawn from Jan 25 high at $3.40 to April 25 low at $1.58.
XRP has been spending most of the last 18 months oscillating in this range.
In mid July 2025, the price finally broke above the range but it was short lived and started to retrace.
The price found a strong support at $2.73 where Fib 0.618. It is also a 50% retracement area from the recent high to recent low.
All momentum indicators are in the bull zone and plenty of scope to keep moving to the upside.
Causions:
Daily MACD lines haven't crossed to the upside.
The price has hit the major resistance line and is rolling to the downside in the lower time frame. It has failed to break above it.
All the bullish signals are there. However, it is such a major historical resistance area: it might consolidate and perhaps retrace to fill the fair value gap first before it starts to make a major move to the upside. (see 4H chart)

Is XRP doing it again?No need to complicate it, just look into it.
Will it reverse or what? Let's see.
XRP is accelerating ┆ HolderStatOKX:XRPUSDT snapped back above 3.20 after a corrective slide from the 3.65–3.70 supply band. Structure shows a strong leg up out of a large triangle base, a brief “pause,” then a channel‑style pullback that just broke to the upside. As long as the market holds 3.10–3.20, upside magnets are 3.35, 3.50 and the key cap at 3.66. A decisive close above 3.66 would validate a fresh trend leg; a loss of 3.10 would likely revisit 2.95–3.00 demand. Momentum favors continuation while higher lows stack above reclaimed trend support.

[SeoVereign] RIPPLE BEARISH Outlook – August 10, 2025In this idea, I would like to present a bearish outlook on Ripple.
There are three main reasons on which this perspective is based.
First, an arbitrary wave X forms a 1.272 ratio with another arbitrary wave X.
Second, a 1.414 BUTTERFLY pattern has formed.
Third, if the consistently formed trendline is broken to the downside, I believe the likelihood of Ripple’s decline will increase.
Accordingly, the average take-profit target has been set around 3.145 USDT.
Thank you very much for reading, and as time goes by and the chart becomes clearer, I will continue to update this idea accordingly.
Thank you.

XRP Market OverviewFor two weeks, price has followed our blue scenario perfectly. Currently, we're seeing clear selling pressure and now price below the key weekly reversal level at $3.
Key Expectations:
Primary Scenario: Downside continuation toward $2.72 support (potential new low)
Bullish Invalidation: Requires both:
Clear break above $3
Trendline breakout
Full analysis with chart annotations in this video idea
Markets respect levels until they don't - trade the confirmation, not the anticipation.

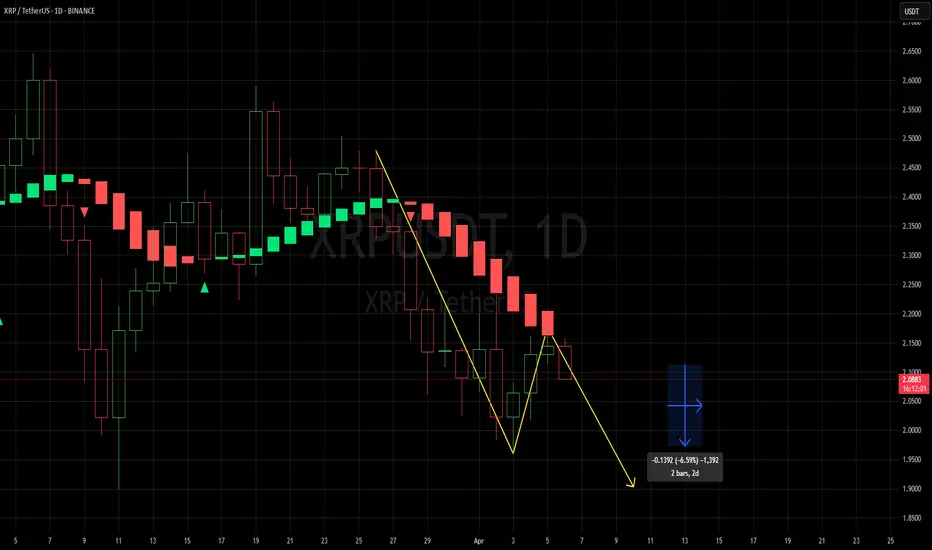
XRPUSDT Short Opportunity -6.58% TargetWe just bounced (convincingly) off the mean average price established over the last 10 days and we are currently accelerating further down as I write this. I am short this area, it has already moved into profit so I will trail this to it's conclusion.
I think there is a high degree of likelihood we retest the swing low of $1.95 based in the continuing trend on the 1D chart.
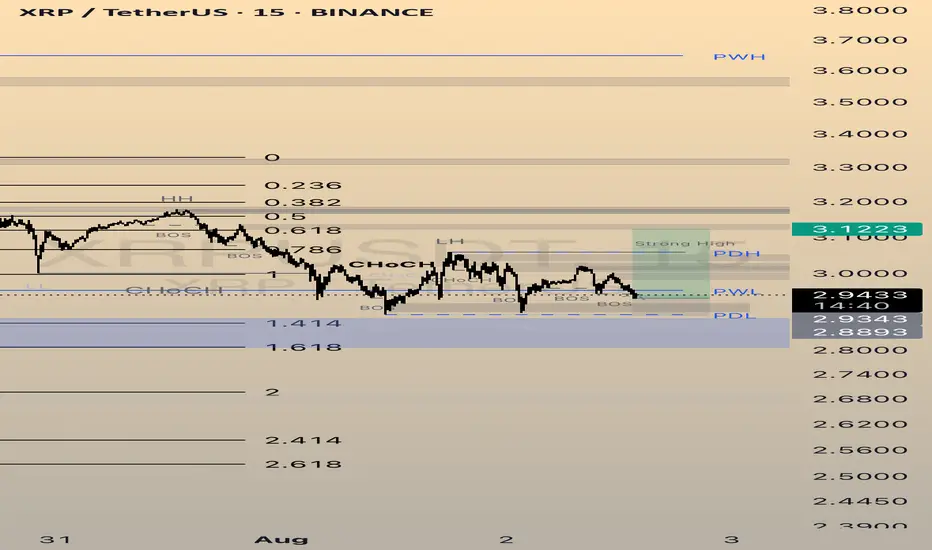
XRP - FUTURES SIGNALFUTURES SIGNAL
Coin: XRP
Direction: LONG
🟢Input range: 2,9358-2,9219
✔️ТР: 3,0116/3,0606/3,1223
❌SL: 2,8893
We try to carefully open a long position from the order block after the structure is broken on the 15-minute time frame. We enter at a reduced risk
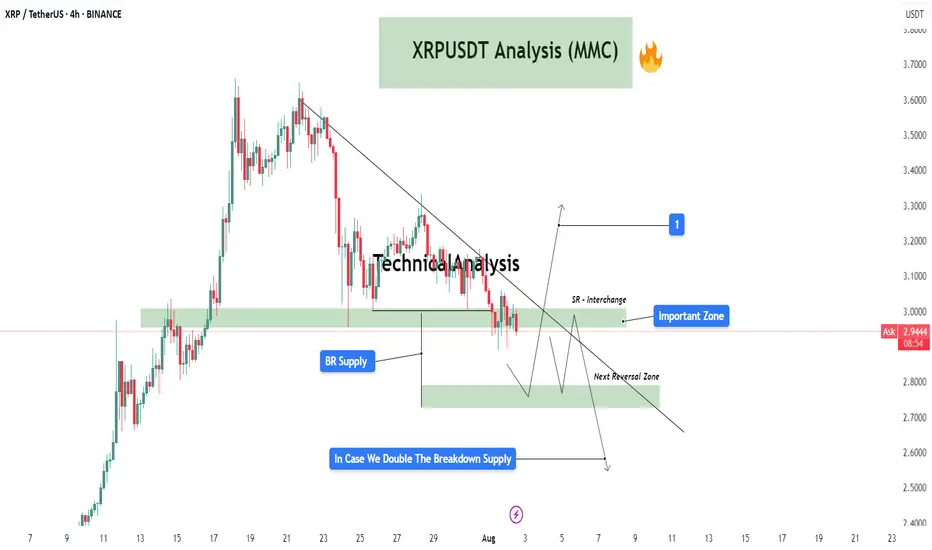
XRPUSDT Analysis (MMC) : Decision Point + Next Move Loading In this 4-hour chart of XRP/USDT, we're observing a critical structure forming under the Mirror Market Concepts (MMC) framework. Price action is compressing near an important descending trendline, suggesting that a breakout or breakdown is imminent. Let’s break it down zone by zone:
🔍 Key Zones & Price Structure:
Important Zone (SR Interchange Zone – $2.95 - $3.05)
This is a major supply-to-demand flip zone. It has served as both resistance and support in the past and is now acting as a potential interchange level. The price is hovering just below this area, retesting it after a significant bearish structure.
BR Supply Zone (Breakdown Retest Supply – $2.93 - $2.98)
After price broke down from this zone, it created a base for a retest. This level has since acted as a cap to further upside movement. It also coincides with the descending trendline, adding confluence to its strength as resistance.
Next Reversal Zone ($2.75 - $2.85)
In case the price fails to reclaim the Important Zone, we could see a bearish continuation move into the next zone of interest. This is a likely reversal or reaction area based on previous demand imprints and price imbalance.
SR Flip Watch
If price breaks above the trendline and sustains above the SR Interchange Zone, this could trigger a potential bullish breakout toward the $3.20+ region (labeled as target “1”). This move would be backed by trapped sellers and liquidity above the descending structure.
📈 Potential Scenarios:
✅ Bullish Case:
Break and close above the descending trendline.
Successful retest of the Important Zone as demand.
Push toward $3.20 - $3.30 where the next supply awaits (target 1).
❌ Bearish Case:
Rejection at the Important Zone and trendline resistance.
Breakdown below $2.90 confirms bearish pressure.
Possible liquidity sweep and reaction from the Next Reversal Zone ($2.75-$2.85).
If this zone fails to hold, continuation toward lower zones becomes likely.
🧠 MMC Perspective:
From a Mirror Market Concepts (MMC) standpoint, the market is currently at a reflection point where a decision between bulls and bears is about to play out. The clean diagonal structure plus clear horizontal liquidity pockets makes this setup ideal for anticipating manipulation traps and smart money moves.
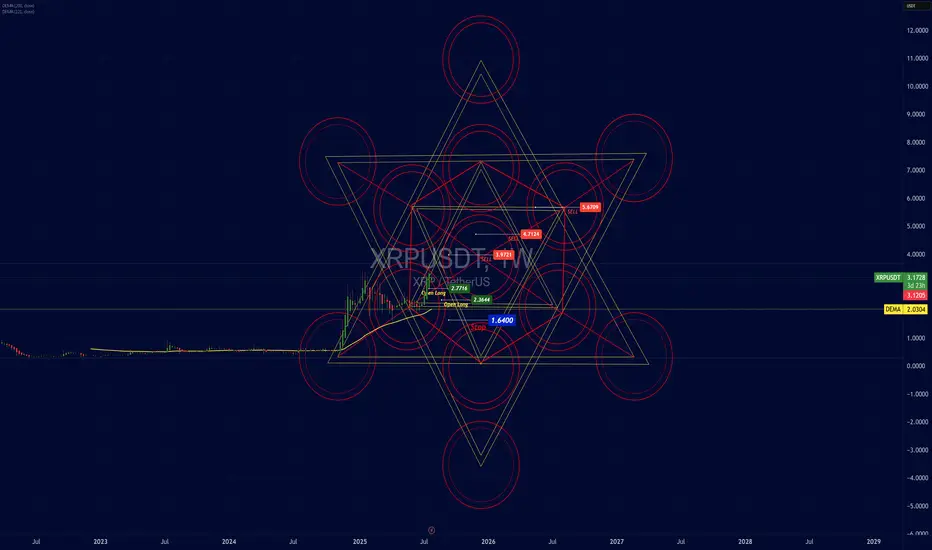
Analytical Geometry Strategy Applied to the Market — XRP/USDTAnalytical Geometry Strategy Applied to the Market — XRP/USDT
Position Trader: Action Based on the Structural Geometry of the Metatron's Cube
Operational Introduction
In medium to long-term strategic positioning (position trading), market entry must not be random or emotional — it must be grounded in predictable zones of symmetry and imbalance.
For that, we apply Analytical Geometry to chart structure, using the Metatron’s Cube — a three-dimensional geometric figure composed of 13 spheres and 78 interlinked vector lines.
The cube is a projection from a six-dimensional hyperplane onto the 2D Cartesian plane. Its application on the chart allows us to:
Delimit areas of vector confluence (support/resistance)
Identify angular energy zones and technical pressure points
Anticipate critical price inflection points based on mathematical symmetry
Structural Application on the XRP/USDT Chart
The projection of Metatron’s Cube onto the XRP/USDT chart reveals:
Entry points (Open Long) located at the lower inner vertices of the cube, where vectors converge toward the central axis — the liquidity attraction point
Supply zones (Sell) aligning with circular and angular intersections of the lines, where multiple vectors overlap — indicating movement saturation and possible redistribution
Stops placed below the angular base, representing a break in symmetry (the point where the vector loses cohesion with the model)
Structural Coordinates (Based on Vector Analysis)
Entry Points (Open Long):
Point A: (x = 2.6444, y = 0)
Point B: (x = 2.7176, y = 0)
Strategic Stop:
Point C: (x = 1.6400, y = -1), just below the lower angular base — a vector dispersion zone
Technical Targets (Supply Zones):
Level 1: x = 3.9721 (first circular layer)
Level 2: x = 4.7124 (72° expansion — common in golden ratio geometry)
Level 3: x = 5.6709 (structural exhaustion zone)
Technical Justification: Why Analytical Geometry Works
Analytical Geometry, developed by René Descartes, allows for the representation of curves, vectors, and spatial structures using numerical coordinates.
Metatron’s Cube functions as a vector mesh over the price chart — translating market behavior into a mathematical language of:
Proportions
Intersections
Angular projections
This approach enables us to:
Model price behavior as a multivariable function
Anticipate reaction zones based on angular and linear symmetry
Protect capital with stops anchored in vector-based rupture zones
Scientific Relevance
Metatron’s Cube is not merely symbolic — it remains actively used in modern physics and aerospace engineering.
At NASA, geometries derived from the Cube are applied to:
Orbital simulations
Spatial perimeter calculations on nonlinear geodesics
Angular mass distribution in interplanetary navigation systems
The same mathematical foundation used to understand celestial body dynamics is used here to identify repeatable behavior patterns in the market — with a high degree of precision.
Technical Conclusion
The market’s geometric structure is not random — it is vectorial, symmetrical, and proportional
Using Metatron’s Cube as a geometric projection allows for rational and coordinated alignment of entry, stop, and target points
The first target has already been validated, proving the structure’s effectiveness
The position remains active, with upper targets defined by vector intersections and angular saturation zones
Closing Insight
"The market’s geometry is the invisible code behind apparent movement. He who understands the vectors, masters the cycles."
This strategic model combines analytical geometry, energetic symmetry, and technical foundation in a unified framework — with precision, logic, and harmony.
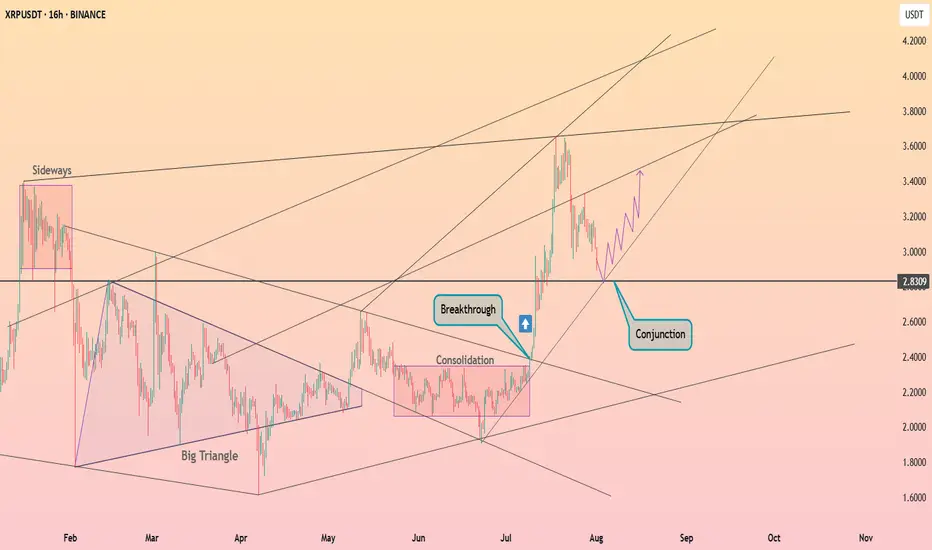
XRP continues to pullback ┆ HolderStatBINANCE:XRPUSDT surged above $2.83 after consolidating in a tight range. Price is now retesting the breakout zone at a key structural conjunction. If the level holds, a renewed move toward $3.40 may follow as bulls reclaim control.
XRP — Mapping Out the Next High-Probability Long SetupXRP continues to respect key levels, delivering clean setups and strong technical reactions.
📉 Recent Price Action Recap
After the flush from $3.65 into the $3.00 support zone, XRP printed a solid bounce back toward the $3.30 resistance area, forming a clean short setup between $3.30–$3.35.
Price is now trading mid-range within the 6-day consolidation.
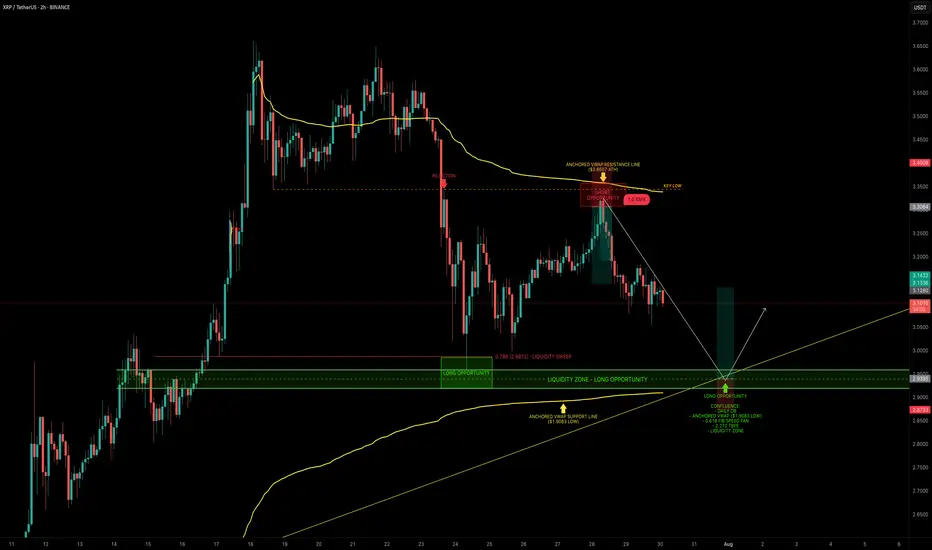
🟢 Next High-Probability Long Setup
A prime long opportunity lies between $2.96 and $2.9175 sitting within a key daily order block.
Confluence at this zone includes:
Liquidity pool just below the $2.9555 swing low
Anchored VWAP from the $1.9083 swing low resting just under the block
0.618 Fib Speed Fan lining up as dynamic support (July 30 – Aug 2)
2.272 Trend-Based Fib Extension at $2.9297
📈 Long Trade Setup
Entry Zone: $2.96 – $2.9175
Stop Loss: Below anchored VWAP (clear invalidation)
Target: $3.1/$3.13+
R:R: ~1:3+
💡 Educational Insight
This setup is a great example of how multiple tools layered together (like Fibonacci levels, VWAPs, order blocks and liquidity zones) can significantly increase the probability of a trade playing out.
When structure, volume-based tools and time alignment all point to the same area, it creates a high-confluence trade zone. These are the areas where risk is most defined and reward is most favourable, a principle every technical trader should anchor their strategy around.
_________________________________
💬 If you found this helpful, drop a like and comment!
Want breakdowns of other charts? Leave your requests below.
XRPUSDT → Range formation. Retest of resistanceBINANCE:XRPUSDT.P , after a false breakout of the daily resistance level of 3.352 and the elimination of traders, has entered a correction phase. The trading range shown below has been formed, with an emphasis on resistance...
XRP previously formed a false breakout of the daily resistance level of 3.352, as indicated in the idea above. After changing its market character, the price entered a correction phase. Focus on the range of 3.00 - 3.264. A retest of resistance (zone of interest and liquidity) is possible before falling to 3.161, 3.05 or to the liquidity zone of 3.00. There are no technical or fundamental reasons for exiting the consolidation; most likely, a retest of the zone of interest may end in manipulation and a pullback to support...
Resistance levels: 3.1609, 3.264, 3.352
Support levels: 3.05, 3.00
I do not rule out the fact that a retest of the 3.264 resistance level may have a breakout structure and the price will continue to rise, but based on the price behavior pattern on D1, the market structure, and market stagnation, I conclude that at the moment, the chances of seeing a correction from resistance are higher. Further developments will need to be considered after the retest of key zones on the chart...
Best regards, R. Linda!

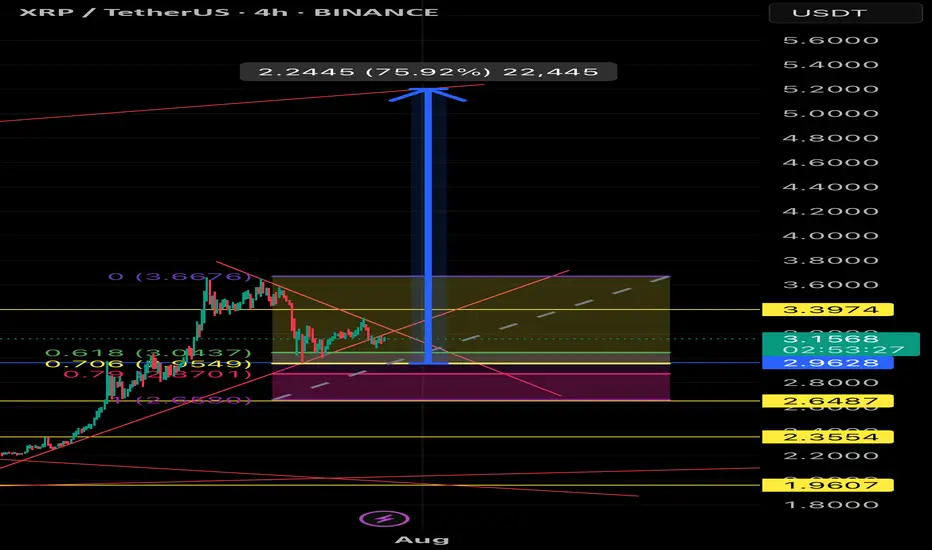
XRPUSDT Bullish Breakout Setup – 4H Chart, Fibonacci golden areaEntry: 3.16 (current level)
🛡️ Stop Loss: 2.9 (below range support)
🎯 Targets:
• TP1: 3.39 (local resistance)
• TP2: 4.50
• TP3: 5.40
• TP4: 5.90 (final target from wedge breakout – +75%)
🔍 Setup Details:
XRP is forming a bullish pennant after a strong rally. Price has held key Fibonacci retracement levels and is currently consolidating inside a wedge. A confirmed breakout could lead to a 75% move toward the $5.9 target. Volume confirmation and breakout candle close above $3.39 can accelerate the move.
⚠️ High volatility expected. Use proper risk management.
#XRPUSDT #CryptoAnalysis #Altcoins #TechnicalAnalysis #BreakoutAlert
XRP should be PumpedXRP pullback is ending. If the price does not break above $3, growth is likely go to 4$.


XRP 4H – Golden Pocket Bounce, But Will Bulls Reclaim $3.60?XRP pulled back cleanly into the golden pocket (0.618 Fib) after a strong rally — and buyers stepped in with force. Momentum flipped quickly, and Stochastic RSI is curling up with bullish intent.
Now price is holding above short-term support, but faces a key challenge:
→ $3.60 marks the prior high
→ Reclaiming that level would confirm bullish continuation
→ A rejection here would set up a lower high and shift structure bearish
This is a make-or-break moment for XRP in the short term. The golden pocket held — now the top of the range needs to flip.
#XRP #GoldenPocket #Fibonacci #CryptoAnalysis #StochasticRSI #LowerHighRisk #PriceAction #QuantTradingPro

XRP 1H – 21% Decline Off the HighAfter hitting a strong resistance near $3.75, XRP has been in a steady downtrend, losing over 20% from its peak. The chart shows clear lower highs and a strong descending resistance line capping every bounce. Price action remains bearish, but short-term momentum (via Stoch RSI) shows signs of being oversold — hinting at a potential relief bounce.
To flip bias, bulls would need a clean break of the trendline and reclaim the $3.15–$3.25 area. Until then, lower highs + sustained sell volume = caution for longs.
📌 20.6% decline
📌 Downtrend intact
📌 Momentum diverging — bounce or continuation?
This setup is primed for a mean-reversion or further breakdown — stay reactive, not predictive.

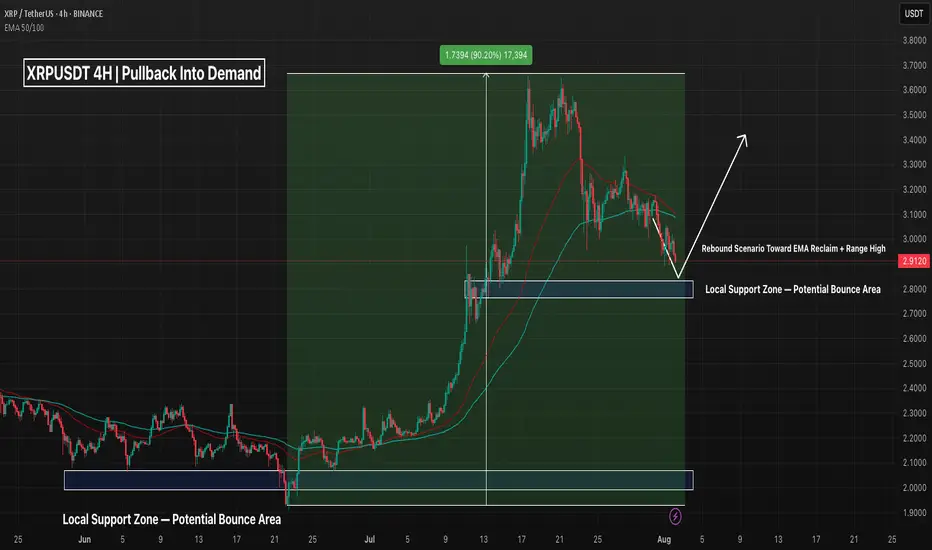
XRPUSDT 4H – Pullback Into Support, But Will This Bounce Stick?XRP has retraced nearly 25% off its local highs after a powerful +90% move in July. Price is now pulling back into a well-defined demand zone around 2.85–2.88, which previously triggered the breakout impulse.
📌 What’s notable:
Clean retest of demand + price hovering above the final bullish structure
EMAs are overhead, but not yet fully bearish — a reclaim could flip short-term bias
The lower demand zone (~2.15–2.25) still stands as a last line of defense from the original rally base
This bounce attempt is key — a strong push from here could send price back toward the $3.30–3.50 region. But if bulls fail to hold, there’s room for a deeper retracement.
Trade Planning Notes:
Aggressive Long: Entry on wick into support with tight invalidation
Conservative Long: Wait for EMA reclaim confirmation
Bearish Case: Breakdown = target $2.25 zone
The path from here decides whether this is a healthy pullback — or the start of a reversal. What’s your play? 👇
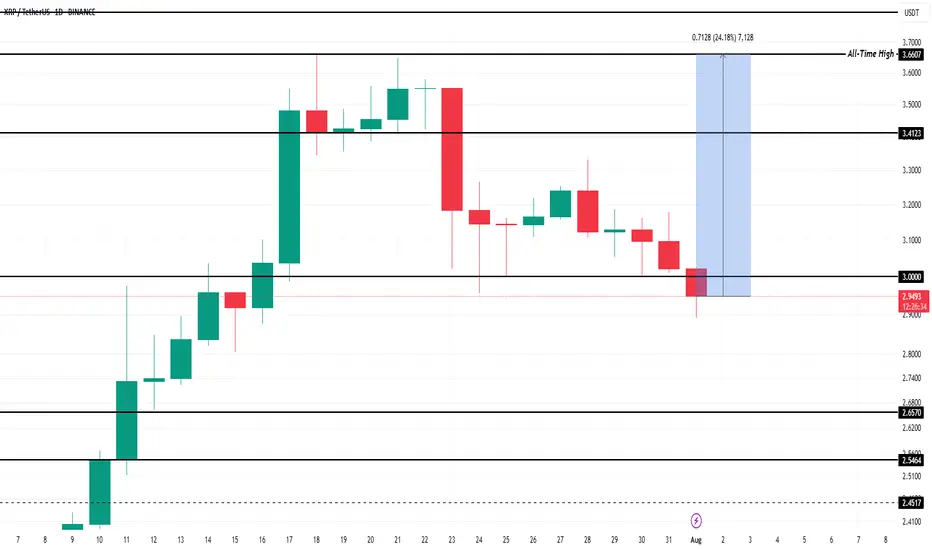
What To Expect From XRP In August 2025?Currently, BINANCE:XRPUSDT is trading at $2.99, slipping through the key support level of $3.00. While the altcoin is still over 22% away from its ATH of $3.66 , the foundation for potential growth remains strong. Historical data has shown that August typically brings bearish momentum for BINANCE:XRPUSDT , with median monthly returns of -6% .
However, given the strong buying activity observed recently and the positive technical indicators, this August might defy the usual trend. If BINANCE:XRPUSDT manages to secure support above $3.41, the altcoin could push towards its ATH once again . Alexis Sirkia, Captain at Yellow Network, discussed with BeInCrypto how XRP’s future could be looking like.
“Institutions that have been in the market for a while are gaining momentum. We're also, in the meanwhile, in a macro environment where funds are doing risk rotation… BINANCE:XRPUSDT is taking its stand with regulation and infrastructure, not hype. That's what will endure in the long run. Short-term flows are fleeting, but the groundwork laid today will define the cycle to follow.”
However, there’s a downside risk. If BINANCE:XRPUSDT fails to reclaim the $3.00 support, the price could fall to $2.65, invalidating the bullish thesis. A drop to this level would mark a four-week low and would likely lead to further selling pressure.
Sell From Supply Zone to a demand zoneUsing the S&D indicator, I'm looking to sell from the indicated Point of Interest to a previous lowm

XRP-Liquidity Sweep Incoming on XRP? Bulls May Be Loading Up! XRP 2H chart is shaping up a classic liquidity sweep play:
📉 Price hunting for sell-side liquidity around $2.90
💰 Equal lows = potential magnet for stop hunts
💎 Expectation: liquidity grab → displacement → aggressive reversal toward $3.65+
