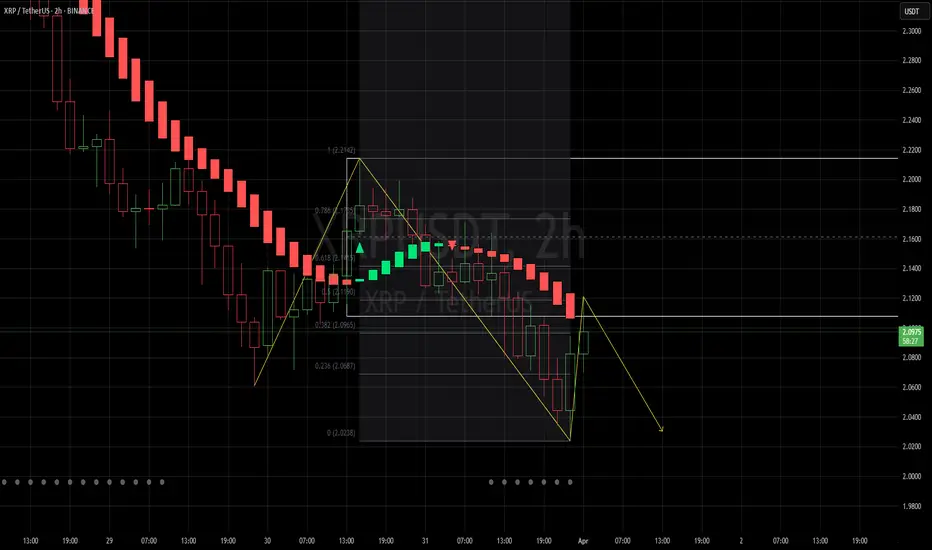
I am getting short here on XRPUSDTI just opened a short at $2.1085
I will add to my position if it goes up to $2.13
SL at $2.1412 currently
TL:DR is that I am using a smoothed Heikin Ashi candle with normal candles. But it acts as my EMA on the daily to set my bias, then I can go into the 1H charts and wait for a mean reversion to my EMA. Pretty simple. I set my stops once in profit using Fib retracements to just outside the 0.618 area to not get stopped out prematurely. Enjoy! My DOGE long is also doing quite well since I posted it id you like DOGEUSDT
XRPUSDT.P trade ideas
XRPUSDT - range projection Measures the possible price projection for XRP x0 . The large whale of over 1 billion in volume makes a good case that someone with smarts knows that this asset has a bright future. the platform where the exchange was made couldn't fill quick enough. Generally a whale or even a mini whale will be expecting to double their investment to take money off the table and that usually happens at the last resistance, so if the last solid resistance was a $ 3:00 you can expect a buy price of around $ 1:50...... anything lower than that is a bonus to stay on top of any possible draw down.

Perfect Wicoff pattern..XRP is showing this structure with clear volume confirmation, strong support/resistance reactions, and a spring phase — it would be considered a “perfect” Wyckoff accumulation pattern.

XRP MACD Liquidity Tracker Strategy – Clean Trend Catch (4H)This backtest showcases how the MACD Liquidity Tracker Strategy handled a major trend shift on XRP’s 4H chart. The long was triggered once MACD momentum aligned with the 60/220 EMA trend filters — clean confirmation without noise.
The system stayed with the move through a multi-day rally and exited as momentum began to fade. Visual bias (blue = long, pink = short) made trend context easy to follow, and the settings ensured no premature signals during consolidation.
📊 Strategy Inputs:
MACD: 25 / 60 / 220
Trend Filter: 60 & 220 EMA
System Type: Normal
A great example of how combining momentum + trend confirmation filters can remove second-guessing. This is Backtest Idea #1 in a 10-post strategy series.

XRP Bulls Returning We have seen XRP take some dips to 2.99 and reject strong. 3.00 support has been formed and we could see XRP moving to $4 this week if the higher low point is on the charts. Fundementals say that XRP banking is in a pending state, also rumor says that their Lawsuit will be dropped completely this week by SEC. Price action tells its all, we shall wait for come bullish hourly candles until we click the buy button

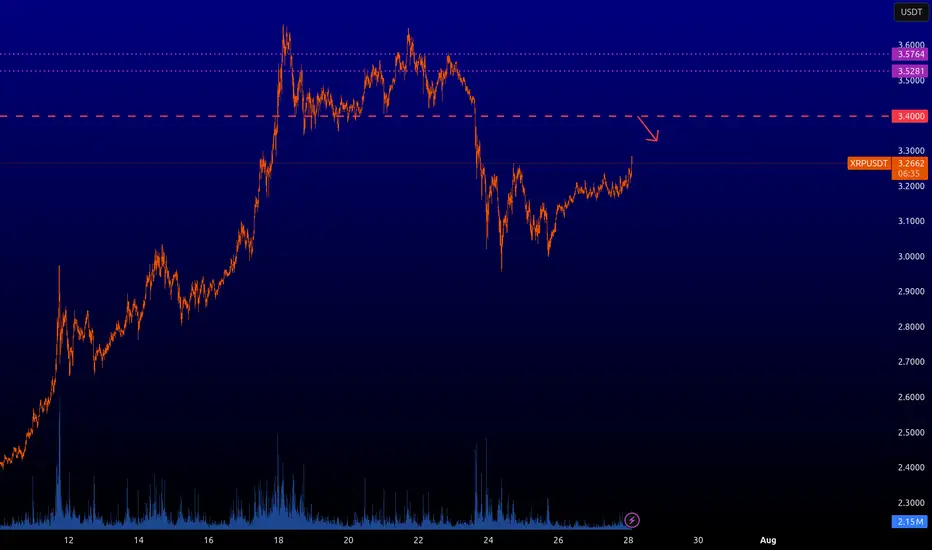
XRPUSD : Key levelsIt is possible to short from the red level with arrow, other levels are inactive for now.
Ripple (XRP): Seeing Smaller Bullish Movement To AccumilateRipple coin has extended itself heavily since november but what we noticed is how close the 200EMA line on the daily timeframe has come to the market price, which is our main point of interest as of now.
More in-depth info is in the video—enjoy!
Swallow Academy

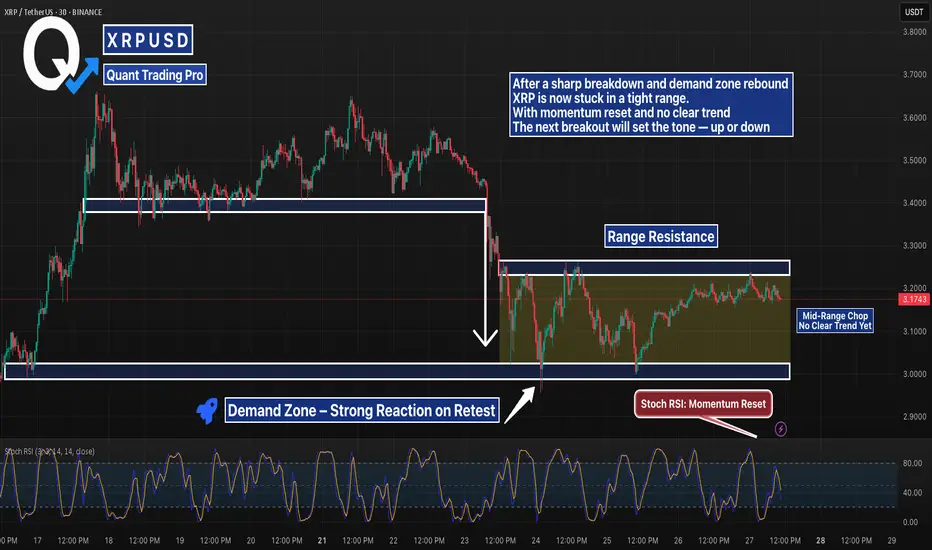
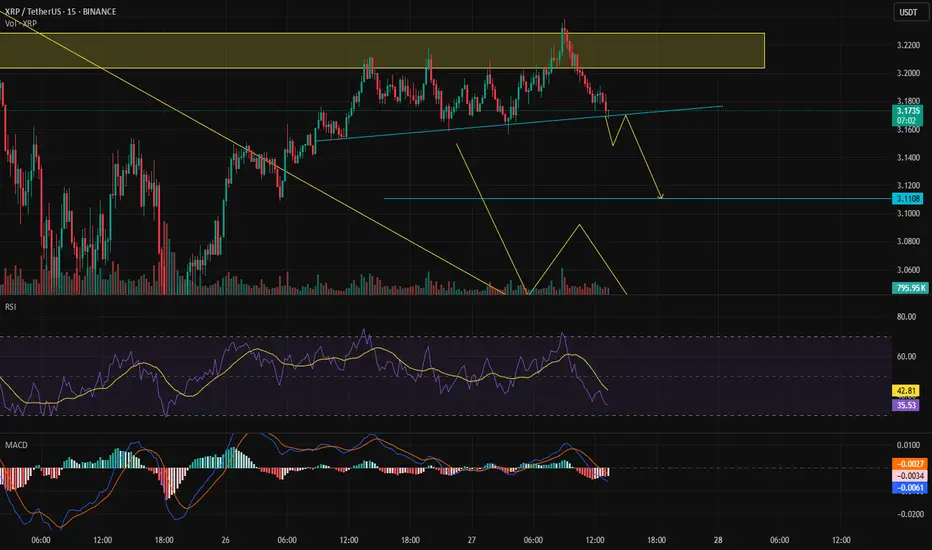
XRP Range-Bound After Breakdown — Compression Before Expansion?XRPUSDT 30m chart paints a neutral picture after a strong rejection from mid-range support last week. Price flushed into the $3.03 demand zone and bounced hard — but has since stalled and formed a tight sideways range between $3.03 and $3.25.
Momentum has reset (Stoch RSI near midline), and the market is clearly undecided. Structure currently favors neither bulls nor bears — and volume is thinning. Traders watching for a breakout from this compression box may catch the next directional move.
Key zones:
$3.25 = Range resistance
$3.03 = Demand zone
Mid-range chop = No-man’s land — best to wait for confirmation
Neutral bias until range breaks.
Short-term timeframeIn the short-term timeframe, a short position can be taken, and using a trailing stop, you can stay with the trend if it continues — it's worth the risk.
XRP prediction🔍 XRP/USDT Weekly Analysis
📊 Technical Overview:
• XRP recently broke out of a long-term descending trendline with strong bullish momentum.
• Key support zone now rests around $2.09 – previous resistance turned support.
• Price is currently consolidating around $3.18 after a strong impulse move.
🎯 Targets:
• First target:
🔸 $4.00 expected around November 2025
• Second target:
🔸 $4.80 expected around March 2026
These targets align with Fibonacci arc projections and historical resistance levels.
📈 Trend Strength:
• Breakout backed by strong volume suggests momentum is sustainable.
• If price holds above $2.94, bullish continuation is likely.
⚠️ Risk Levels:
• Losing support at $2.09 could invalidate the bullish setup and push price back to the lower range.

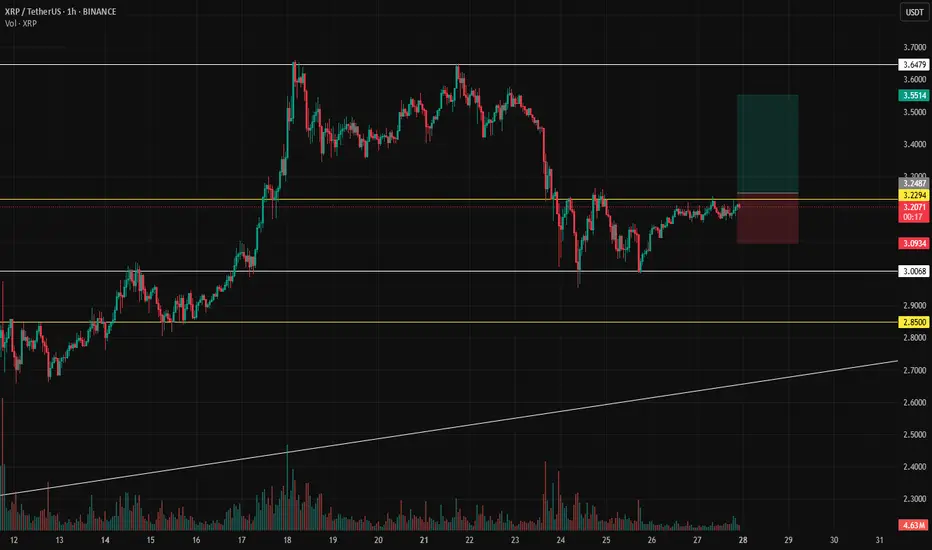
$XRP - Long Trade IdeaCRYPTOCAP:XRP | 1h
Possible retest of $3.24–3.26
If we see rejection, I'll look to enter around $3.12–3.09, targeting $3.35–3.47 (previous value area).
Stoploss set to $3.03-$3

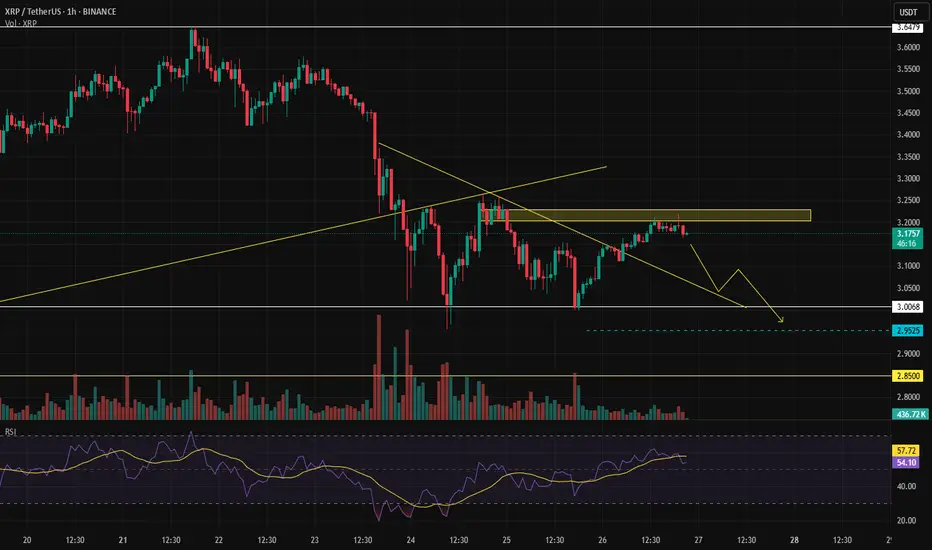
Breakout or pullback?Update on the previous analysis:
We had anticipated a pullback due to the lower high, and that view remains unchanged — unless buying volume increases and we manage to break through the resistance.
XRP | Full AnalysisHere is the full analysis for CRYPTOCAP:XRP as requested 🫡
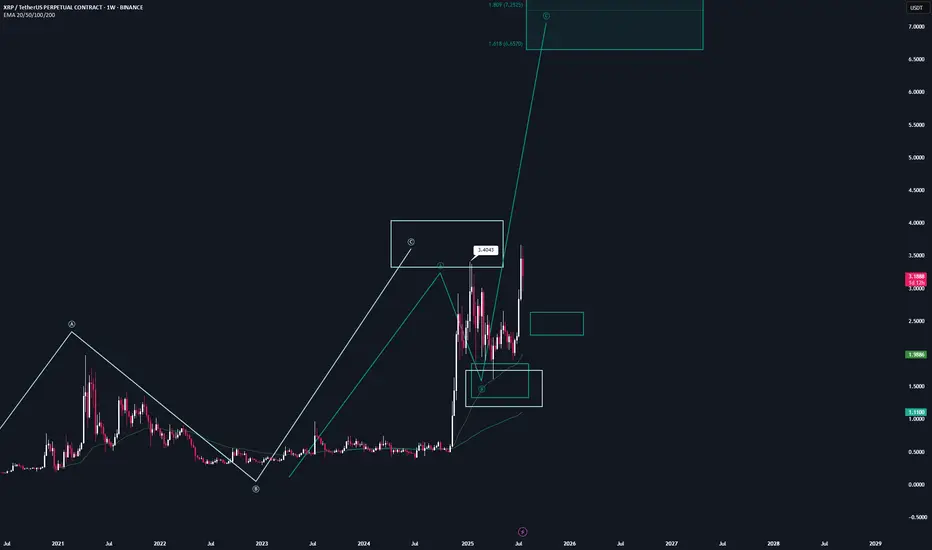
Let’s start with the weekly timeframe:
With the recent breakout above the $3.40 high, we’ve activated a new, larger bullish sequence on the weekly chart. This sequence has its target region between $6.57 and $7.84, which I believe we will reach at minimum during this bull run.
From now on, every pullback into the B-C correction area (turquoise) can be considered a legitimate re-entry opportunity.
Daily chart:
We successfully broke the all-time high with another breakout sequence (orange), which has already completed its target region.
Now, we’re trading the overall correction level — this is the same area as the B-C correction area from the weekly timeframe. It’s the Fibonacci retracement drawn from the start of the move to point C.
Local Price Action:
After reaching the target zone (orange), we activated a new bearish sequence in the upper region, which has just completed its target zone.
Now we expect a move back into the overall correction level (blue), and after that, according to the rulebook, the next legitimate U-turn could follow.
It gets really interesting if we enter the overall correction level and then start forming a bearish structure on the lower timeframes — this is where we can apply a multi-timeframe approach, which significantly increases the probability of a successful trade.
-----
Thats the my full Analysis for CRYPTOCAP:XRP , hope it was helpful if you want me to do another analysis for any other pair just comment down below.
Also, if anyone is interested in how my trading system works, let me know and I’ll post some educational content about it.
Thanks for reading❤️
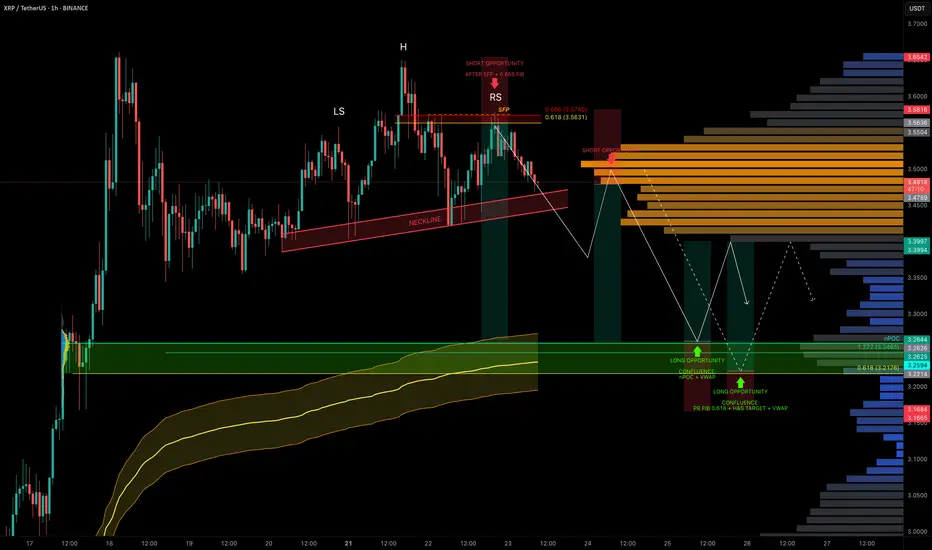
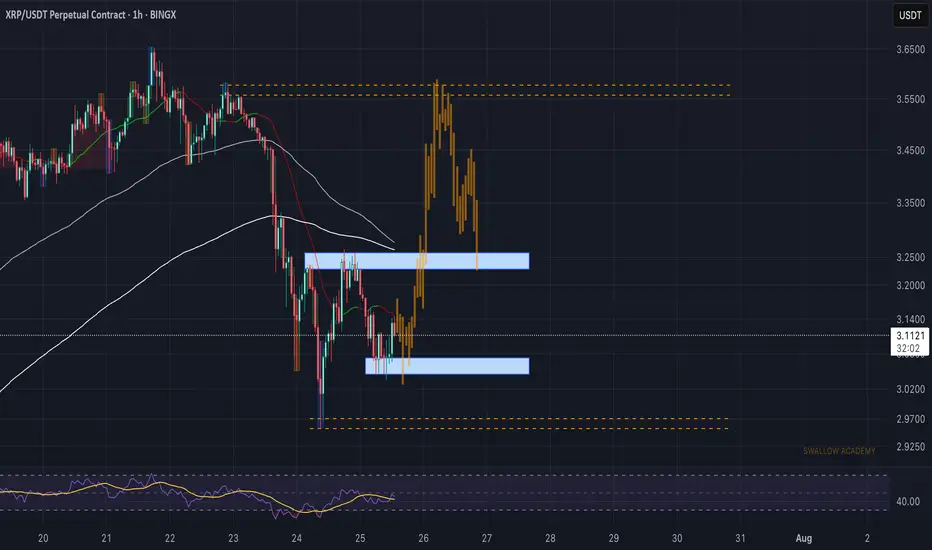
XRP Coiled in Range — Liquidity Below, Trade Setups AheadXRP has been stuck in a trading range around $3.50 for the past 5 days, offering multiple trade opportunities within the chop.
A notable short was triggered after a swing failure pattern (SFP) at the 0.666 fib retracement level near $3.563.
Now, with liquidity building to the downside, we’re watching closely for the next high-conviction setups.
🧩 Current Structure & Short Setup
🔴 Short Opportunity (Triggered):
SFP + 0.666 fib retracement at $3.563 led to rejection.
Market now shows a head & shoulders pattern forming.
Target: $3.2176 (0.618 fib retracement).
Trigger: Watch for a neckline break + retest for short confirmation.
Stop-loss: Above the right shoulder.
🟢 Long Setup:
Watching for a high-probability long around:
$3.26 → nPOC + 1.272 TBFE
$3.23 → anchored VWAP bands
This zone offers strong confluence and could act as the next launchpad.
Long Trade Plan:
Entry Zone: potential entries between $3.26–$3.22, price action needed for confirmation
Stop-loss: Below swing low at $3.1675
Target (TP): ~$3.40
✍️ Plan: Set alerts near the lows and react to price action at the zone — don’t front-run, let structure confirm.
💡 Pro Tip: Trade the Confluence, Not the Emotion
High-probability trades come from confluence, not guessing.
This setup combines nPOC, TBFE, VWAP, fib levels, and classical market structure (H&S) to map precise zones for both longs and shorts.
Let price come to you and wait for confirmation — especially in a rangebound environment where liquidity hunts are frequent.
Final Thoughts
We’re still rangebound, but liquidity is building below.
Keep an eye on the $3.26–$3.22 support zone for long entries and the H&S neckline for short breakdown confirmation.
_________________________________
💬 If you found this helpful, drop a like and comment!
Want breakdowns of other charts? Leave your requests below.
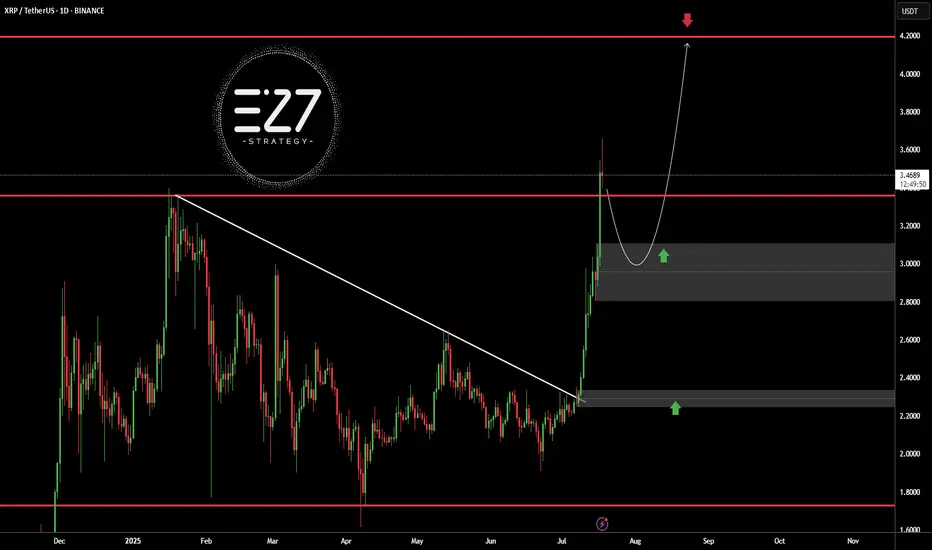
XRPUSDTBINANCE:XRPUSDT broke above its long-term downtrend line and surged to the $3.5000 resistance area, but is now undergoing a correction. The current bullish structure, with a higher high and higher low, suggests the trend remains upward. A pullback toward the $3.0000 demand zone is likely and would be a healthy retracement. Holding this area could trigger a continuation toward the key resistance at $4.2000.
Key Level Price
Main Support $2.2000
Main Resistance $4.2000
Best Buy Range $2.9500 – $3.1500
Best Sell Range $4.1000 – $4.2000
Investment Risk (Buying) Medium
⚠️Please control RISK management
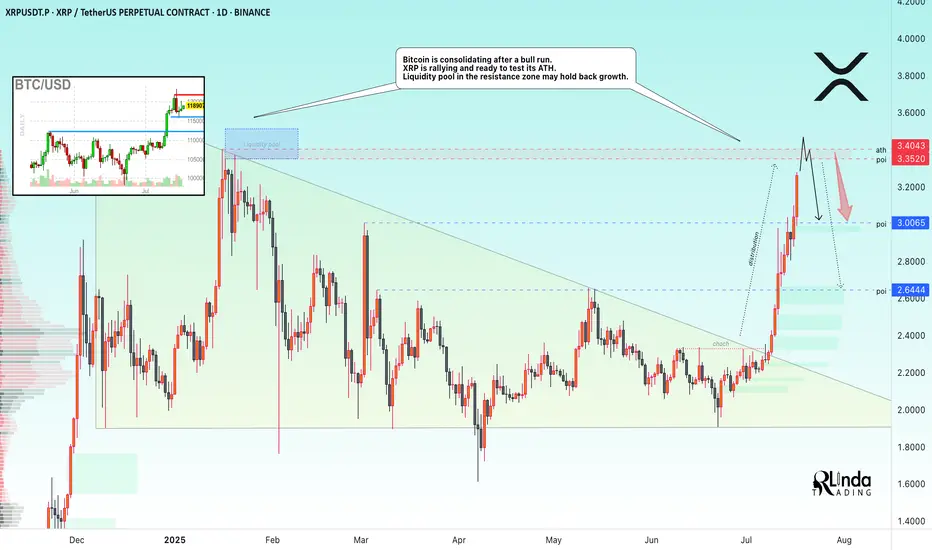
XRP → ATH retest. Reversal or continued growth?BINANCE:XRPUSDT.P is rallying and ready to test the resistance zone - ATH. Against this backdrop, Bitcoin is consolidating after a bull run. The liquidity pool may hold back growth.
Fundamentally, there is excitement across the entire cryptocurrency market. Altcoins are rallying after Bitcoin hit a new high and entered consolidation. The BTC.D index is declining, which generally provides a good opportunity for altcoins to grow. However, the index is approaching technical support, which may affect market sentiment overall...
As for XRP, there is a fairly strong liquidity pool ahead — the ATH resistance zone. The price is in a distribution phase after a change in character and a breakout of the downtrend resistance in the 2.33 zone. The momentum may exhaust its potential to break through the 3.35-3.34 zone, and growth may be halted for correction or reversal (in correlation with Bitcoin's dominance in the market).
Resistance levels: 3.35-3.40
Support levels: 3.0, 2.64
A breakout of resistance without the possibility of further growth, a return of the price below the level (i.e., inside the global flat) will confirm the fact of a false breakout of resistance, which may trigger a correction or even a reversal.
Best regards, R. Linda!
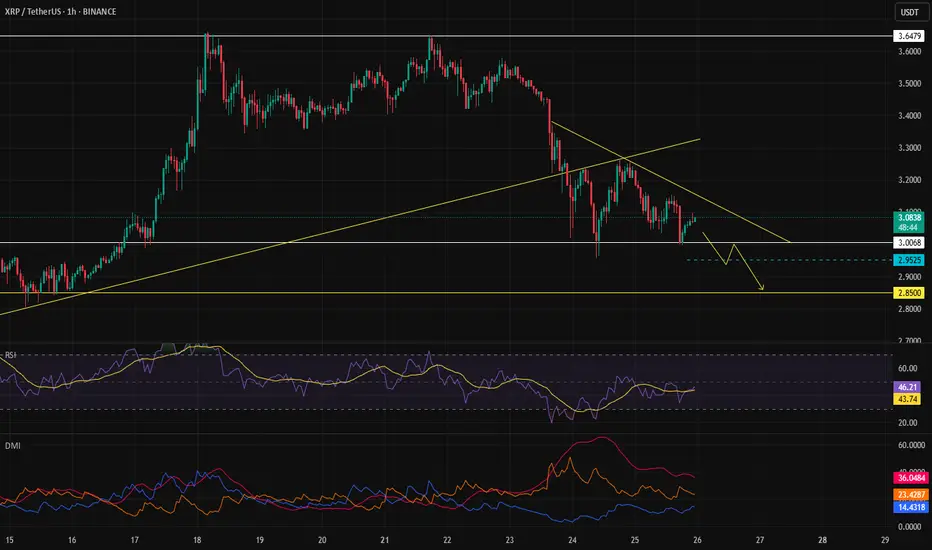
Sell setup if the sell trigger gets activated.Due to a weak trend and a rejection from the all-time high, we’ve seen a strong rejection, suggesting that the price may drop further. If the sell trigger gets activated, it could be a good opportunity to open a sell position.
XRP stays above $3 ┆ HolderStatBYBIT:XRPUSDT is printing higher lows into the $3.44 resistance. Breakout could activate $3.60 target. Watch $3.30–$3.28 for possible pullbacks. Bullish pressure mounting.
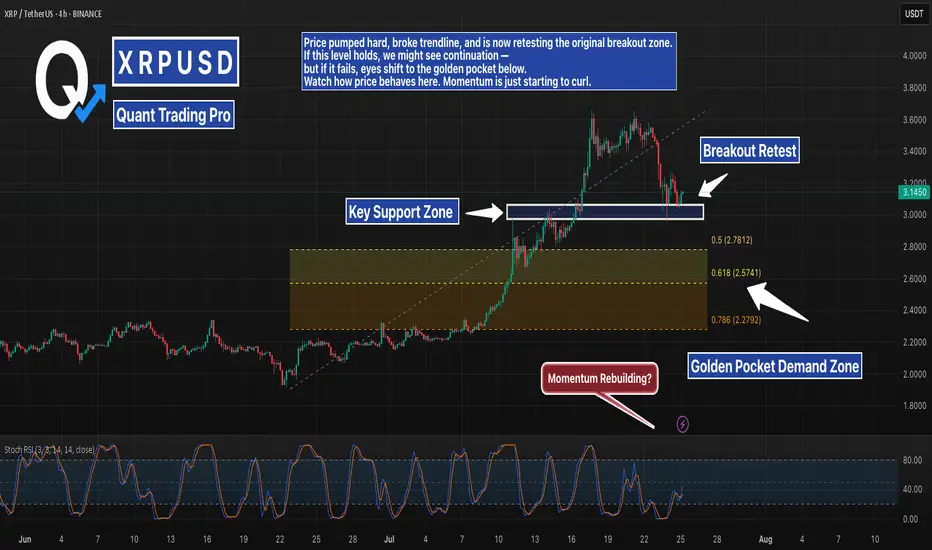
XRP 4H – Critical Retest Zone + Golden Pocket BelowXRP is sitting right on its prior breakout zone after a clean rally and trendline break. This zone is acting as critical support — the same area that triggered the last explosive move. Bulls want to see a bounce here with momentum building again (Stoch RSI is curling from oversold).
If this level fails, price could retrace deeper into the Fibonacci golden pocket (2.57–2.78), where stronger demand is likely waiting. That confluence of fib levels and past consolidation makes it a high-interest area for potential long setups.
For now, this is a pivotal moment. Either we bounce here — or things get a lot more interesting below.
#XRP #CryptoAnalysis #FibonacciRetracement #GoldenPocket #BreakoutRetest #Altcoins #TechnicalAnalysis #QuantTradingPro
Ripple (XRP): Looking For Breakout and Smaller 10% PumpRipple coin has established some kind of local support zone, where we had a potential MSB to form but failed to break the area near $3.25.
Now price has cooled down and most likely will head again for another attempt to form the market structure break, so we are looking for a 10% gain right here.
Swallow Academy
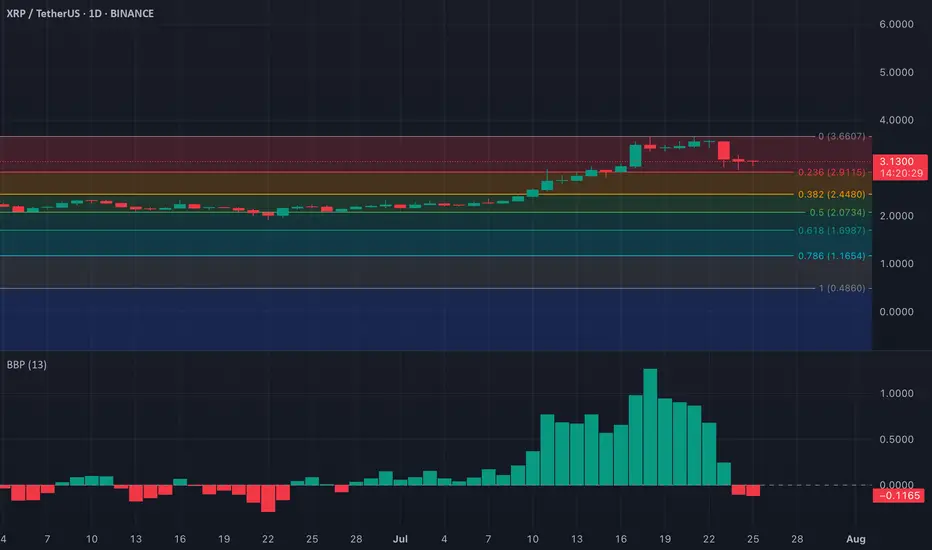
XRP – Bearish Signals from Elder-Ray IndexXRP’s bullish momentum appears to be fading, according to recent readings from the Elder-Ray Index on the daily chart. Over the past two sessions, the indicator has printed consecutive red bars, reflecting a clear shift in sentiment as buying pressure weakens.
The Elder-Ray Index evaluates the strength of bulls versus bears by measuring the difference between an asset’s price and its exponential moving average (EMA). A negative reading, like the one currently seen on XRP, means the asset is trading below its EMA — a sign that bearish pressure is outweighing bullish momentum. Traders may want to monitor closely for further downside confirmation.
XRP is still waiting for a longI think that XRP - and looking at the Total Market Cap chart - has taken a downward trend. Although the RSI is well above 70 on the daily timeframe, the faster leg is already approaching 50. Looking at the 4-hour RSI, as long as it is below 50, I do not expect an upward movement. I see a chance for further upward movement if the chart is currently above $3.2971. It is worth watching the 4-hour 50 EMA for possible long position opening, but only if the price crosses the 4-hour 50 EMA upwards. There could be a danger if it breaks the 50 EMA on the daily, which will be around $2.7. I should add that the 4-hour 200 EMA is around $2.8, so there will be a band between 2.7-2.8 where the chart can dance before deciding which direction to take. As long as the RSI MA is above 50 on the day, long-term positions - which were started around 2023 - should not be negatively affected by this "small" sell off. I think it is worth waiting for now for longs, not to enter an upward trade into the declining chart. Attention should be focused on the 4-hour 50 ema/chart cross, and the 4-hour rsi MA 50 cross. Until these are met, starting a long is life-threatening. I am curious how you see it.
