XRPUSDT.P trade ideas
XRP - One More Wave Soon!Hello TradingView Family / Fellow Traders. This is Richard, also known as theSignalyst.
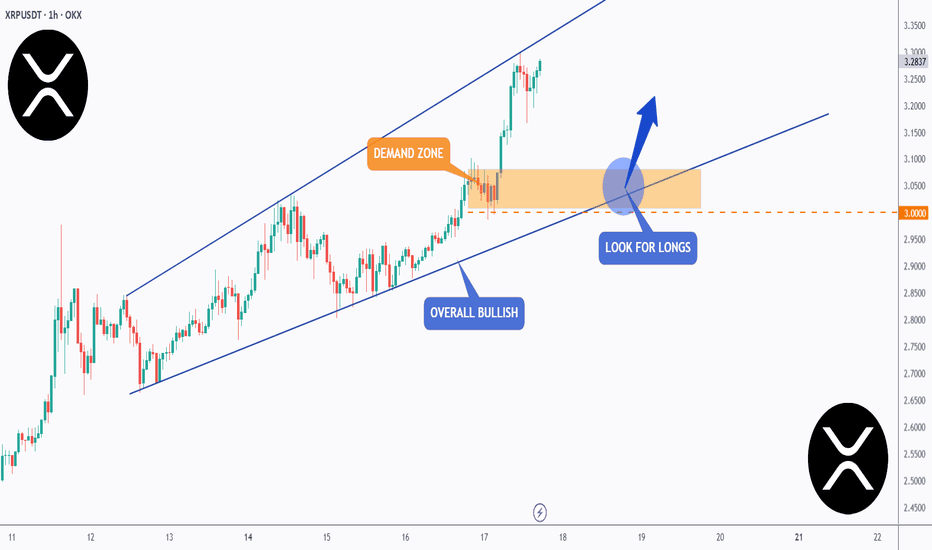
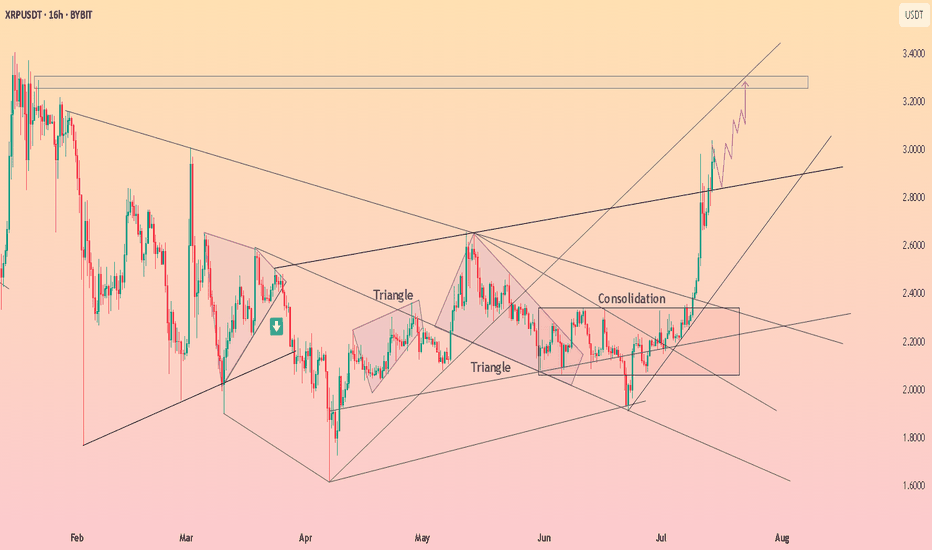
📈XRP has been overall bullish trading within the rising wedge pattern in blue.
However, it is approaching its all-time high at $3.4.
🏹 The highlighted blue circle is a strong area to look for buy setups as it is the intersection of the orange demand zone and lower blue trendline acting as a non-horizontal support.
📚 As per my trading style:
As #XRP retests the blue circle zone, I will be looking for bullish reversal setups (like a double bottom pattern, trendline break , and so on...)
📚 Always follow your trading plan regarding entry, risk management, and trade management.
Good luck!
All Strategies Are Good; If Managed Properly!
~Rich
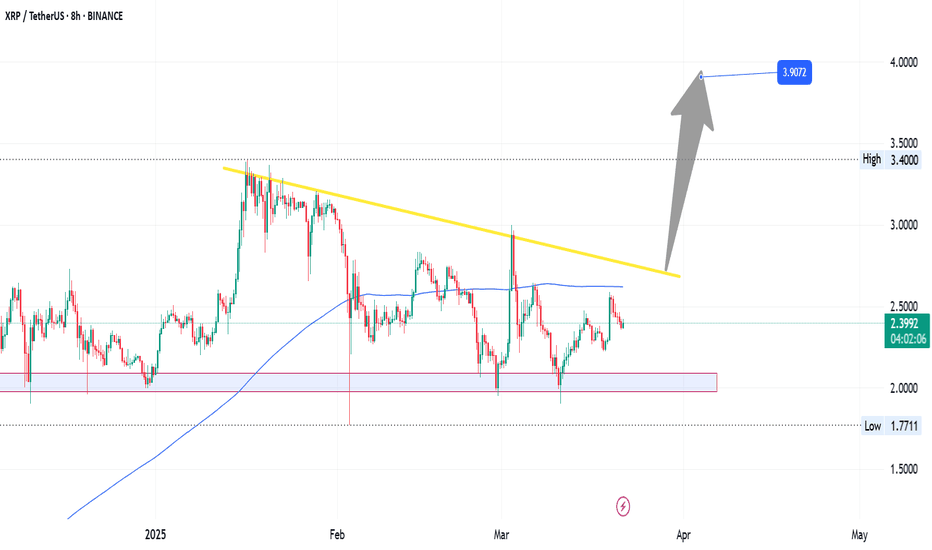
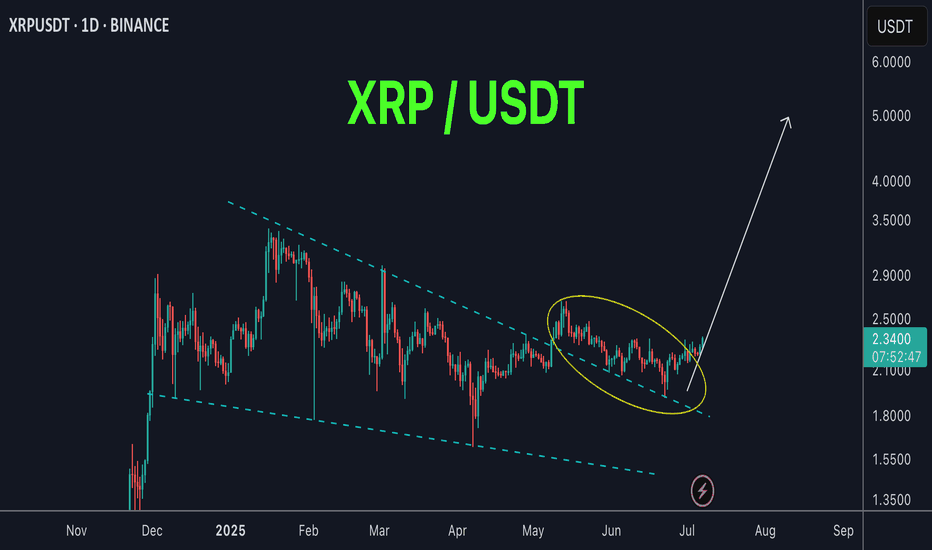
XRP’s Descending Trendline Showdown: Is a Breakout Toward $4From a purely technical‐analysis standpoint (not financial advice), here are a few observations and ideas you can take into xrp/usdt
1. Descending Trendline Resistance
- Price has been making lower highs, forming that yellow descending trendline. A sustained break and close above it (on higher‐than‐average volume) would be a strong bullish signal.
- If price rejects at the trendline again, that often implies more consolidation or another leg downward, so watch how price reacts if/when it retests that line.
2. Moving Average Context
- It looks like the market is hovering near or just below a key moving average (blue line). If the price can reclaim that moving average and stay above it, it typically signals renewed bullish momentum. Conversely, continued closes below it can cap upside.
3. Key Support Zones
- The pink/gray box in the chart (roughly the 2.0–2.1 area) seems to be an important support region; buyers have stepped in there before.
- Below that, the 1.77–1.80 area looks like a major support “floor” (dotted line). If price were to break below that, it could trigger a deeper pullback.
4. Potential Upside Targets
- The horizontal level around 3.40 is the next big resistance if price can break out above the descending trendline.
- If bulls really take over and push through that 3.40 zone, a run toward 3.90–4.00 (as shown by the arrow) becomes more plausible.
5. Watch Volume and Momentum**
- Pay attention to volume on any breakout. A low‐volume push above the trendline can be a fakeout, whereas a strong volume surge confirms conviction.
- Oscillators (RSI, MACD, etc.) can help you gauge whether momentum is building or fading as price approaches resistance.
Overall, a breakout above the descending trendline plus a reclaim of the moving average would favor upside toward the mid‐3s or higher. Failure to break out, however, might lead to another test of that 2.0–2.1 support or even the 1.77 floor. Keep risk management in mind either way.
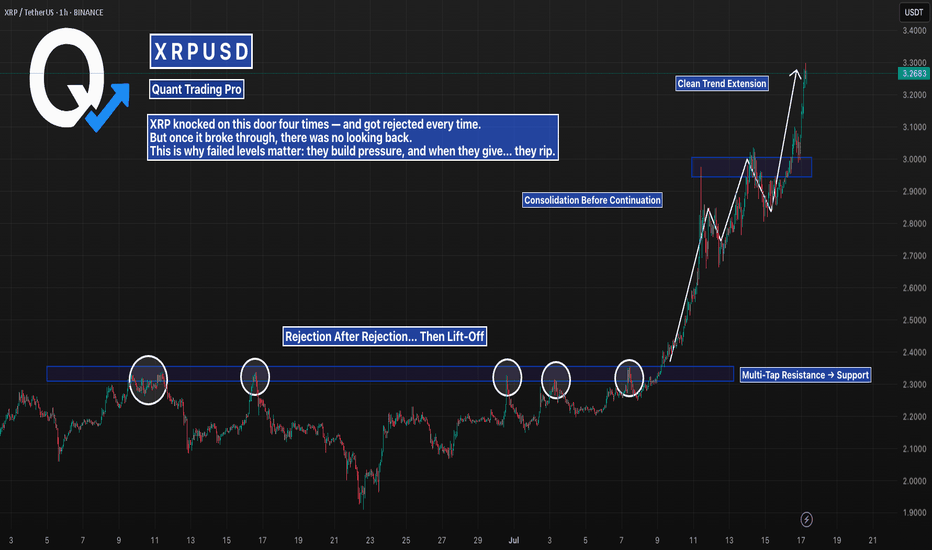
Four Failed Breakouts… Then the Real One HitThe $2.22 level stopped XRP dead in its tracks four times.
Each failed breakout built more pressure — and when it finally cleared, price exploded.
Now it’s trending clean, breaking structure after structure.
This is what a proper breakout looks like.
#XRP #XRPUSD #BreakoutTrading #ChartPatterns #FailedBreakout #CryptoSetup #BacktestEverything #TradingView #QuantTradingPro
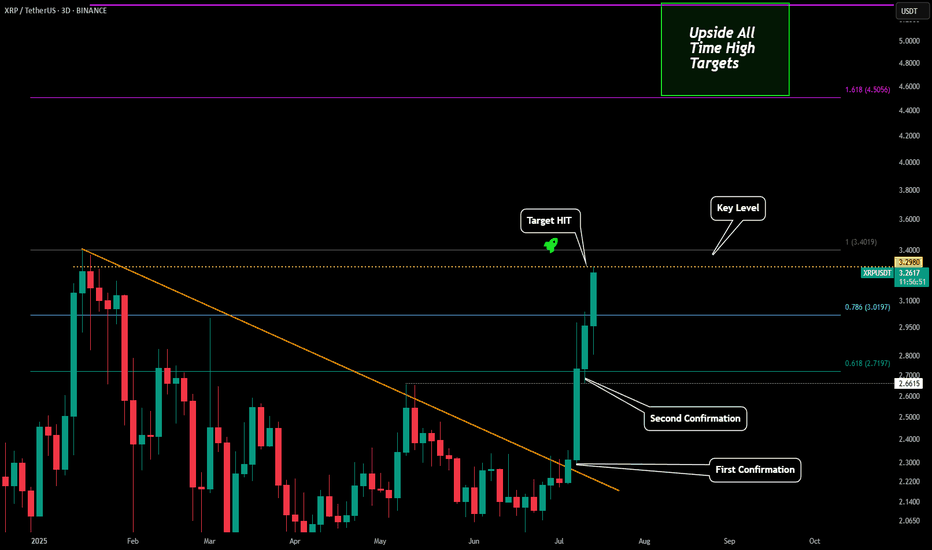
XRP - Perfect Prediction Please refer to our previous posts:
As stated in the last post our breakout target level (key level) was just hit. A 44% breakout move just occurred over the past 10 days due to the amazing analytics of the Viaquant system.
Now it is possible we see some profit taking in this region, but as soon as the last high is breached I have also outlined where to expect the next top to potentially come in at. Right now the range looks to be between $4.50-$5.33.
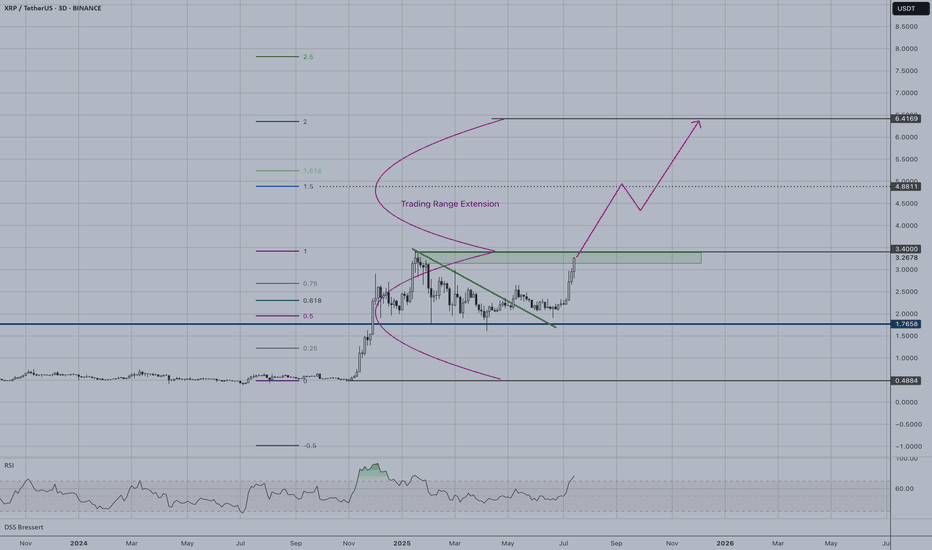
XRP | Up to New HighsXRP has successfully broken out of its consolidation pattern and is now targeting significant upside levels. A breakout from the green support zone around $3.27 will confirms the strong bullish momentum.
Key Technical Levels:
- Primary target: $6.42 (2.0 Fibonacci extension)
- Extended target: $7.50+ (2.5 Fibonacci extension)
Trade Setup:
- Support zone: $3.27 (former resistance now support)
- Stop loss: Below $3.00 to protect against false breakouts
- Risk/reward: Favorable with multiple upside targets available
Technical Outlook:
The projected path suggests continued upward momentum with potential pullbacks to retest the breakout level. RSI shows room for further advancement without being severely overbought.
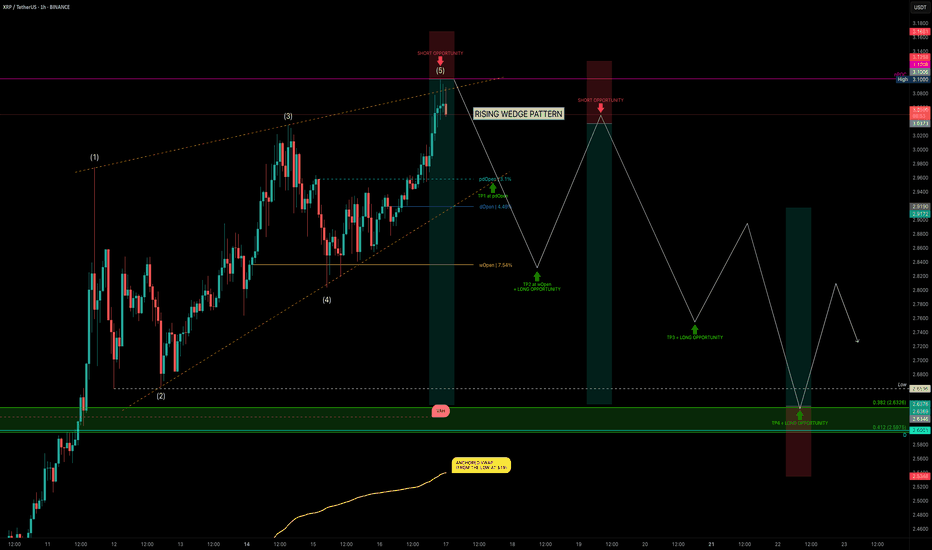
XRP Hits $3.10 — Rising Wedge or Ready to Fly?XRP has been on a strong run over the past 24 days, rallying from $1.90 → $3.10 — a +62% price increase. But after hitting key resistance, is XRP about to correct, or will it break out further? Let’s dive into the technicals.
🧩 Market Structure
Rising Wedge Pattern:
The current market structure resembles a rising wedge, with XRP likely completing wave 5.
Rejection Zone Hit:
Price tapped the nPOC at $3.10 and rejected — providing a clean short opportunity.
📉 Key Support Levels & Confluences
Taking the full 24-day bullish move:
0.382 Fib Retracement: $2.6326 — aligns with liquidity pool below the $2.6596 swing low.
226-day Trading Range VAH: ~$2.62 (red dashed line) — adds confluence.
Daily Level: $2.60 — further support.
Anchored VWAP from $1.90 Low: ~$2.54 (rising over time).
✅ Conclusion: The $2.66–$2.60 zone is a critical support area and offers a solid long opportunity.
Trade Setups
🔴 Short Setup (After Breakdown Confirmation):
Wait for a sell-off & breakdown of the wedge.
Ideal entry: retest of the lower wedge edge, ideal short entry would be between 0.618–0.786 fib retracement.
🟢 Long Setup:
Entry Zone: $2.66–$2.60
SL: below VWAP line
Target: Fib 0.618 as TP
🧠 Educational Insight: Rising Wedges Explained
A rising wedge is a bearish pattern, often signalling weakening momentum as price climbs within narrowing highs and lows.
Key points:
➡️ Volume typically declines as the wedge matures.
➡️ Breakdown below the lower wedge edge often triggers stronger sell-offs.
➡️ Retests of the broken wedge support turn into ideal short entries.
Pro tip: Combine wedge patterns with fib retracement zones and VWAP levels for higher-confidence setups.
Watch for wedge breakdown confirmation before shorting.
_________________________________
💬 If you found this helpful, drop a like and comment!
Want breakdowns of other charts? Leave your requests below.
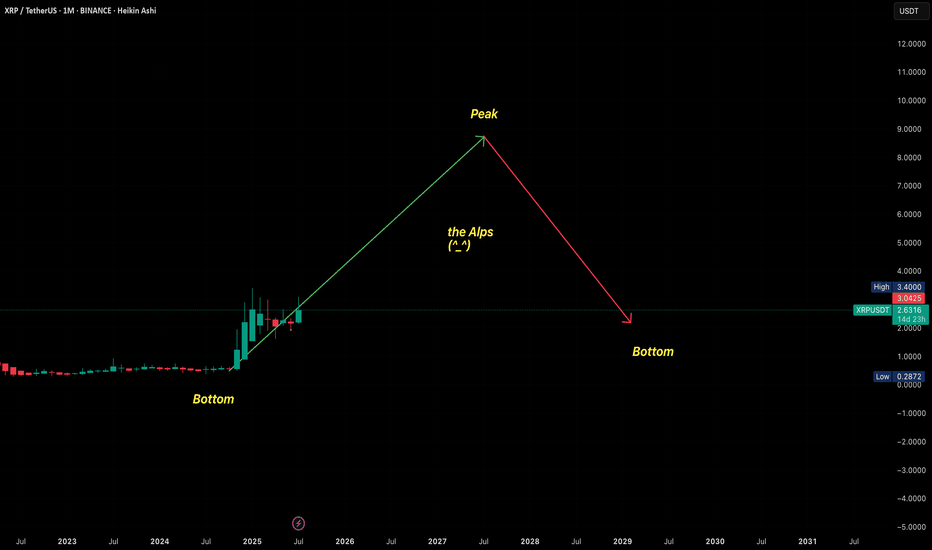
WHY DO YOU KEEP ASKING ABOUT PRICE SO MUCH?WHY DO YOU KEEP ASKING ABOUT PRICE SO MUCH?
The problem lies in the wrong frame of reference when you first enter the market. Faulty input leads to flawed thinking, resulting in poor actions and bad outcomes.
I constantly receive questions like:
“Can I buy at this price yet?”
“Should I wait for a lower price?”
“Is this the bottom?”
“BTC is at 108k, is it still good to LONG?”
“It’s at 123k now, will it go to 180k?”
All of these revolve around PRICE, but in reality, price isn't what you should focus on. What's important is understanding market movements and trends.
Many of you DCA blindly at resistance, support, or based on on-chain data, thinking the price will reverse or bounce… but it doesn’t. So why?
---------------------------------------------------------------------------------------------
Let me give you an analogy:
Imagine you're hiking the Alps.
You start early in the morning. When you're tired, you rest. When the scenery is beautiful, you stop and enjoy it. When you're thirsty or hungry, you take a break. Eventually, you reach the top (PEAK).
Did you ever ask your friend along the way:
"How many meters have we climbed?"
"How many meters left to the top?"
Of course not.
You just know you're ascending, and when you reach the peak, you’ll know.
Uptrend is like climbing up, downtrend is climbing down.
You don’t need to know your exact altitude — you just need to know whether you’re going up or down, and when you’re at the top, you’ll feel it.
---------------------------------------------------------------------------------------------
The market is the same.
When it goes up, you know it’s going up.
When it goes down, you know it’s going down.
When it’s the peak, you’ll know.
When it’s the bottom, you’ll feel it.
There's no need to obsess over:
“Is this the top?”
“Is this the bottom?”
Why?
Because when you're fixated on the real-time price, without understanding market movement, you’re being led by price — not leading your trades.
---------------------------------------------------------------------------------------------
In summary:
Stop letting price control your mind.
Focus on trends and market movement, and you’ll know where you are.
When climbing, you know you’re climbing. When peaking, you’ll know it’s time to pause. Simple as that.
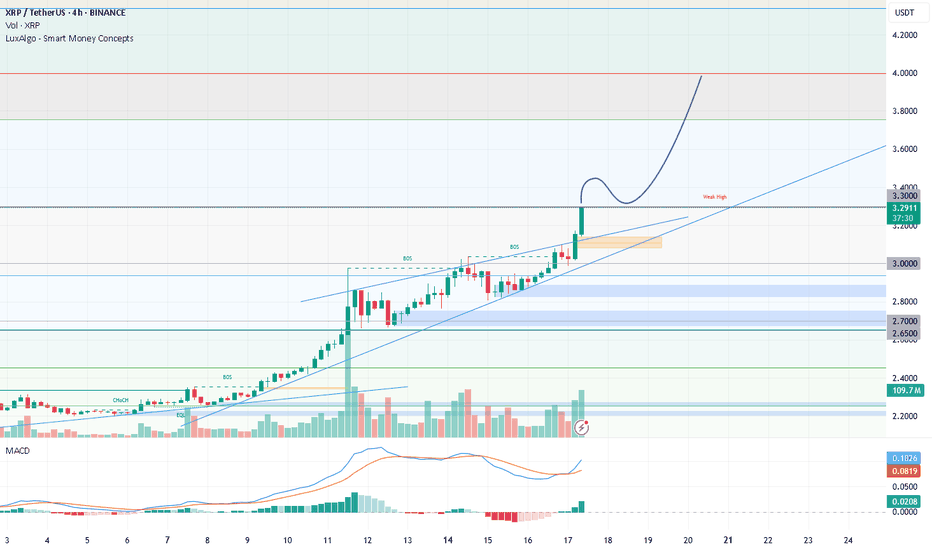
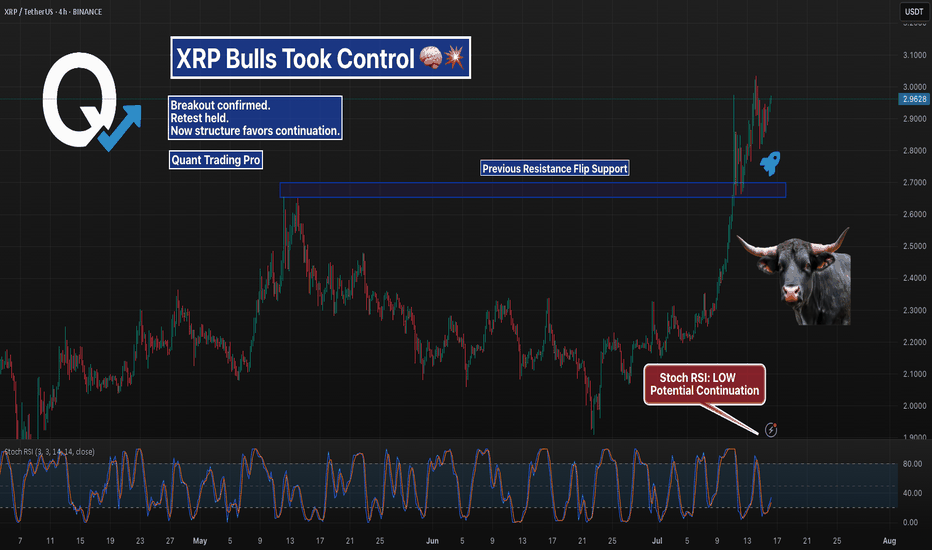
XRPUSDT – Breakout Retest Confirmed | Bulls in ControlXRP flipped its previous resistance zone into support and is now consolidating above it.
Structure looks strong, momentum is intact, and the breakout zone held cleanly — bullish continuation is the dominant scenario unless the flip fails.
Watching for continuation above $3.00 or sharp reaction at key levels.
#XRPUSDT #Breakout #CryptoTrading #SupportResistance #QuantTradingPro #TradingView
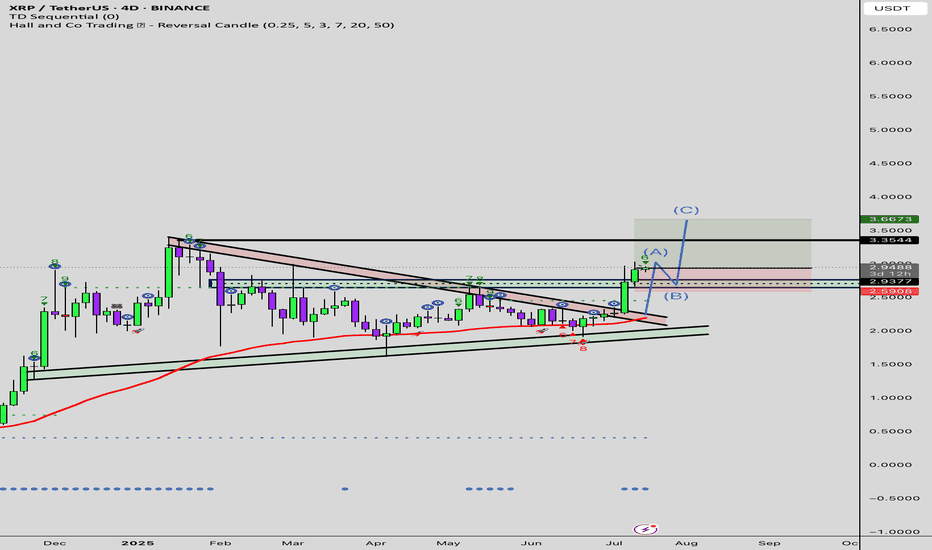
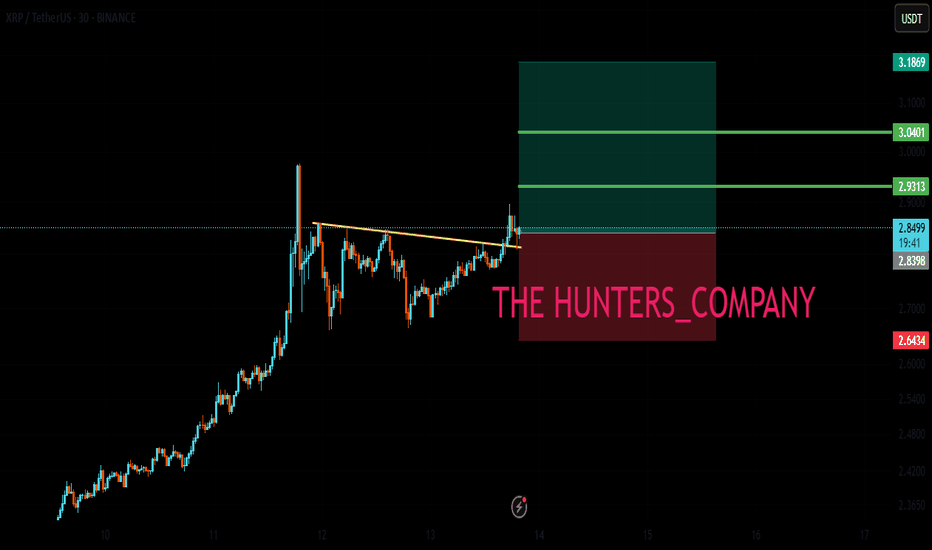
XRP/USD (RIPPLE) BUYtitle: XRP/USD (RIPPLE) BUY
Asset: Crypto
Symbol: XRP/USD
Market Entry Price 1: $2.9450
Limit Entry Price 2: $2.7450
Stop Loss: $2.6450
Take Profit 1: $3.145 (close 10%)
Take Profit 2: $3.345 (close 25%)
Take Profit 3: $3.645(close 50%)
Take profit 4: $3.845 (close 75%)
Let any remaining Xrp run risk free
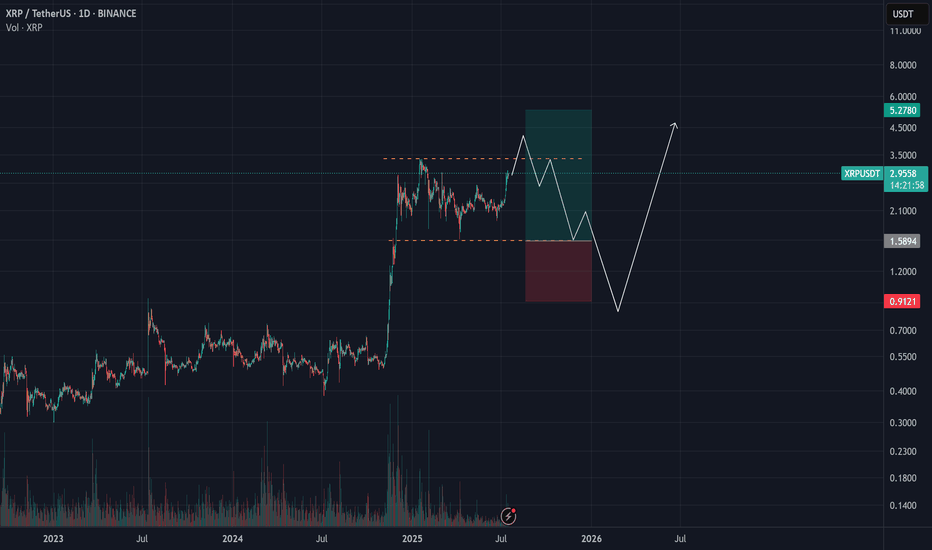
XRP (Ripple) Analysis – July 15, 2025XRP has built significant liquidity between the $1.6 to $3.4 range, making a clear breakout through this zone more challenging.
📊 While a short-term breakout above this range is possible,
the presence of short-term investors likely aiming to take profits above the range increases the probability of a pullback toward the lower bound.
🎯 For a more optimal and lower-risk entry, we should wait for price action near the $2 zone.
If the market shows a strong bullish reaction from that level, it could offer a solid setup for targeting higher levels.
Check support above 2.5102-2.6013
Hello, traders.
If you "Follow", you can always get new information quickly.
Have a nice day today.
-------------------------------------
(XRPUSDT 1D chart)
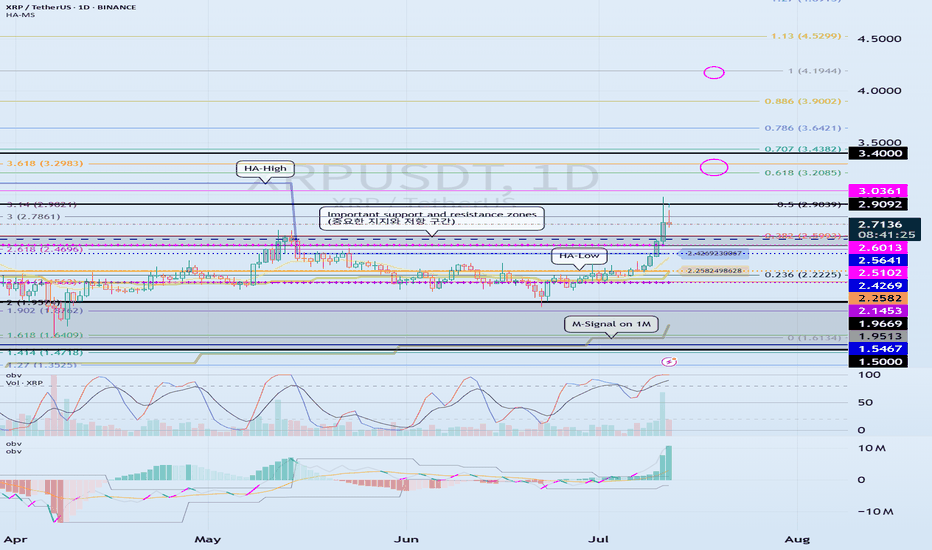
It has broken through the important support and resistance zone.
Accordingly, the key is whether the price can be maintained above 2.5102-2.6013 and rise.
If the price is maintained above 2.5102-2.6013, it is possible that a stepwise rise will occur.
At this time,
1st: Right Fibonacci ratio 0.618(3.2085) ~ Left Fibonacci ratio 3.618(3.2983)
2nd: Right Fibonacci ratio 1(4.1944)
You need to check for support near the 1st and 2nd above.
The strong support area is 1.5-1.9669.
----------------------
The left Fibonacci ratio was drawn in the initial rising wave, and the right Fibonacci ratio was drawn in the recent rising wave.
Therefore, if the price rises above 3.618(3.2983) of the Fibonacci ratio drawn in the initial rising wave and maintains it, there is a high possibility of creating a new wave.
Since the Fibonacci ratio is a tool for analyzing the chart, it is not good to use this point as a support and resistance point.
Therefore, we need to check whether the DOM(60) indicator or the HA-High indicator is newly created and create a response strategy depending on whether there is support.
Currently, the DOM(60) indicator is formed at the 2.5102 point, and the HA-High indicator is formed at the 2.4269 point.
The basic trading strategy is to buy near the HA-Low indicator and sell near the HA-High indicator.
However, if it receives support in the HA-High ~ DOM(60) section and rises, it is likely to show a stepwise upward trend, and if it receives resistance in the DOM(-60) ~ HA-Low section and falls, it is likely to show a stepwise downward trend.
Therefore, trading begins by checking whether there is support in the DOM(-60) ~ HA-Low section and the HA-High ~ DOM(60) section.
-
Thank you for reading to the end.
I hope you have a successful transaction.
--------------------------------------------------
- Here is a description of the big picture.
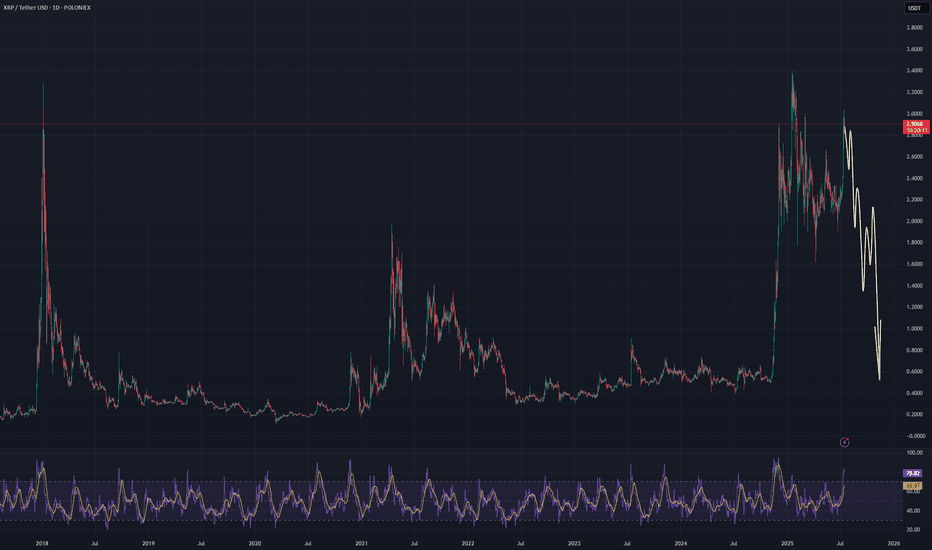
(3-year bull market, 1-year bear market pattern)
I will explain more details when the bear market starts.
------------------------------------------------------
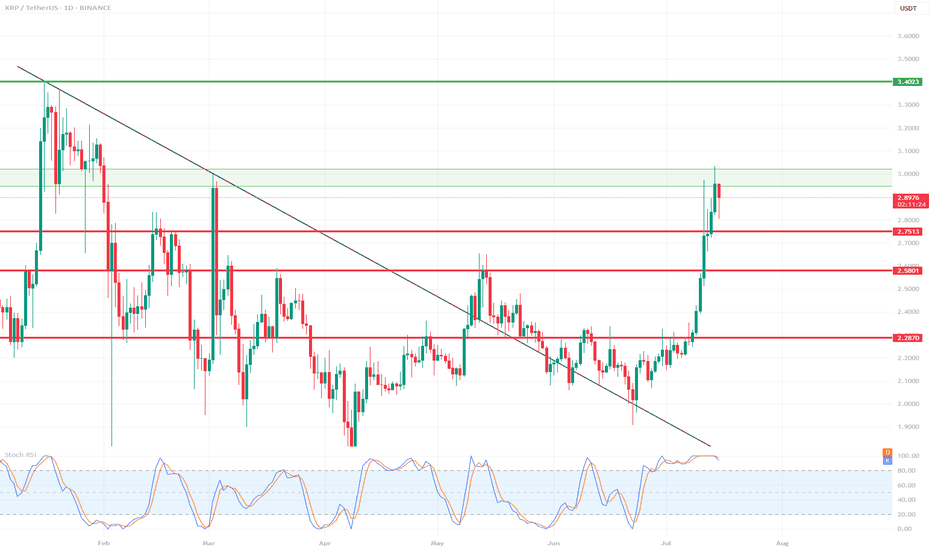
XRP 1D Chart Review📊 Support and Resistance Levels:
🔼 Resistance:
$2.95 - $3.02 – currently being tested, a local resistance zone. Price slightly rejected.
$3.40 – another strong resistance level from the previous high (visible on the left side of the chart).
🔽 Support:
$2.75 – the closest, recently broken support level.
$2.58 – another local support level.
$2.28–$2.30 – a very strong support zone that has been tested multiple times.
📈 Pattern and Momentum:
A breakout from a wedge-shaped downtrend with very high volume and long bullish candles indicates strong demand.
We are currently observing a correction/rejection at $3.02 – a possible short-term pullback.
🔄 Oscillator – Stochastic RSI:
The Stochastic RSI oscillator is in the overbought zone (near 100) – indicating possible consolidation or correction.
The curves are starting to curve downwards – a potential signal for a slight correction in the coming days.
🧠 Scenarios:
✅ Bullish (continued growth):
If the $2.95–$3.02 level is broken strongly and confirmed (e.g., by a daily candlestick closing above it), the target will be $3.40.
In this case, a quick rally to $3.40 is possible without major obstacles.
⚠️ Bearish (correction):
If the $3.02 zone holds as resistance, the price could retrace to $2.75 (the first local support).
If downward pressure persists, $2.58 could be tested.
📌 Summary:
XRP is in a strong uptrend after breaking out of long-term resistance.
In the short term, overbought prices on the Stoch RSI could trigger a correction to $2.75.
Key resistance: $3.02 – breaking it could signal further gains towards $3.40.
It's worth monitoring price reaction in this zone and candlestick confirmation.
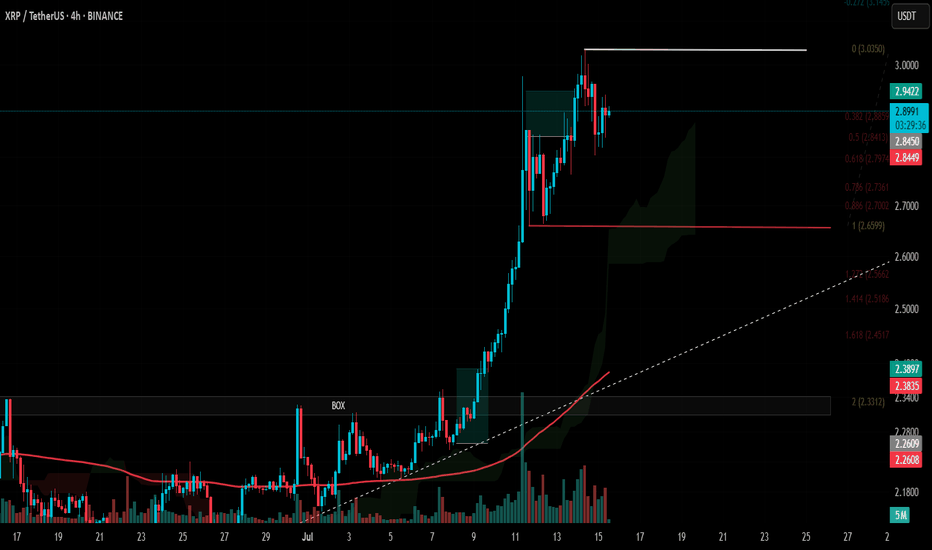
#XRP Update #2 – July 15, 2025#XRP Update #2 – July 15, 2025
XRP had previously completed the correction of its first impulsive move. Now, it has also completed the correction of the second impulsive leg. The current target for XRP stands around the $3.15 zone.
However, before reaching that level, it first needs to break through the $3.00 resistance area, which previously acted as a strong support/resistance zone. If XRP fails to gain enough volume and momentum for a strong breakout, there is a risk it may reverse from this level, potentially forming a double top pattern.
Because of this uncertainty, I do not recommend taking a long or short position on XRP at this stage.
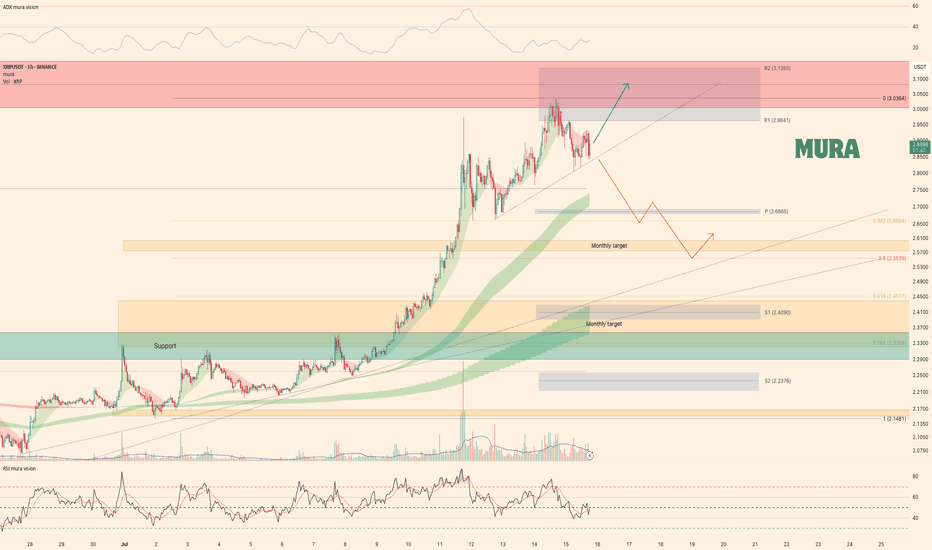
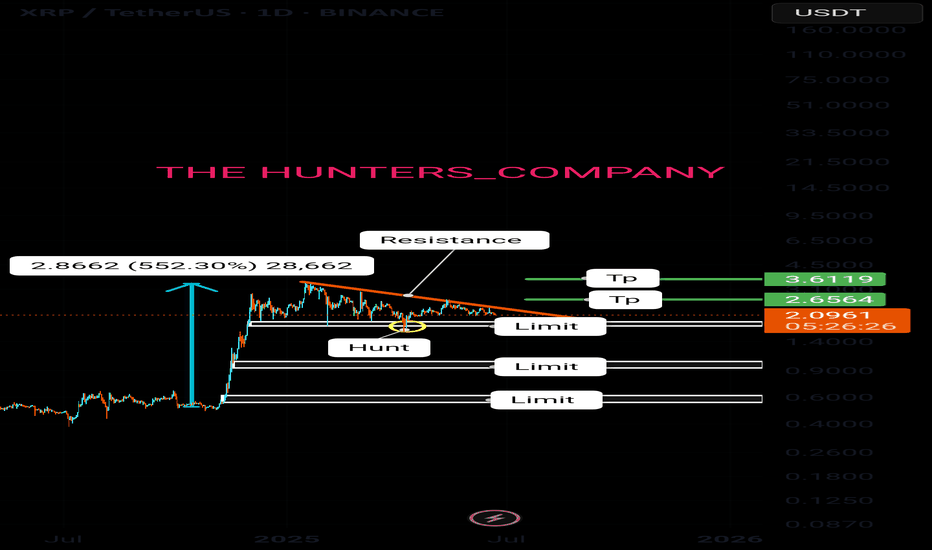
Weekly trading plan for XRPLast week, BINANCE:XRPUSDT demonstrated strong bullish momentum, hitting all our projected targets. Currently, price is facing rejection at resistance. Locally, we've drawn a trendline - a breakdown would initiate downside movement toward support levels. Until that break occurs, we retain potential for new ATH
As always, manage your risk wisely
Xrp:The fate of Ripple in the long termhello friends👋
After a good price growth that we had, you can see that the buyers gradually exited and a triangle pattern was formed.
Now, according to the specified support, it should be seen whether buyers support Ripple or not...
You have to wait and nothing can be said until the failure of the pattern, but we suggest that you buy step by step with capital and risk management in the identified areas that are very good supports and move to the set goals.
And in the end, we must say that don't forget that we are in a strong upward trend, that the probability of the continuation of the Bister trend is the possibility of a fall...
🔥Follow us for more signals🔥
*Trade safely with us*
