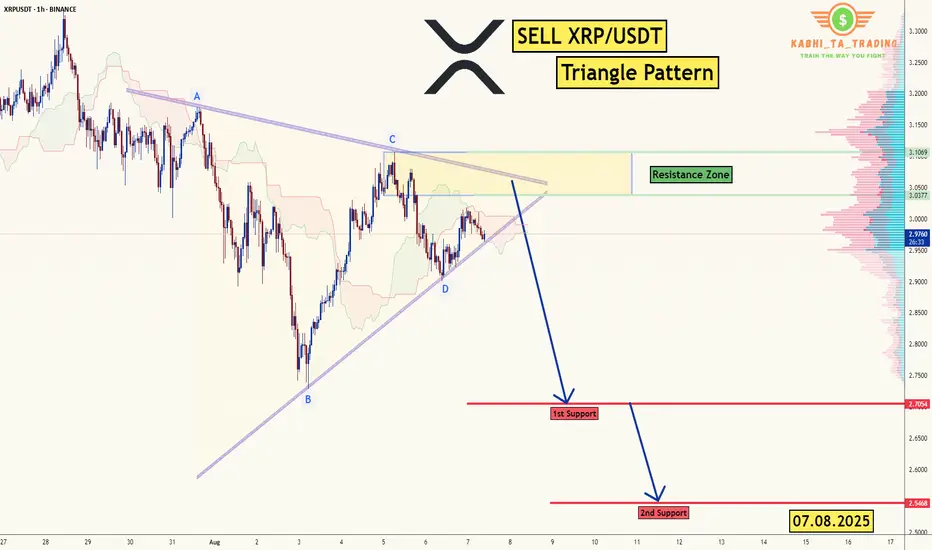
XRP/USDT -H1 - Triangle Breakout (07.08.2025)The XRP/USDT Pair on the H1 timeframe presents a Potential Selling Opportunity due to a recent Formation of a Triangle Breakout Pattern. This suggests a shift in momentum towards the downside in the coming Days.
Possible Short Trade:
Entry: Consider Entering A Short Position around Trendline Of The Pattern.
Target Levels:
1st Support – 2.7054
2nd Support – 2.5468
🎁 Please hit the like button and
🎁 Leave a comment to support for My Post !
Your likes and comments are incredibly motivating and will encourage me to share more analysis with you.
Best Regards, KABHI_TA_TRADING
Thank you.
XRPUSDT trade ideas
XRPUSDT → Hunting for liquidity ahead of a possible declineBINANCE:XRPUSDT.P is forming a downward market structure after a false breakout of global resistance. Bitcoin is in a correction phase and, after a slight rebound, may continue its movement...
Bitcoin has entered the sell zone. The price is consolidating below the global consolidation boundary of 115,500 during the retest, and if Bitcoin continues to decline, this could trigger a downward movement across the entire cryptocurrency market.
XRP is forming a bearish market structure. After capturing liquidity and a false breakout of resistance, the price is returning to a bearish trading range. There is no potential for continued growth at this time. A consolidation of the price below 3.00 - 2.996 could trigger further sell-offs.
Resistance levels: 2.996, 3.050, 3.181
Support levels: 2.996, 2.891, 2.74
The local bearish structure will be broken if the price starts to rise, breaks 3.050, and consolidates above it. In this case, XRP may test 3.181 before falling further.
At the moment, after a false breakout of resistance, the price is consolidating in the selling zone, and the downward movement may continue. I consider 2.74 - 2.655 to be the zone of interest in the medium term.
Best regards, R. Linda!

XRP 4H – Double Bottom… or Just Another Lower High?
XRP bounced cleanly from major support — the same zone that sparked its last leg up.
This could mark the early stages of a double bottom or just another bear market rally before continuation.
🔹 Previous top = strong supply rejection
🔹 Current support = high-volume bounce zone
🔹 Stoch RSI turning up from oversold
Key confirmation would be:
– Break of $3.15
– Retest + continuation
Otherwise? Another fakeout lower high could trap longs.

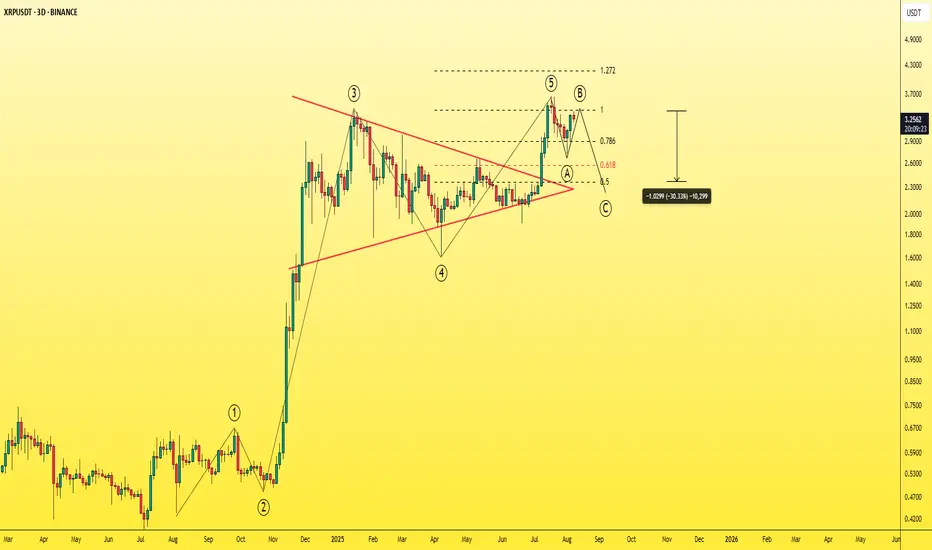
XRPUSDT - Time to be bearish!!Did you know that the XRP chart has turned bearish and is looking pretty grim?
A lot of indicators are pointing in that direction right now.
It recently formed a triangle pattern, broke out, rallied, and hit a new ATH — which coincided with the fifth and final wave of the Elliott Wave impulse.
Now it has shifted into an ABC corrective structure, and wave B seems to have completed, setting the stage for the main corrective move with wave C, which is expected to deliver around a 30% pullback from this point.
Another red flag for me is that XRP barely managed to break into a new ATH, only to quickly reverse and is now retesting the previous ATH, which lines up with the 1.00 Fibonacci level. Based on this, I strongly expect a major correction in XRP from here.
Sure, a lot of die-hard XRP believers won’t like this take — but let them ride it down. You can always buy back cheaper, my friend.
take a look to this post
As I told you earlier in a previous post, I recommended buying it at that time(3 months ago), which was the perfect entry. It has now risen by 50%, so I’m telling you to sell if you still hold it.
Best regards:
Ceciliones🎯
XRPUSDTHello Traders! 👋
What are your thoughts on RIPPLE ?
On the XRP chart, we can see that after breaking the descending trendline and reaching a resistance level, the price has entered a corrective phase.
We expect this correction to continue down toward the support zone, which coincides with the ascending trendline. This area also represents a pullback to the previously broken bearish trendline.
Once the pullback is complete, we anticipate a bullish continuation toward higher targets.
Don’t forget to like and share your thoughts in the comments! ❤️

Ripple (XRP): 1:3 RR Position Opportunity Here | Breakout ComingXRP is still rising, attempting to break the local high and possibly reach a new all-time high (ATH). We found two trading opportunities here, so now all we have to do is wait!
More in-depth info is in the video—enjoy!
Swallow Academy

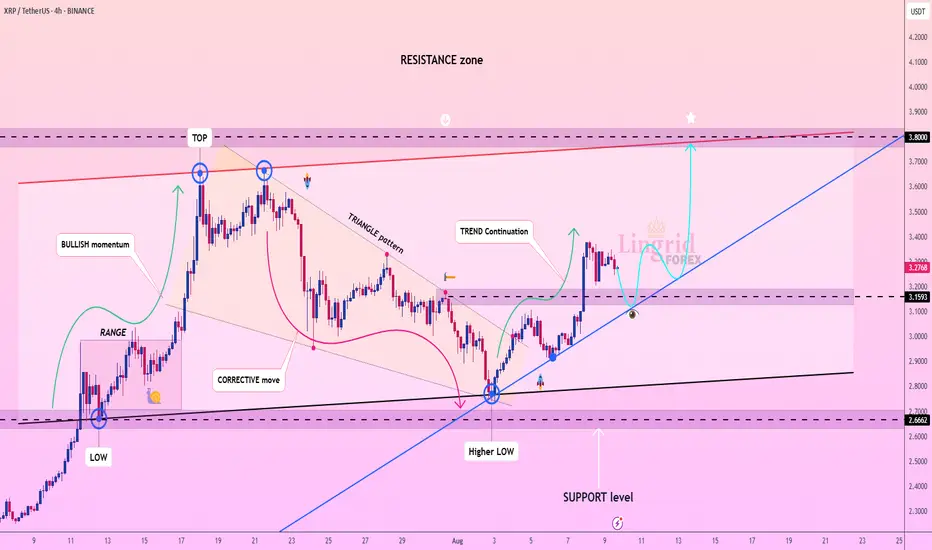
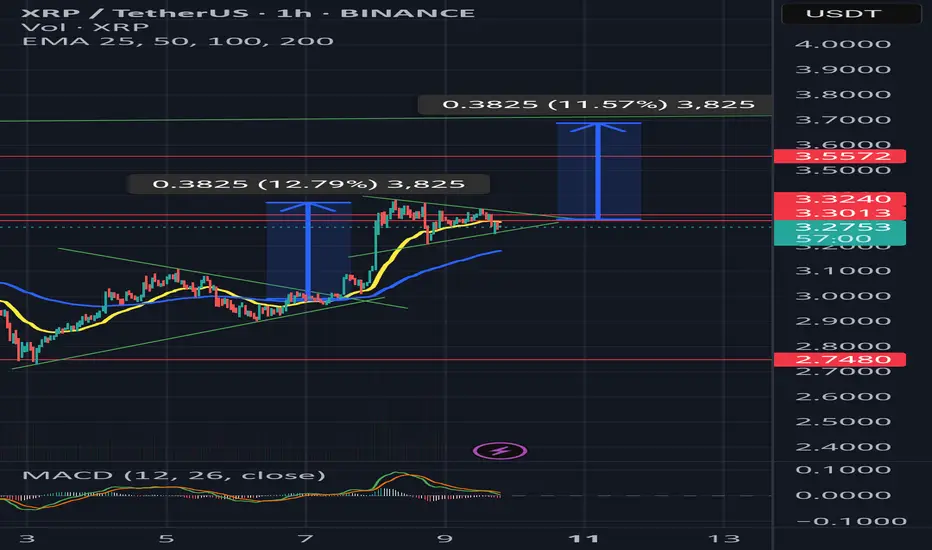
Lingrid | XRPUSDT Potential Trend ContinuationThe price perfectly fulfilled my previous idea . BINANCE:XRPUSDT is holding above the 3.1500 support zone after a clean rebound from the ascending trendline, signaling a bullish continuation setup. The structure remains intact with higher lows, and the next major objective lies in the 3.8000 resistance zone. A breakout above 3.4000 could open the way for accelerated upside movement. Trend bias remains bullish while price holds above key support.
📉 Key Levels
Buy trigger: Break above 3.4000
Buy zone: 3.1000–3.2000
Target: 3.8000
Invalidation: Drop below 3.000
💡 Risks
A breakdown under 3.0000 could shift trend to bearish
Resistance near 3.8000 may cause sharp rejection
Broader market weakness could limit upside
If this idea resonates with you or you have your own opinion, traders, hit the comments. I’m excited to read your thoughts!
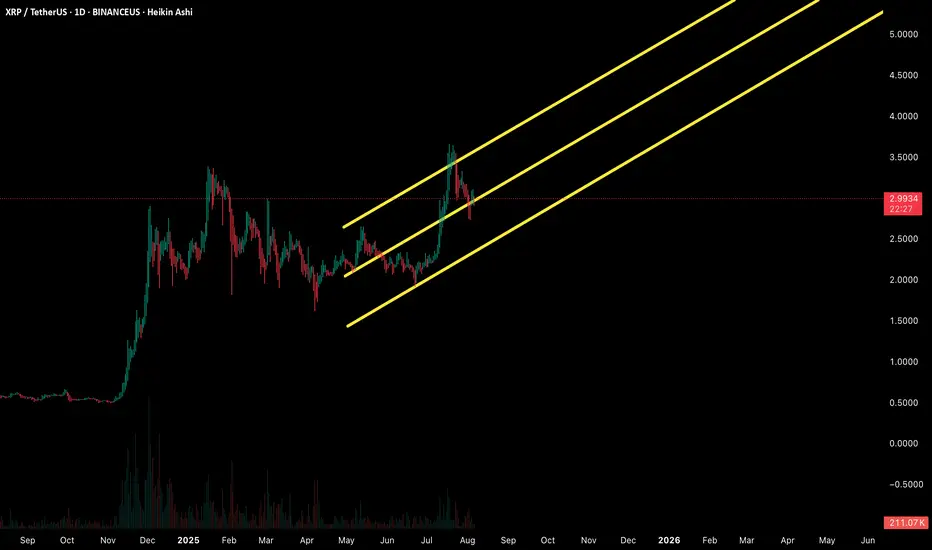
XRP Daily (August 6, 2025)Here's the breakdown of the daily XRP/USDT chart analysis:
🧱 Structure Detected
The chart shows a strong parabolic rally, followed by a pullback from a local high near the top of a rising channel.
Price has retraced and is currently sitting just under the midline of the channel, suggesting short-term weakness but within a larger bullish structure.
📊 Market Bias: Neutral-to-Bullish
Despite the local correction, price remains inside the rising channel, maintaining macro bullish structure.
A rejection near the channel midpoint and recent failure to reclaim that zone puts the short-term in a neutral state, but as long as price holds the lower channel trendline or horizontal support, bulls remain in control on the higher timeframe.
🎯 Bullish Targets
$3.18: High-volume node and prior rejection area (near POC on VPVR) — first key target on reclaim.
$3.50–$4.00: Upper channel extension zone — potential area if momentum resumes.
$5.00: Psychological round number and top of channel expansion zone — long-term stretch target.
🔻 Bearish Levels
$2.70: First major horizontal support (yellow line); key for trend defense.
$2.00–$2.20: Strong volume shelf on VPVR; if $2.70 fails, this is a likely bounce zone.
$0.67: Fibonacci anchor level (plotted on chart); last-resort structure base.
🕰️ Timeframe-Based Targets
Daily Swing Targets:
Upside: $3.18 > $3.50 > $4.00
Downside: $2.70 > $2.20 > $0.67
Weekly: Still bullish as long as price holds above $2.70 — structure remains intact.
🧠 Summary
XRP is currently consolidating inside a rising channel after a strong impulse move. Daily structure remains bullish overall, but recent weakness near the channel midpoint and POC suggests sellers are active. Watch for price to reclaim $3.18 or break below $2.70 for next directional move.
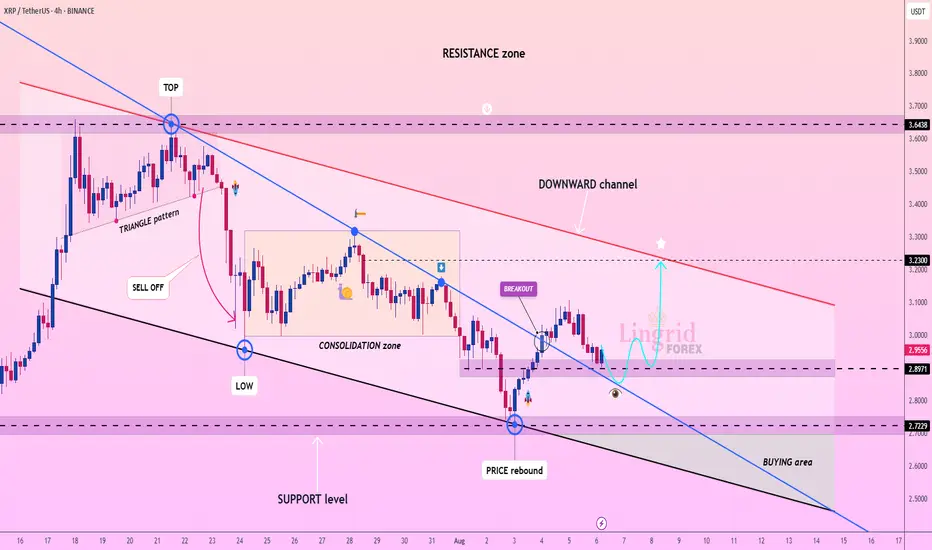
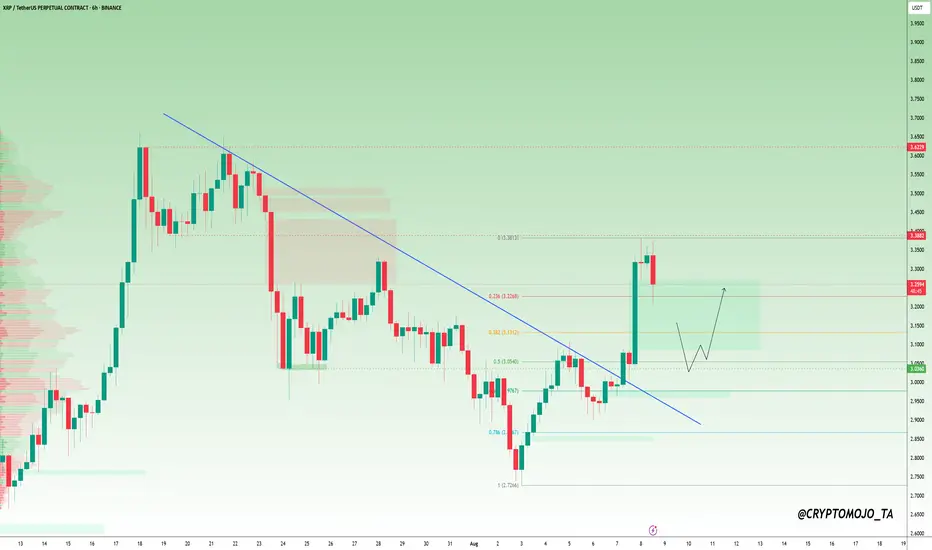
Lingrid | XRPUSDT Potential Upside Move From Support ZoneThe price perfectly fulfilled my previous idea . BINANCE:XRPUSDT is rebounding after a breakout from the consolidation zone and testing support around 2.897. The price is forming a bullish structure within a downward channel, aiming to reclaim the mid-level resistance. As long as it remains above 2.897, the bullish wave has room to target the descending channel’s upper boundary near 3.230. Momentum is gradually shifting toward upside continuation following the recent breakout and rebound.
📉 Key Levels
Buy trigger: Break and hold above 2.960
Buy zone: 2.850–2.960
Target: 3.230
Invalidation: Drop below 2.740
💡 Risks
Failure to hold 2.870 could invalidate the rebound
Overall channel remains bearish, posing structural resistance
Broader market sentiment may weigh on breakout momentum
If this idea resonates with you or you have your own opinion, traders, hit the comments. I’m excited to read your thoughts!
XRP Update · Support Confirmed · Not $4, Now $6 & HigherIt is true our next target is $4.5 but this isn't the final target anymore. Based on what I am seeing coming from the chart and what is happening marketwide, we have to continue to expand while aiming higher, each time, adapting to market conditions.
The next target for our XRPUSDT track and trade is now at $6.27, let's read the chart.
First, do what you need to secure profits, your trade, your position; and do your own thing. I you alert of the opportunity, great entry price and timing but it is up to you to plan, take profits and adapt your trading to your own individual conditions. All is good and we are doing great. Notice how the market continues to perform awesome just as expected and notice how we indeed are getting more; and more. This is not the start, XRP is already pretty advanced in its bullish cycle but this isn't the end either. There is plenty of room left available for much more growth.
Yesterday support was found exactly above 0.618 at $2.71. These levels were there before the retrace so we know based on what Fib. proportions XRP is moving. We know exactly where to find resistance and support.
As soon as support was activated the same day we got a full green candle and the break of another resistance. Today full green again. Normally, people would still say that it is early and wait for confirmation; not me, I told you the retrace would be fast and end within days. Seeing the action as it is today, we can confirm the resumption of the bullish move. This means higher prices and higher prices in the chart can translate into weeks of bullish action. Week after week after week. Some retraces and corrections will invariably show up, always small followed by additional growth.
This is the 2025 bull market. Still early, the best is yet to come.
Bullish momentum will grow and a massive force will take over the market. This force is likely to be with us for months and at this point everything will grow. This same energy will remain with us for years and we have to make the most of this cycle.
Be ready, be prepared, maximize profits and continue to buy, to hold and to trade long-term. The more we practice the more we learn.
The more we learn more money we can make. With more money, we can meditate more and with more meditation we can improve our results. The conclusion is abundance and with financial abundance we can materialize the type of life we want. It can be anything, but you will be rewarded based on your insistence, persistence and hard work.
Patience is key.
Thanks a lot for your continued support.
Namaste.

XRP PERPETUAL SELL SETUP ,Short from $3.06XRP PERPETUAL TRADE
SELL SETUP
Short from $3.06
Currently $3.06
Stoploss $3.35
Targeting $2.97 or Down
(Trading plan XRP go up to $3.14
will add more shorts)
Follow the notes for updates
In the event of an early exit,
this analysis will be updated.
Its not a Financial advice

XRP 8H – Rejection Off Resistance, Can Golden FIB Save It?XRP just printed a clean rejection off the $3.15 resistance zone, and price is now pulling back into a high-probability demand zone — the classic Golden Pocket (0.5–0.618) retracement from the July impulse leg.
With momentum cooling off, bulls need to step in soon or risk a drop into deeper Fib levels.
🔹 Key Levels & Structure
Price failed to reclaim the prior breakout zone (blue box) and is now in a short-term correction phase.
The Golden Pocket between $2.79–$2.59 lines up with price structure from late June.
Below that, 0.786 at $2.28 marks the final zone before invalidation of the full move.
🔹 Momentum Check
Stoch RSI remains in overbought territory — a deeper reset could align with a Fib bounce and create the next opportunity.
Price may need to sweep lows before continuation.
🔹 Scenario to Watch
A bullish bounce from the Golden Pocket → reclaim of $3.15 = strong upside continuation potential.
Otherwise, XRP may revisit the 0.786 level before stabilizing.
Do you trust the Fib support — or are you waiting for confirmation above $3.15?
Let’s discuss 👇

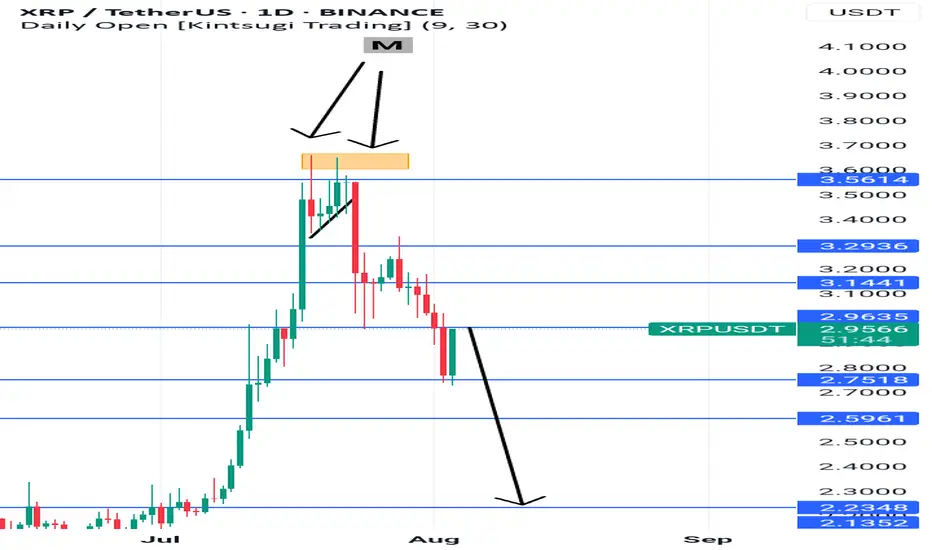
Ripening SellXrp had formed an M formation above, has retest current happen with a huge bullish candle upwards but, if you look to your immediate left-hand side you will see that the level 2.9635 is a point of reversal both with your immediate left-hand and further left.
Time will only tell with the way the candle will close. And if the setup is not invalidated, we project price movi g all the way to 2.2348
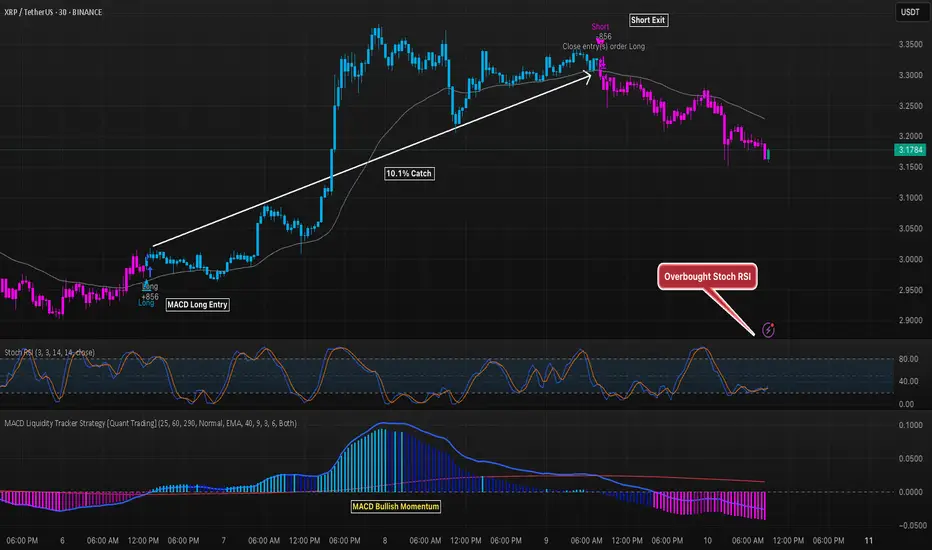
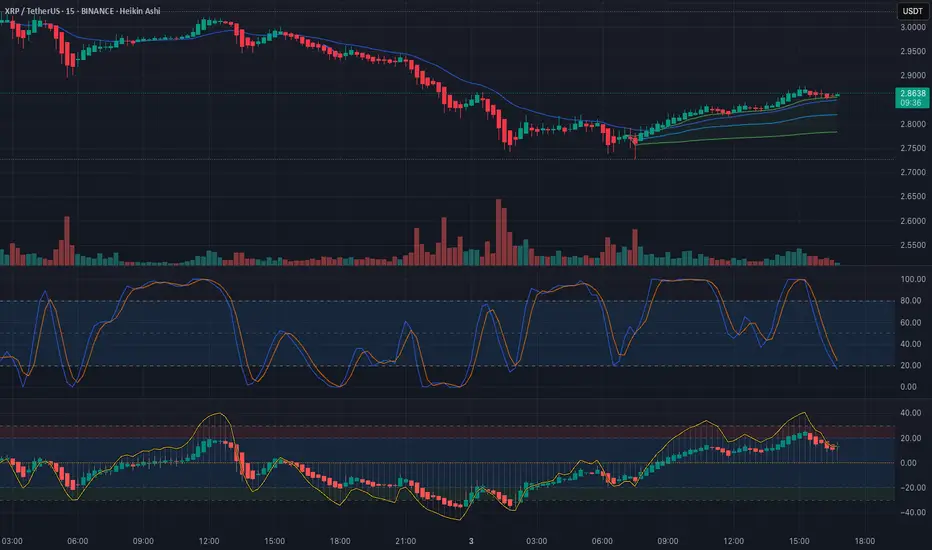
XRP 30M Strategy Trade Nets 10.1% GainThe MACD Liquidity Tracker Strategy caught a strong 10.1% move on XRP’s 30-minute chart, entering on bullish momentum and closing near the peak. The rally aligned with overbought Stoch RSI conditions, signaling potential exhaustion before price turned lower. Post-exit, momentum flipped bearish, confirming a timely close.
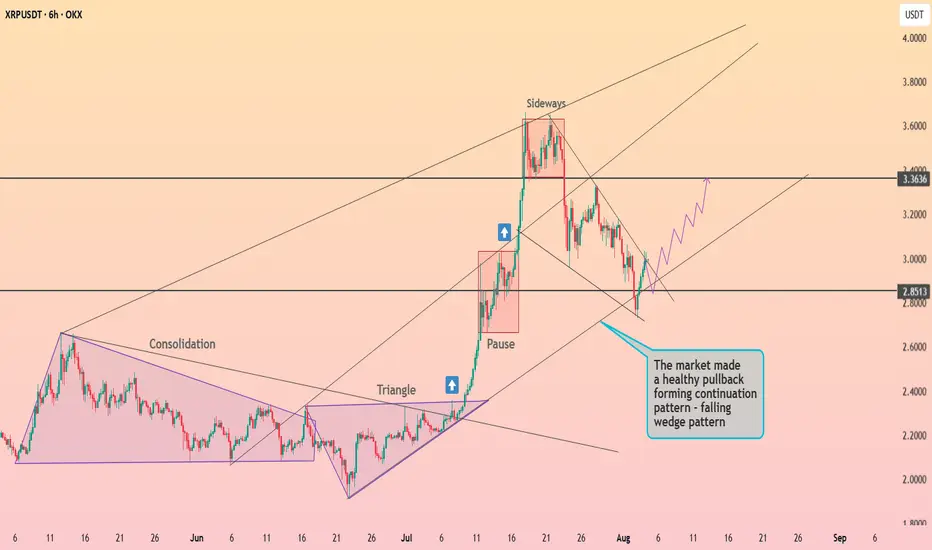
XRP is preparing to exit the wedge ┆ HolderStatOKX:XRPUSDT is forming a falling wedge after a sharp breakout and pullback. Price is stabilizing near $2.85, a key former resistance level. If bulls reclaim momentum here, a move toward $3.36 becomes a high-probability scenario.
XRP 1D – Major Support Bounce Inside Channel, Will Range Hold?XRP just defended a critical long-term support zone near $2.70 — aligning perfectly with the mid-channel range and previous breakout level. After rejecting from multi-month resistance around $3.15, price has returned to structure for a potential higher low.
🔹 Structure & Range
The macro channel (white lines) has guided price action for over 9 months.
XRP recently tagged the upper boundary, rejected, and pulled back into support around $2.70.
This zone was tested multiple times historically — it now serves as a pivot for continuation vs. reversal.
🔹 Momentum Signal
The Stoch RSI is printing a bullish cross from oversold — a classic confluence for reversal setups.
If the support zone holds, we could see price attempt another run at the $3.15–$3.30 resistance and eventually challenge the upper trendline.
🔹 Macro Outlook
Holding this structure = bullish midterm continuation.
Losing it opens the door for a drop back toward $2.00–$2.25, where the lower channel support sits.
Will XRP defend this channel — or is a breakdown back to $2.00 inevitable?
Drop your analysis in the comments 👇

Scalp Setup at Key Support – Reversal or Breakdown?Description:
Price is currently testing a strong intraday support zone, where previous wicks have shown reactive buyers stepping in. However, momentum is weakening, and volume shows signs of exhaustion. This could lead to either a quick reversal bounce or a clean breakdown, depending on how the next few candles close.
I'm watching this zone closely for confirmation:
Long bias if bullish engulfing confirms above the key line with momentum
Short bias if price breaks down, retests, and fails to reclaim support
This is a high-probability sniper zone where liquidity pools often trigger traps. I’ll enter only on confirmation — not anticipation. SL and TP are tight due to high leverage; discipline is key.
Expecting movement within the next 5–15 minutes on lower timeframes.
Comment if you're watching the same setup — let's see how it plays out.
$XRP UPDATE!CRYPTOCAP:XRP
After breaking out above the trendline and tapping resistance at $3.38, price is pulling back, and with the weekend ahead, we might see a healthy retracement toward the 0.5 Fib level around $3.05.
That zone is shaping up as a prime accumulation area, especially for those eyeing the next leg up.
If that level holds, XRP could easily reclaim momentum and push toward $4 and beyond.
This dip might be the perfect chance to load up before the next leg up.
#XRP
Is XRP doing it again?No need to complicate it, just look into it.
Will it reverse or what? Let's see.
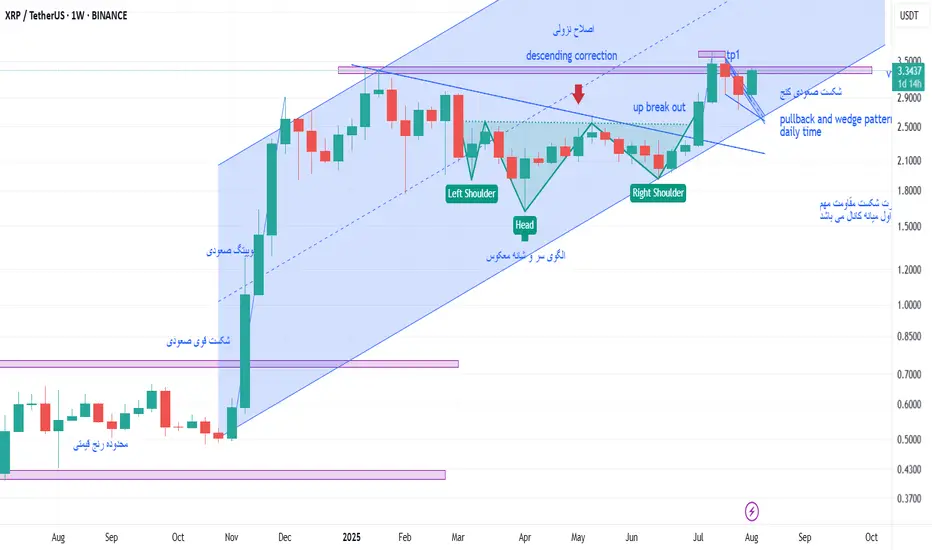
xrp weekly chartas we see total trend is ascending
tips :
1 after a midterm descending corretive trend it formed a head and soulder pattern which with macd positive divergence was a signal for the the end of correction
2 : by 7 july candle which is a strong ascending one the descending trend line was broken up and the buy signal was presented.
3 : when price reached to the vital static resistance made by candle 20 jan 2025 it stoped and formed a wedge pattern which is obvius on daily chart ,
4 : then we witness that the price broke up the wedge and now it is testing the static resistance level .
if it can break up that static resistance level I believe the first target price will be channel midline.
so we are waiting for closing weekly candle and starting new one , and for better decision we should control daily chart .
thank you
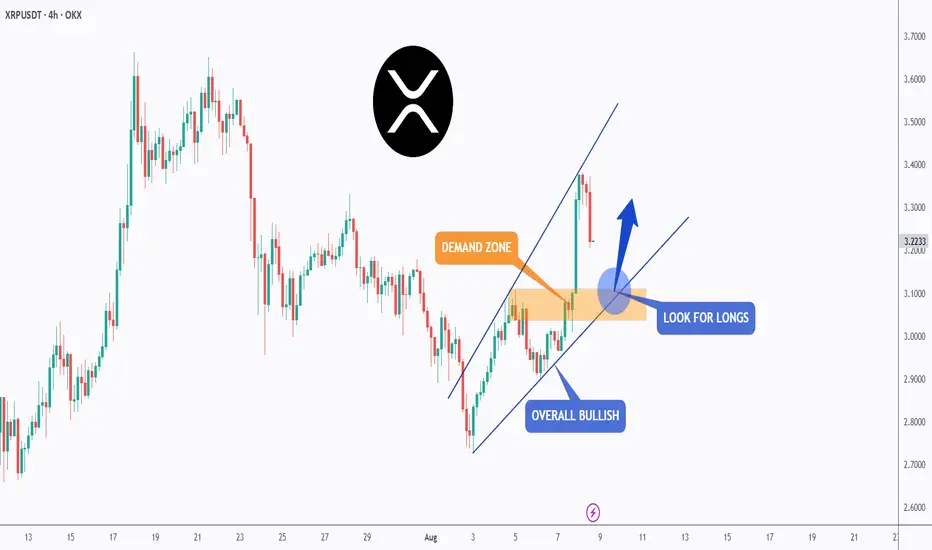
XRP - Wait for It!Hello TradingView Family / Fellow Traders. This is Richard, also known as theSignalyst.
📈XRP has been overall bullish trading within the rising wedge pattern marked in blue, and it is currently retesting the lower bound of the wedge.
Moreover, it is retesting a strong demand zone marked in orange.
🏹 The highlighted blue circle is a strong area to look for buy setups as it is the intersection of the orange demand zone and lower blue trendline acting as a non-horizontal support.
📚 As per my trading style:
As #XRP retests the blue circle zone, I will be looking for bullish reversal setups (like a double bottom pattern, trendline break , and so on...)
📚 Always follow your trading plan regarding entry, risk management, and trade management.
Good luck!
All Strategies Are Good; If Managed Properly!
~Richard Nasr
XRP/USD 1:4 RRBullish sentiment targeting ATH
Bouncing off break and retest of downtrend
LIQ swept already, feels like the bottom is in and ready for another leg up
Lets see....

XRP ANALYSIS🔮 #XRP Analysis - Update 🚀🚀
💲 We can see that there is a formation of Falling Wedge Wedge Pattern in #XRP and we can see a bullish movement after a good breakout. Before that we would see a little retest and and then a bullish movement.
💸Current Price -- $2.9130
📈Target Price -- $3.1290
⁉️ What to do?
- We have marked crucial levels in the chart . We can trade according to the chart and make some profits. 🚀💸
#XRP #Cryptocurrency #Breakout #DYOR
