XRPUSDT trade ideas
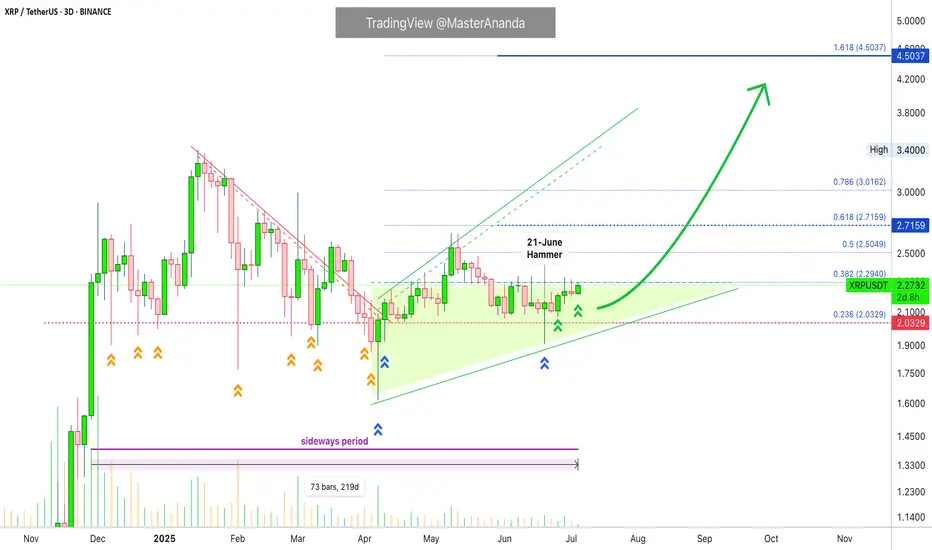
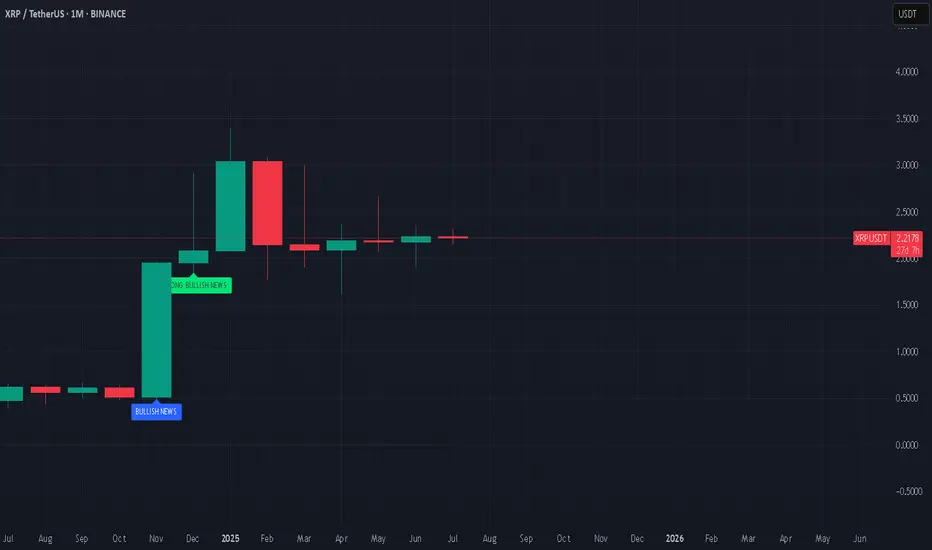
XRP $2 Support Updated, Tested 12 Times & When BullishThere is one number, a price level, that defines XRP's current situation. Either bearish or bullish depends on this number: $2.
As long as XRPUSDT trades above $2, we know the bulls have the upper hand and the bullish bias is confirmed.
If XRPUSDT moves and closes below $2, we know the bulls are losing momentum, the bears are gaining the upper hand and lower prices are possible.
What is the current situation?
XRP continues to trade above $2 and this price continues to be left behind, meaning, the bulls are winning.
Before 7-April, this level was tested over and over, again and again. After 7-April, only two challenges and the last one, 21-June, ended as a perfect bullish hammer. Now the action is moving higher toward resistance, growing not lower. $2 has been confirmed as support.
Now that support has been confirmed, we can expect additional growth. It can take some time, maybe a few days but the bulls are in control.
It can take some time, not that long, the market has been sideways for more than 7 months. This is a long-time and no more is needed. The consolidation period just reached its end.
The final low happened late last month, Crypto is set to grow; XRP will be doing great in a matter of days. Closer than anything you can think or expect, next week can be boom, sellers are exhausted. People are back to work.
Thank you for reading.
We are about to experience a growth explosion.
Namaste.
XRP wants to ripCould happen faster than anticipated, and the pullbacks could be a little deeper.
Those are the levels I will be watching regardless of pace.
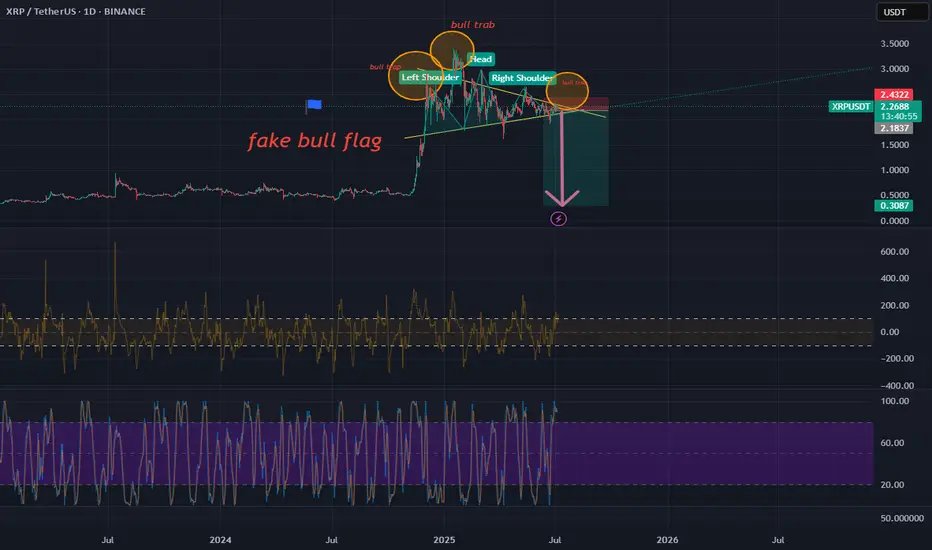
XRP is setting up fake bull flag ! SHORT TO USD 0,30 The meaningless bullish formation seen specifically for XRP is actually a big trap. This big bullish pennant formation that is being drawn is actually a big trap. I expect a very clear short position in XRP along with ETH.
This is a personal study for educational purposes. It is never investment advice. Please do your own research.
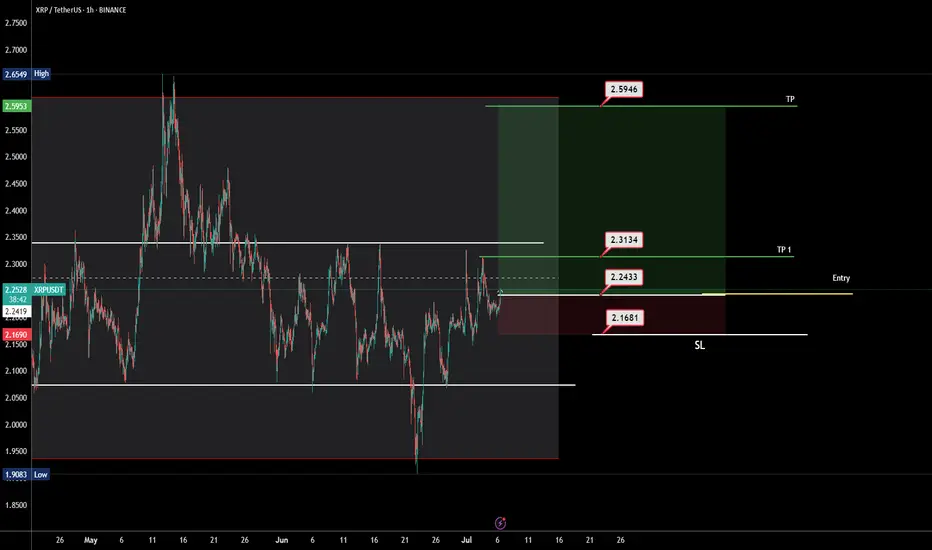
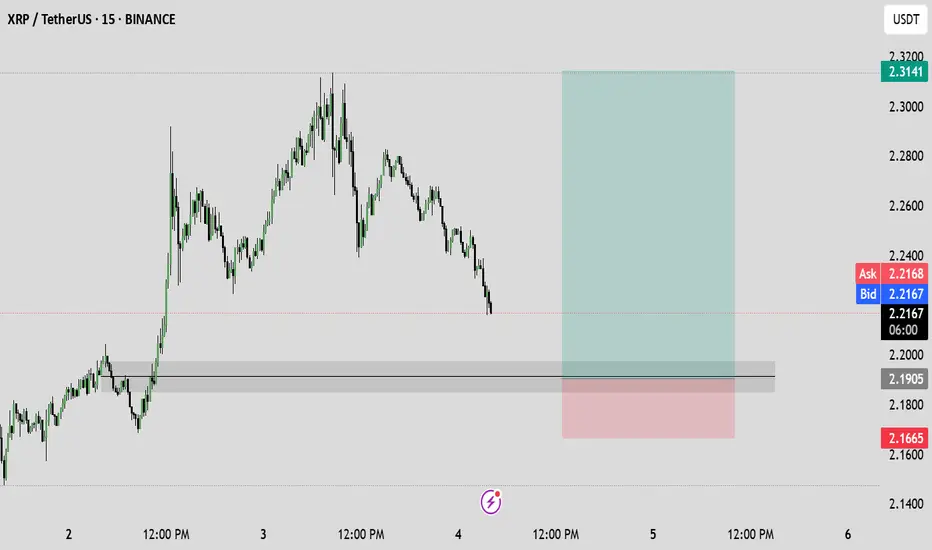
XRP LONG
I am thinking of a couple of days swing trade.
I am waiting for a long breakout in the sideways channel near the previous highs with TP1 and SL drawn IN. TP2 is at the top of the sideways trend channel.
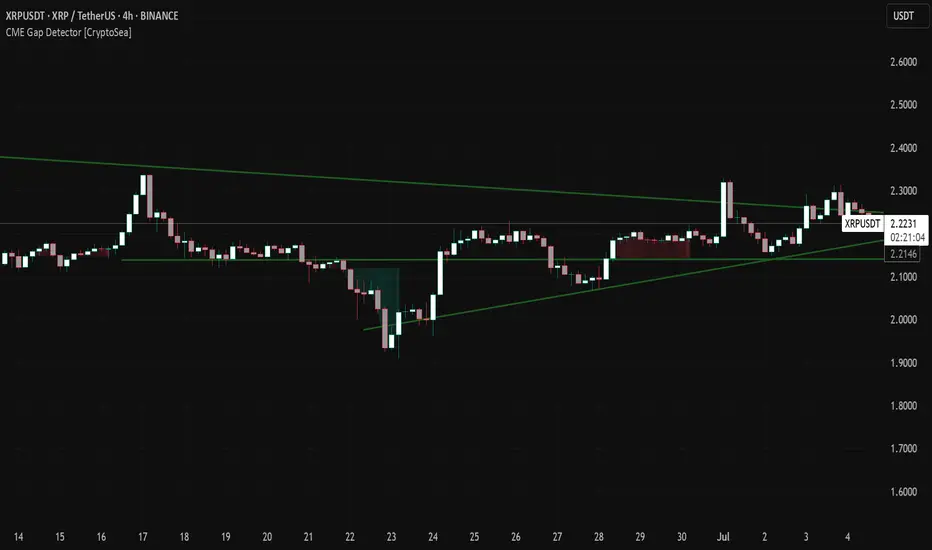
XRP rise to 2.32 or total surge to 2.52 or back to 2.15....Hello Losers and Winners, I am Bob, long time TV ideas listener first time poster here goes:
XRP has been capitulating for maybe three days now between price 2.20 - 2.225-ish price. I see need for XRP to reduce itself to 2.15 (local cme) then to hopefully bounce and hopefully in coming 24 hrs. Alternatively stays capitulating or even bumps from here, who knows, it is a completely unpredictable coin and I love it so. (but for that reason you need bets either way):)
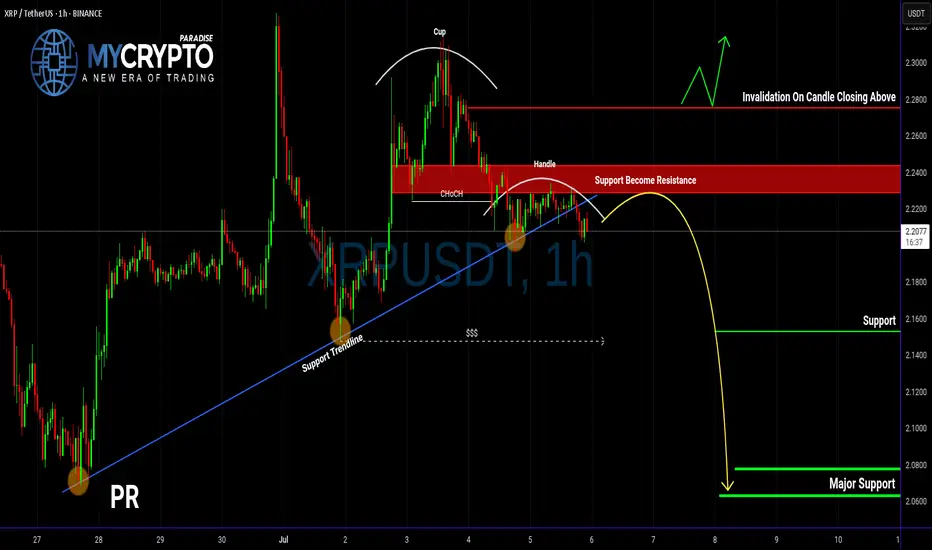
XRP Breakdown Ahead? Don’t Get Caught LongYello, Paradisers! Are you about to fall into a classic trap on XRP? The signs are stacking up, and if you're not careful, this move could catch a lot of traders on the wrong side of the market.
💎XRPUSDT is showing clear signs of weakness. A bearish CHoCH (Change of Character) has formed, and an inverse Cup & Handle pattern is currently playing out. On top of that, price action has decisively broken below the key support trendline. These signals together significantly increase the probability of a deeper bearish move in the coming days.
💎From the current price level, XRP is offering a 1:1 risk-to-reward setup. While this may attract more aggressive or short-term traders, the safer and more strategic approach is to wait for a proper pullback before entering. That would allow for a more favorable risk-to-reward and confirmation of the trend direction, reducing the likelihood of being caught in short-term noise.
💎It’s also crucial to watch the invalidation level. If XRP manages to break back above that zone and close a candle above it, this would invalidate the current bearish idea entirely. In such a case, it's better to stay patient and wait for clearer price action before making any decisions.
🎖Strive for consistency, not quick profits. Treat the market as a businessman, not as a gambler.
MyCryptoParadise
iFeel the success🌴
XRPUSDT Technical Analysis – Ripple at a Key Decision Point!🚀 XRPUSDT Technical Analysis – Ripple at a Key Decision Point!
As expected from our previous analysis, XRP has respected the bullish structure and is now hovering right on its ascending trendline. If the price holds this level and confirms bullish signals, a strong upside move may follow.
🔹 Upside Targets:
Key resistance levels to watch are 2.3410 and 2.3690. A breakout above these zones could push XRP toward 2.4500 and then 2.5122.
🔻 Bearish Scenario:
If the trendline breaks down, XRP may revisit previous support zones at 2.1778, 2.1422, and possibly 2.1020.
🎯 Stay tuned for updates – we deliver precise and strategic charts to help you stay ahead of the market.
👉 Follow for real-time crypto insights and smart trading setups!

XRP Fundamental Drivers:
Growing institutional interest, including potential ETF approvals, is boosting sentiment.
Macro tailwinds such as a weakening US dollar and easing Federal Reserve rate expectations may support crypto prices, including XRP.
XRP’s role in cross-border payments and partnerships continues to underpin its use case.
THIS COIN HAS FUTURE.
#XRP

Will Ripple "leave a dent in the universe"?They called us crazy, when we bought xrp at the bottom, in the midst of court cases. What they don't see is that, many TODAY major companies that changed the world (e.g. Apple, Amazon, MSFT etc.) had long term court cases with the SEC before "leaving a dent in the universe". In our opinion, Ripple is next in line.
#xrp #crypto #bitcoin #ripple #banking #blockchain #finance #money #stablecoin #financialsystem
HolderStat┆XRPUSD forms an ascending structureBINANCE:XRPUSDT is forming a stair-step bullish pattern after breaking out of consolidation above 2.12. The current trajectory suggests continued movement toward 2.70, with multiple support bounces validating the structure. Price action remains favorable for bulls.
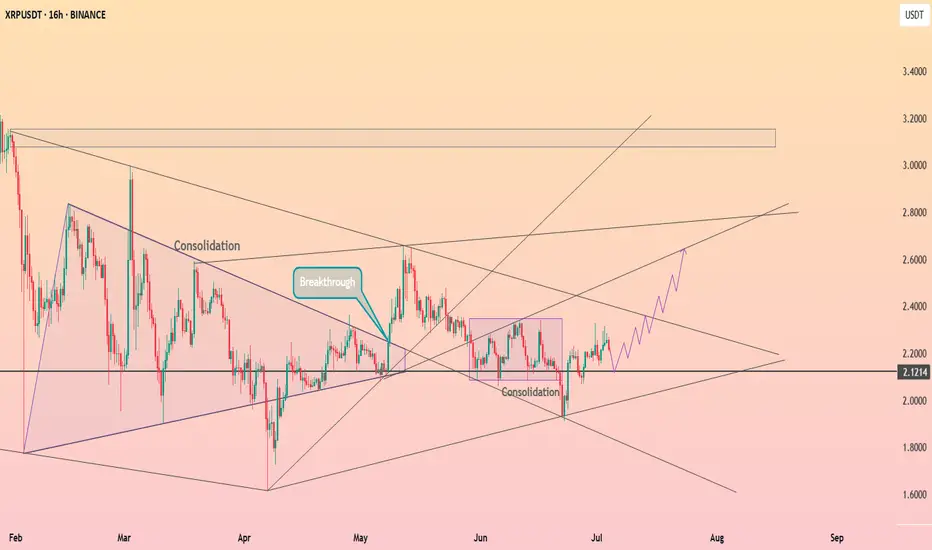
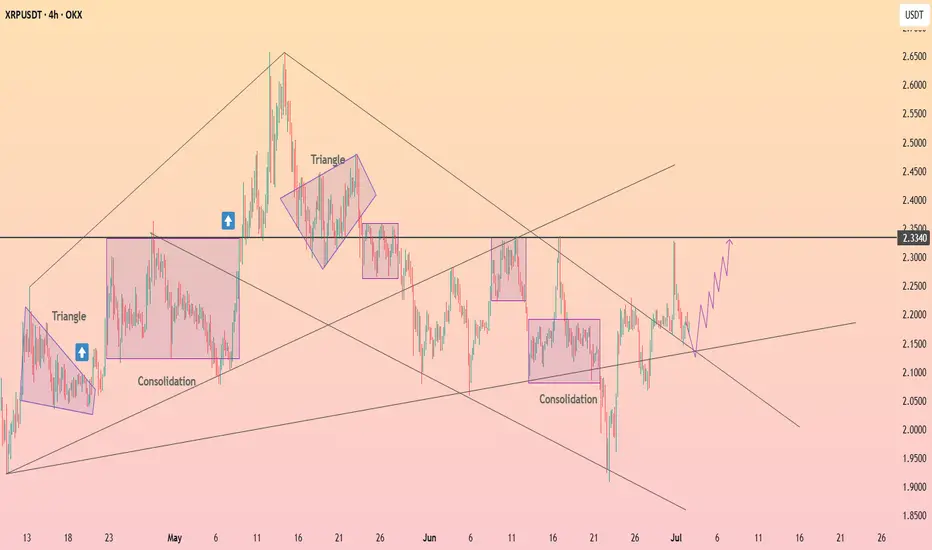
HolderStat┆XRPUSD forming the rising bottomBINANCE:XRPUSDT has broken above resistance and is consolidating above the breakout zone. This mirrors previous triangle–consolidation patterns that preceded upside moves. If momentum continues, a run toward 2.34 is in play.
XRP 4H TIMEFRAME ANALYSISXRPUSDT strcuture shifted into bullish after CHoCH, Thats why I have marked OB+FVG as POI for long.

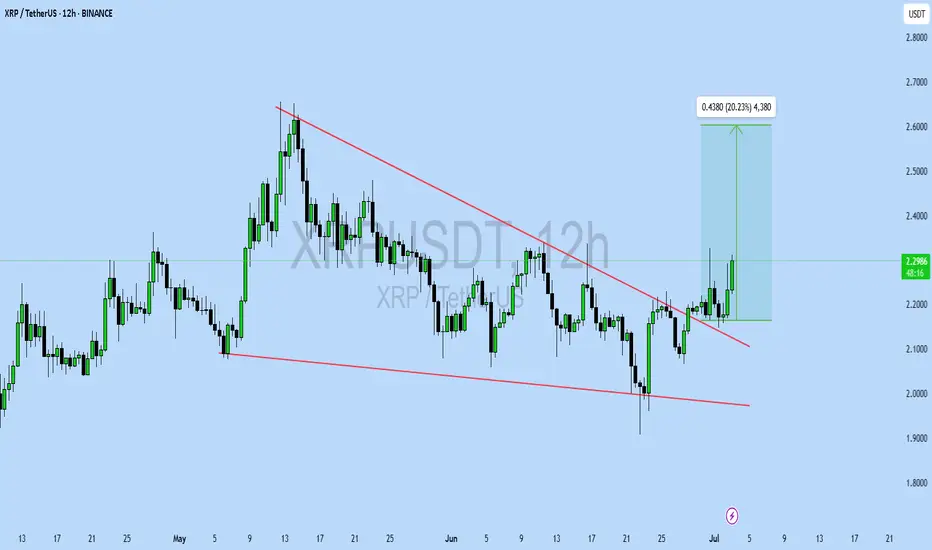
XRPUSDT UPDATE
Pattern: Falling Wedge Breakout
Current Price: \$2.2983
Target Price: \$2.60
Target % Gain: 20.23%
Technical Analysis: XRP has broken out of a falling wedge on the 12H chart with strong bullish candles and a volume surge, indicating momentum. The measured move targets a 20% gain from the breakout zone.
Time Frame: 12H
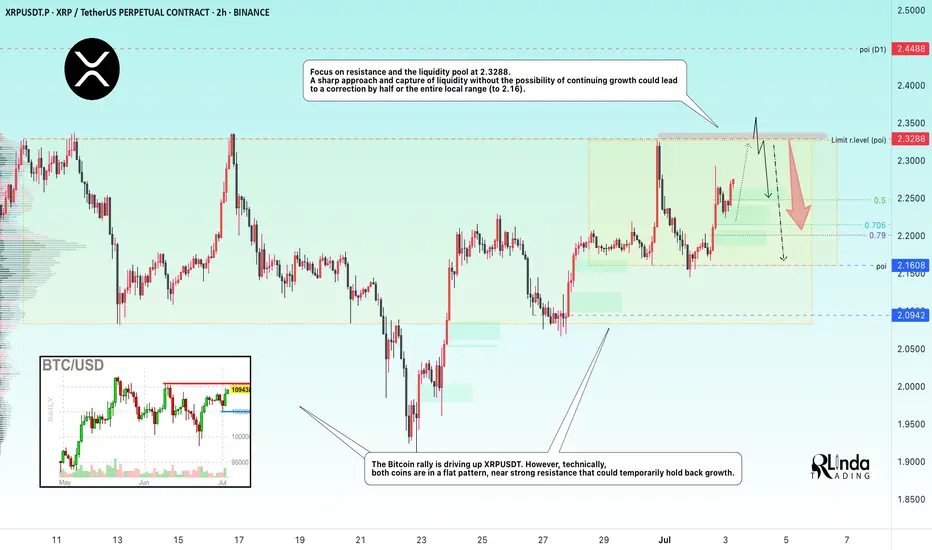
XRPUSDT → Resistance retest. Coin inside the flatBINANCE:XRPUSDT is rising towards resistance at 2.3288 due to a shift in the fundamental background to positive and a rally in Bitcoin, but there is always a but...
On the daily chart, XRP is trading below strong trend resistance, and there is also a fairly strong and voluminous liquidity pool at 2.3300 ahead, which could provide strong resistance. Bitcoin is also approaching its critical level of 110500, which may temporarily hold back growth, and a correction in the flagship could trigger a correction in the rest of the market...
Focus on resistance and the liquidity pool at 2.3288. A sharp approach and capture of liquidity without the possibility of continuing growth could lead to a correction by half or the entire local range (to 2.16).
Resistance levels: 2.3288, 2.357, 2.45
Support levels: 2.25, 2.213, 2.16
If the retest of resistance at 2.3288 ends in a false breakout, then subsequent consolidation below the level could trigger a correction to the above support and interest zones.
Best regards, R. Linda!

XRP — Liquidity Sweep & Range Play1. Wait for sweep into demand (2.07–1.95)
2. Enter long on SFP/bullish confirmation
3. Target: 2.33 (equal highs)
4. Stop: below demand zone
5. If stop triggered — next watch 1.77 for triple tap setup

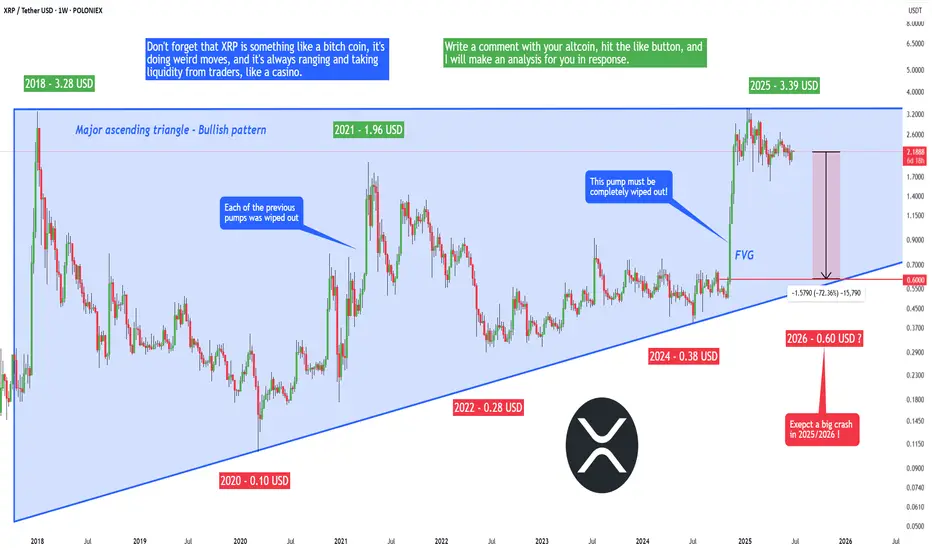
XRP Army - prepare for a 72% crash to 0.6 USD! (lifetime chance)The current price of XRP is 2.19 USD, and I predict a big crash in 2025/2026 to 0.6 USD. Yes, I know you may think that that's completely impossible, especially if you are high on your XRP holdings, but I can assure you that this is going to happen! What can you do?
If you are a hodler, then you need to prepare for your portfolio to drop by 72%. Can you really handle this situation? If not, you need to take some action.
If you are a trader and you still speculate on the price increase, you can consider exiting your position. If you bought before the huge pump, take your profit now.
If you are a trader and you bought after the pump, that means at the TOP, you basically FOMOed-IN. It's time to take a small loss or exit your position at break-even. If you found yourself in one of the situations above, you have some work to do. And you need to do the work as soon as possible, before XRP starts crashing, which can be any day now. Otherwise, I strongly recommend entering a short position on futures on a strong resistance if you want to make money on XRP.
Now, importantly, why do I think XRP will crash? Technically, XRP is in a big range and has been in a range since 2017. Nothing changed at all after the pump; the price is still inside this ascending triangle. After the huge pump, the price created a big FVG (Fair Value GAP), and historically this has been a big issue for XRP because we went down each time and wiped out the GAPs. Don't forget that XRP is something like a bitch coin, it's doing weird moves, and it's always ranging and taking liquidity from traders, like a casino. Smart traders can take advantage of it and trade it, but you need to have a strategy. Right now it's obvious that XRP is going to go down in the next months!
Write a comment with your altcoin + hit the like button, and I will make an analysis for you in response. Trading is not hard if you have a good coach! This is not a trade setup, as there is no stop-loss or profit target. I share my trades privately. Thank you, and I wish you successful trades!
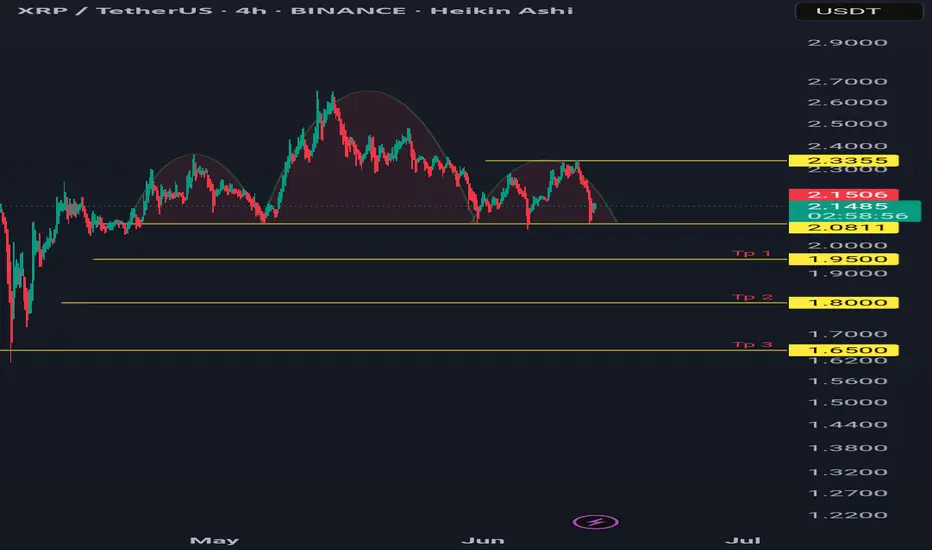
Xrpusdt 4hr tf bearishA bearish head and shoulders pattern is forming.
If it closes below 2.0811 on the 4-hour timeframe, the pattern may be activated.
Targets are 1.95, 1.80, and 1.65.
Invalidation occurs if the high of the right shoulder (2.3355) is broken.
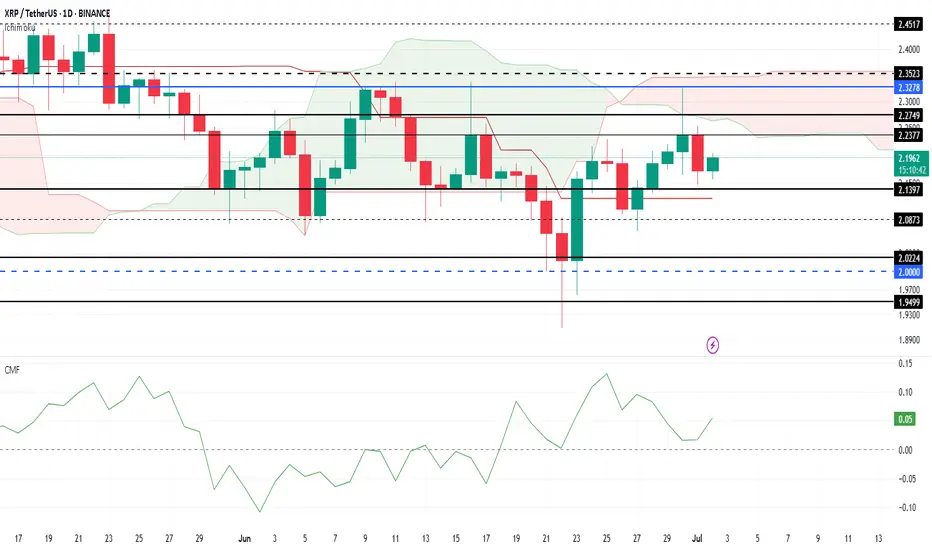
XRP Price Today: Rising Outflows Hinder RecoveryXRP has experienced notable volatility throughout June, with the altcoin failing to break through the $2.32 resistance level. Despite multiple attempts, XRP remains consolidated below this critical price point.
This price action indicates a lack of bullish momentum in the short term, making further gains challenging unless the resistance is breached.
The Ichimoku Cloud is turning negative , suggesting that bearish momentum could intensify for XRP. With the cloud positioned above the candlesticks, it signals further pressure on the price.
Additionally, rising outflows are visible on the CMF, as the indicator moves closer to the zero line, adding to the negative outlook.
If selling pressure continues to mount, XRP could fall below its support at $2.13 , potentially slipping to $2.02. This would mark a significant decline and invalidate the bullish thesis, signaling that XRP’s upward momentum could be at risk in the near future.
When Holding is Suicide, Hope Is a KillerStill holding… just waiting for it to come back?
You’re not alone. Most traders enter with confidence and exit with fear. But in some situations, holding isn’t strategy — it’s just slow motion account suicide.
If you’ve ever lost sleep after refusing to close a position, this one’s for you.
Hello✌
Spend 3 minutes ⏰ reading this educational material.
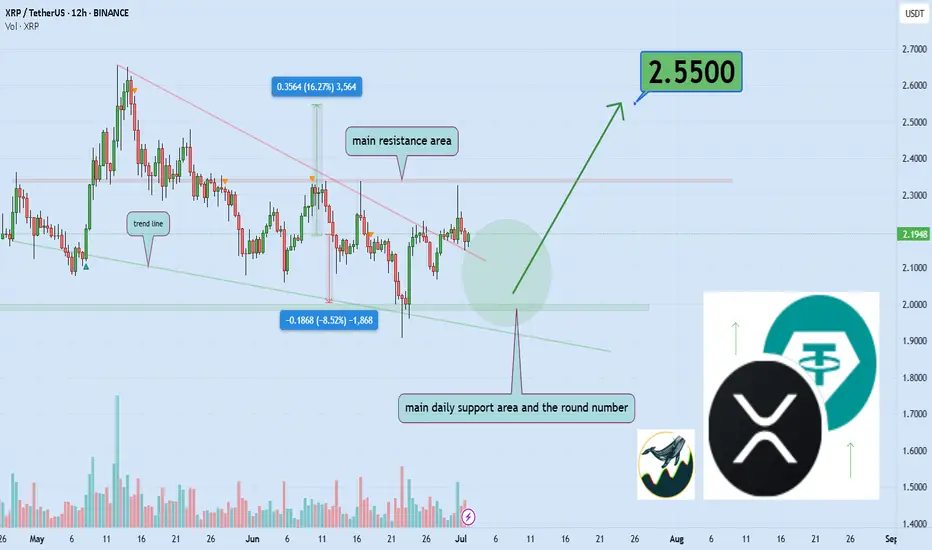
🎯 Analytical Insight on XRP:
XRP is approaching a major daily support zone, aligned with the psychological level of $2.00. This area has historically provided strong buying interest. A potential rebound from this level could lead to a minimum upside of 16%, with a medium-term target around $2.55. 📈
Now , let's dive into the educational section,
🚩 Still Holding? It’s Probably Not About the Chart Anymore
The biggest lie traders tell themselves:
“It’ll bounce back… just give it time.”
But in reality:
Holding a loser drains your mental capital more than your actual balance
The longer you wait without data, the more emotional your decisions get
The market doesn't care about your entry, your hope, or your patience
As they say in trading:
Hope is not a strategy.
And often, it’s the fastest way to wreck your capital quietly.
📊 TradingView Tools to Know When Holding Is Dangerous
Sometimes, charts whisper before they scream. These 4 tools on TradingView help you see when "holding on" is no longer a smart move but a trap. Let’s break them down and make them practical:
1. Volume Profile
This shows you exactly where most buying and selling occurred. If price drops below the highest volume zone, it means conviction is gone.
How to use it:
Right click the chart → Add Indicator → Select "Volume Profile Fixed Range" → Drag across the last trend leg.
2. RSI Divergence
Still holding while RSI shows bearish divergence? That’s a red flag. It signals trend exhaustion.
How to check:
Apply RSI 14. If price makes a higher high but RSI makes a lower high, you're likely holding into weakness.
3. Smart Money Concepts (SMC)
Look for Liquidity Grabs, Breaker Blocks, or Order Blocks. These reveal where big players exit often while you're still hoping.
How to find it:
Go to Indicators → Search “Smart Money Concepts” → Pick a high rated free version.
4. Session Volume / Ranges
If you’re stuck holding during sideways chop, your money is freezing.
How to identify it:
Add Session Volume or Range indicators. If you see price compressing without expansion, it’s not worth staying in.
🪤 5 Situations Where Holding Is Silent Suicide
The market is ranging with no true breakout in sight
Indicators are flashing weakness but you're still “waiting”
You’re only holding because exiting would feel like admitting failure
You missed the exit and now you’re emotionally attached
You fell in love with the fundamentals of a coin and lost objectivity
🧲 Greed vs Hope — Know the Difference
Greed wants more.
Hope just doesn’t want to lose.
Both will blind you from the truth on your chart.
📉 Real World Case: Holding Through a Pumped Altcoin
Last week, thousands held on to a hyped altcoin.
But here’s what the chart said:
RSI was overbought for 3 days straight
Momentum was fading on every push
Smart money exited and left retail praying
Result?
A 48 percent drop in 5 days.
The ones who held are still "hoping" today.
🧘 The Golden Rule of Holding
Before you decide to hold a losing position, ask yourself:
Is this based on actual chart structure or just denial?
Am I trying to avoid the pain of realizing a loss?
If I had no position, would I open this trade right now?
If the answer is no, it’s probably time to get out.
🧭 Final Take
Sometimes holding is wisdom.
Other times, it’s just avoidance wrapped in hope.
Use real data. Use real tools. Make real decisions.
And if it’s time to close that trade, do it before it drags you down deeper.
✨ Need a little love!
We put so much love and time into bringing you useful content & your support truly keeps us going. don’t be shy—drop a comment below. We’d love to hear from you! 💛
Big thanks , Mad Whale 🐋
📜Please remember to do your own research before making any investment decisions. Also, don’t forget to check the disclaimer at the bottom of each post for more details.
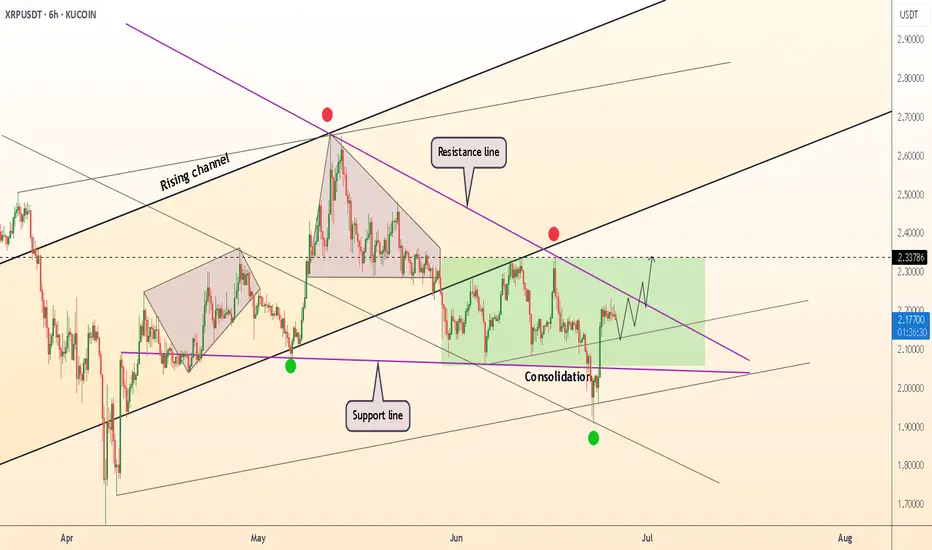
DeGRAM | XRPUSD in the consolidation zone📊 Technical Analysis
● A liquidity sweep to $2.00 closed back inside the six-week green range, printing a hammer on the rising-channel base—confirming the dip as a spring rather than a breakdown.
● Price is compressing against the purple April trend-cap; each pull-back now holds a higher low, and a box-range measured move projects a pop toward the dotted pivot at $2.34 and the channel median near $2.60 once $2.24 gives way.
💡 Fundamental Analysis
● Derivatives funding has flipped positive and cumulative OI on major venues is up ~10 % since 23 Jun, signalling fresh long positioning ahead of July’s SEC–Ripple status hearing.
✨ Summary
Buy $2.10-2.18; breakout above $2.24 targets $2.34 → $2.60. Bias void on a 6 h close below $1.98.
-------------------
Share your opinion in the comments and support the idea with a like. Thanks for your support!