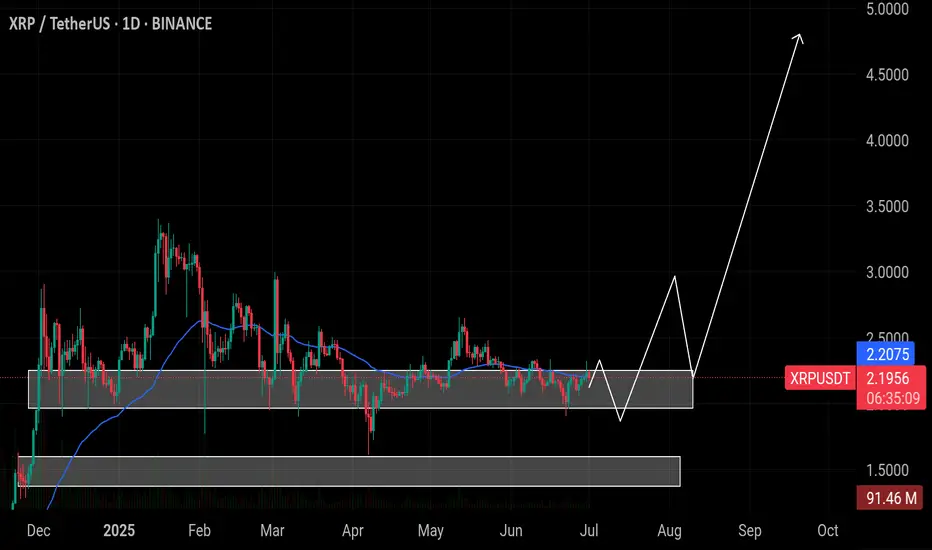
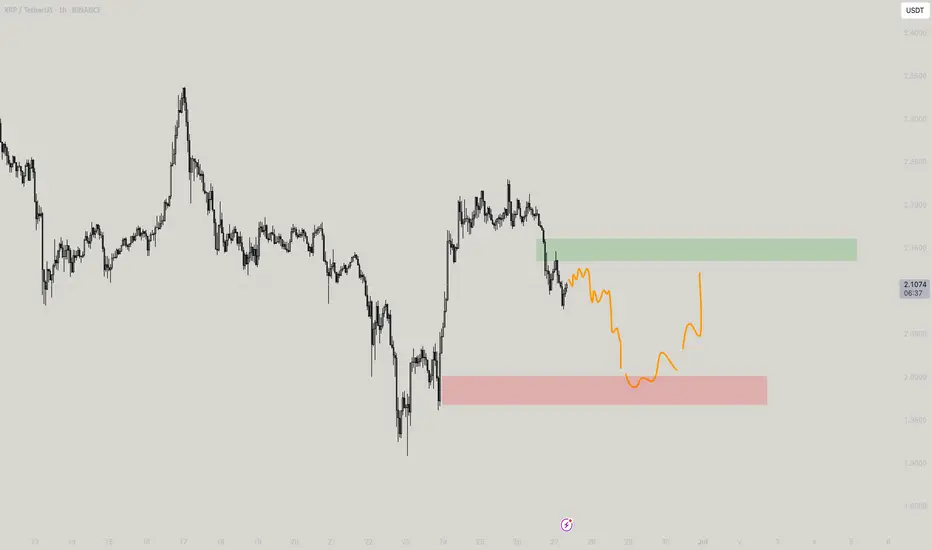
$XRP Keep an eye on the marked support zone... If price revisitCRYPTOCAP:XRP Keep an eye on the marked support zone...
If price revisits this range, it could offer a solid entry opportunity before the next major breakout toward the $3–$5 region.
XRPUSDT trade ideas
XRP Update ATH - T1 - 10% move Long | Potentially 100% mid JulyXRP is moving in the bullish channel. I believe we need 2 more touches:
1. Resistance Line
2. Support Line
Expectations 7-14 Days and the
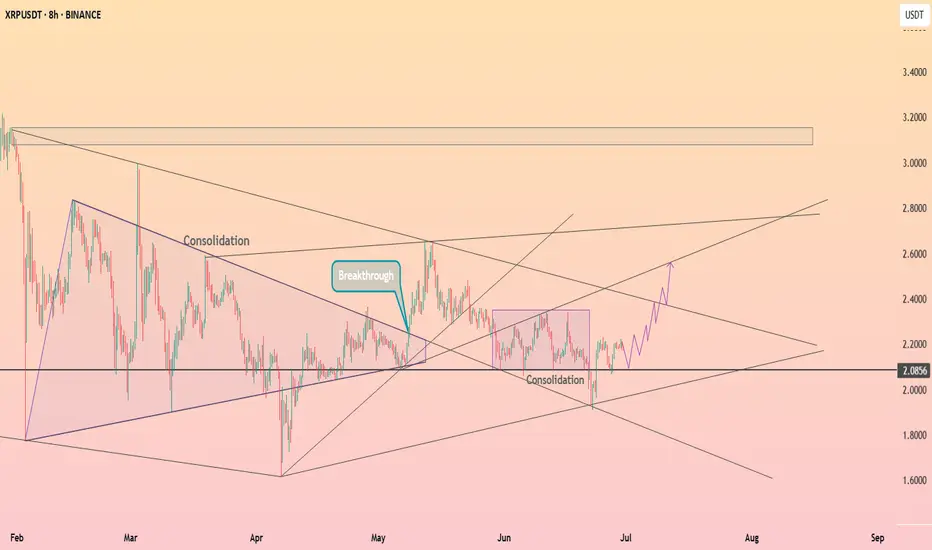
HolderStat┆XRPUSD before retest of the $2 levelBINANCE:XRPUSDT has rebounded from its 2.08 base and broken out of consolidation, aiming for the upper diagonal resistance near 2.40–2.60. With recurring bullish patterns and a history of strong follow-through after similar setups, momentum may build if 2.20 is cleared.
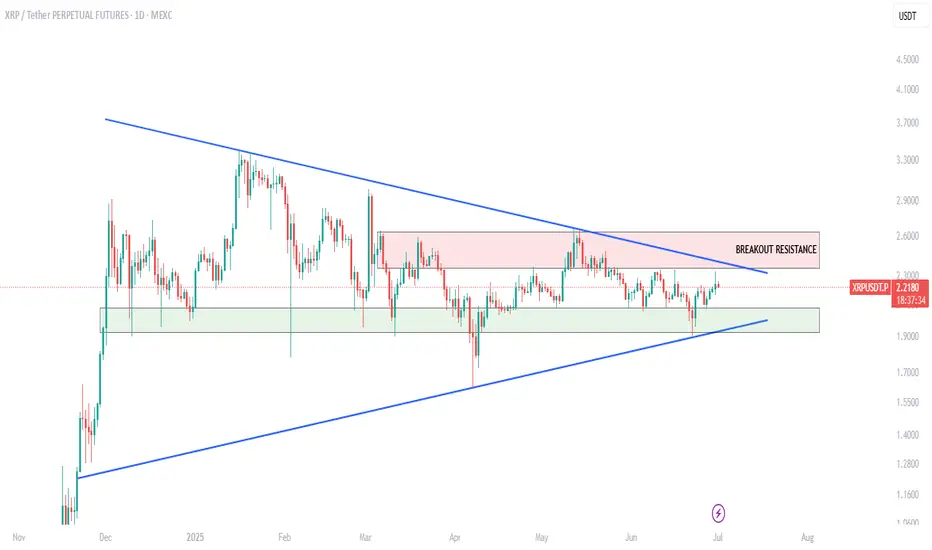
$XRP ALERTCRYPTOCAP:XRP price is pushing toward breakout resistance!
Don't FOMO in yet — confirmation comes above the red zone!
Break and hold above signals bullish continuation
Rejection could lead to a pullback to the demand zone!
Resistance zone: $2.35- $2.63
Support zone: $1.92 - $2.07
Patience brings profits!
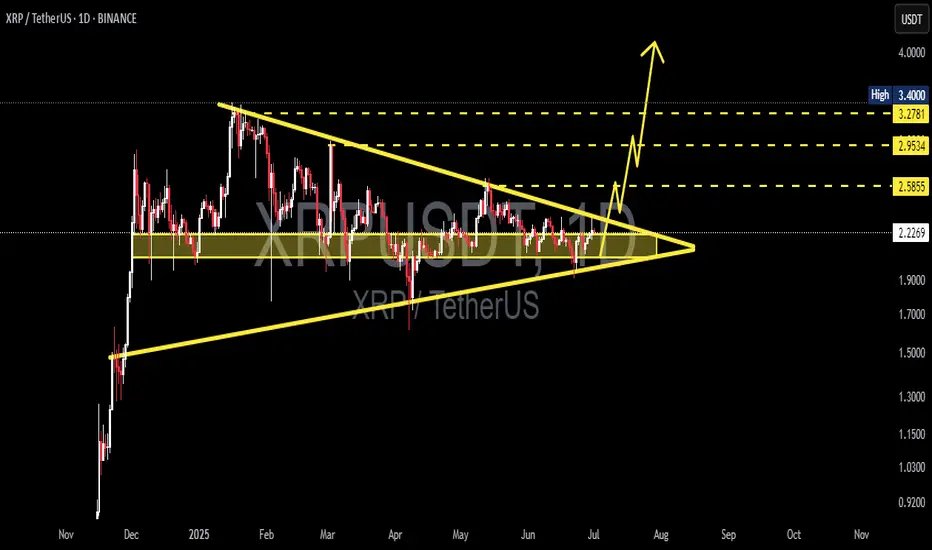
XRP/USDT Poised for Breakout from Symmetrical Triangle!Pattern Identified: Symmetrical Triangle
The symmetrical triangle is a consolidation pattern formed by a series of lower highs and higher lows, converging into a triangle shape. It reflects market indecision and often precedes a significant breakout, either upward or downward, depending on momentum and volume.
🔍 Pattern Description:
Upper Resistance Line (Descending): Connecting the lower highs since February 2025.
Lower Support Line (Ascending): Connecting the higher lows since December 2024.
Consolidation Zone: Price has been moving sideways within the triangle, indicating accumulation.
Critical Breakout Level: Around $2.23 — the price is currently testing this resistance.
📈 Bullish Scenario:
If the price successfully breaks above the upper triangle resistance with strong volume:
Target 1: $2.5855 (previous minor resistance)
Target 2: $2.9534 (key historical resistance)
Target 3: $3.2781
Maximum Target: $3.40 (local previous high and psychological level)
Breakout Confirmation: A daily candle close above $2.30 with significant volume could signal a long entry.
📉 Bearish Scenario:
If the price fails to break out and instead breaks down below the lower trendline:
Support 1: $2.00 (psychological & horizontal support)
Support 2: $1.85
Major Support: $1.55 (strong historical demand zone)
Breakdown Confirmation: A daily close below the lower triangle boundary with high volume would signal further downside.
📌 Summary:
XRP is nearing the apex of a symmetrical triangle — a major move is imminent.
A confirmed breakout could trigger a rally towards $3.40.
A breakdown may lead to a drop toward $1.55.
Recommendation: Wait for confirmation before entering long or short positions.
#XRP #XRPUSDT #CryptoBreakout #SymmetricalTriangle #XRPAnalysis #Altcoins #TradingView #TechnicalAnalysis #BullishCrypto #CryptoSignal
It reaches a maximum of $2.5 and then decreases to $1.5The price is rising in the lower timeframe. But it can eventually go up to $2.5 and then it will fall to the $1.5 range, which is -40%.
Please do not invest long-term in the downtrend
If you like, follow me to get better signals.
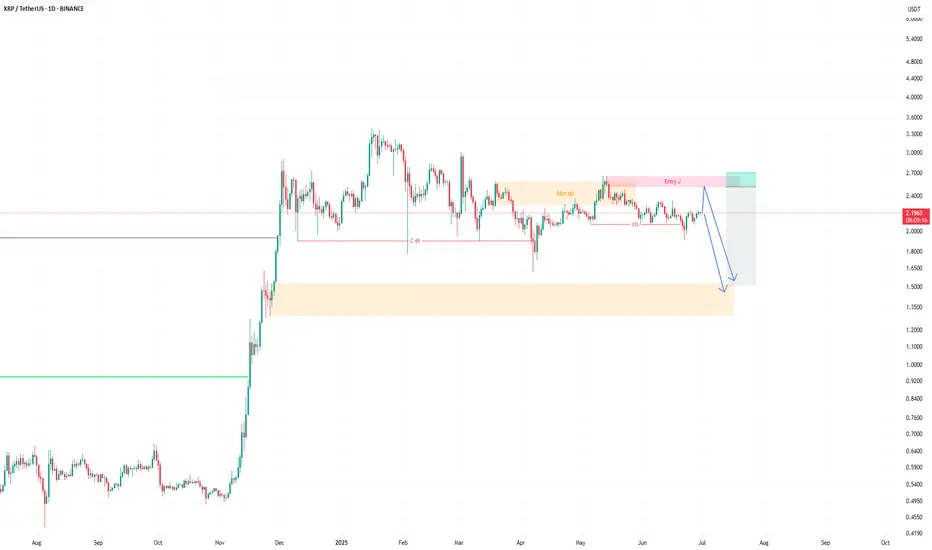
Weekly trading plan for XRPLast week's BINANCE:XRPUSDT price action followed our projected path but ultimately failed to reach the first target. The price now appears to be consolidating in a triangular pattern, so I've outlined two detailed scenarios. While further downside remains the primary expectation, a sharp breakout above the local high would delay the anticipated correction
Write a comment with your coins & hit the like button and I will make an analysis for you
The author's opinion may differ from yours,
Consider your risks.
Wish you successful trades ! mura

Ripple (XRP): Possible Smaller Bullish Movement IncomingRipple coin buyers are showing some strong volume where we might see another liquidity movement outside our sideways channel, which might give us potential 40% movement, but be careful, as on smaller timeframes we are seeing a possible H&S form.
More in-depth info is in the video—enjoy!
Swallow Academy

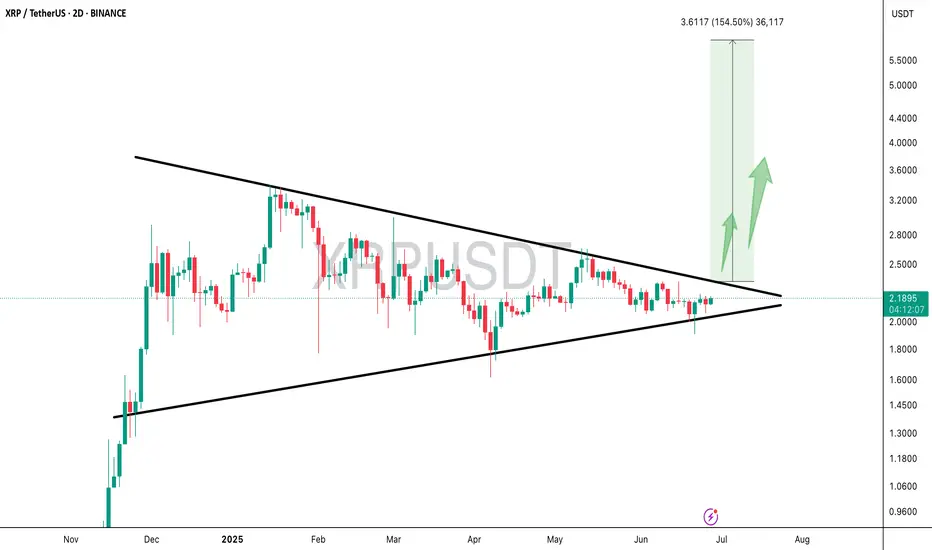
Breakout loading on $XRPBreakout loading on CRYPTOCAP:XRP 🚀
Accumulating heavily here as the price coils inside a massive triangle.
Q3 could be explosive, chart points to a breakout toward $4.60
Retweet if you're BULLISH !!
XRPUSDT 1D#XRP has formed a bullish pennant on the daily chart — keep an eye on it.
In case of a breakout above the pattern resistance and the daily MA50, the targets are:
🎯 $2.5067
🎯 $2.7175
🎯 $3.0177
🎯 $3.4000
⚠️ Always use a tight stop-loss to manage risk and protect your capital.

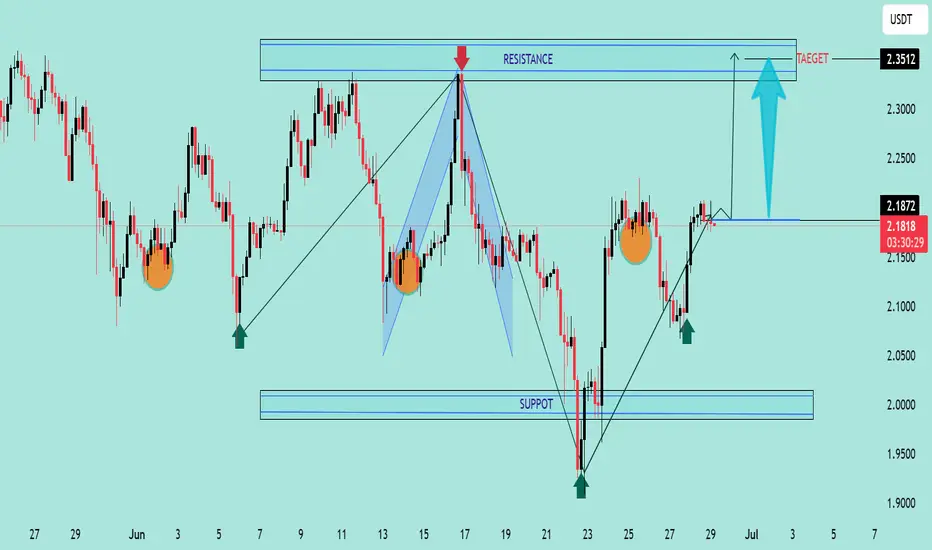
XRP/USDT Bullish Breakout Anticipation XRP/USDT Bullish Breakout Anticipation 🚀
Technical Analysis:
The chart illustrates a potential bullish setup for XRP/USDT based on price structure, support/resistance levels, and harmonic movements.
🔍 Key Observations:
Rejection From Major Support Zone (1.95 - 2.00):
Price previously tested a strong demand zone (marked as “SUPPORT”) and showed significant rejection with bullish candlestick momentum.
Series of Higher Lows ✅:
The price structure shows consecutive higher lows (green arrows), indicating rising buying pressure and bullish intent.
Break of Intermediate Resistance (2.15 - 2.18):
A breakout from the neckline area confirms bullish continuation. Price is currently retesting this level, turning resistance into support.
Target Zone at 2.35 - 2.36 🟦:
A clean target area marked by historical resistance and previous high (red arrow).
Projection indicates a possible move toward 2.3512 USDT, aligning with the measured move from the breakout structure.
Bullish Harmonic Pattern Completion 🔼:
The chart also displays a harmonic pattern completion near the recent low, suggesting a reversal point aligning with market reaction.
🎯 Trading Plan:
Entry Zone: Current retest around 2.15 - 2.18 is favorable.
Target: 2.3512 (as per projection and prior resistance zone).
Invalidation: Break below 2.10 and especially under the key support (2.00) would invalidate the setup.
📌 XRP/USDT is showing bullish strength as long as it holds above the breakout level. A sustained move could trigger momentum towards the 2.35 target zone. 💪📊
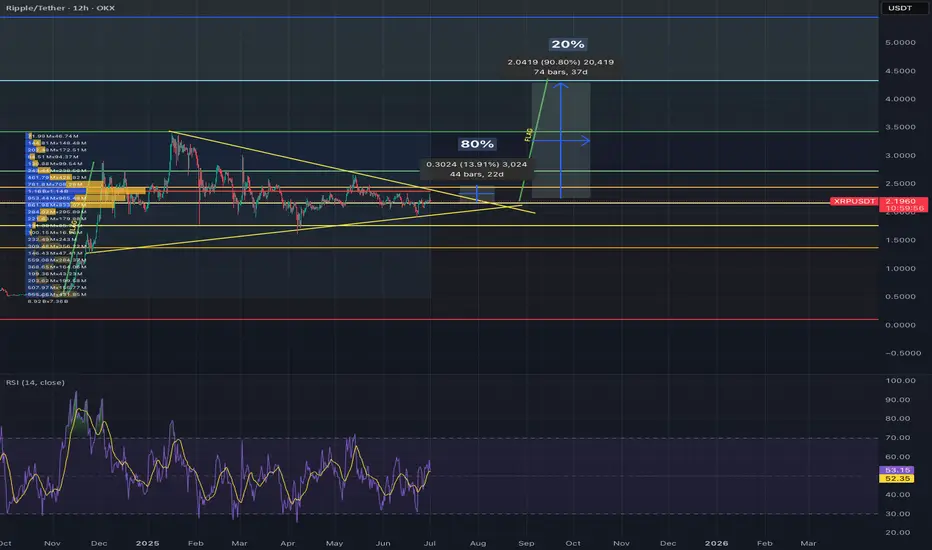
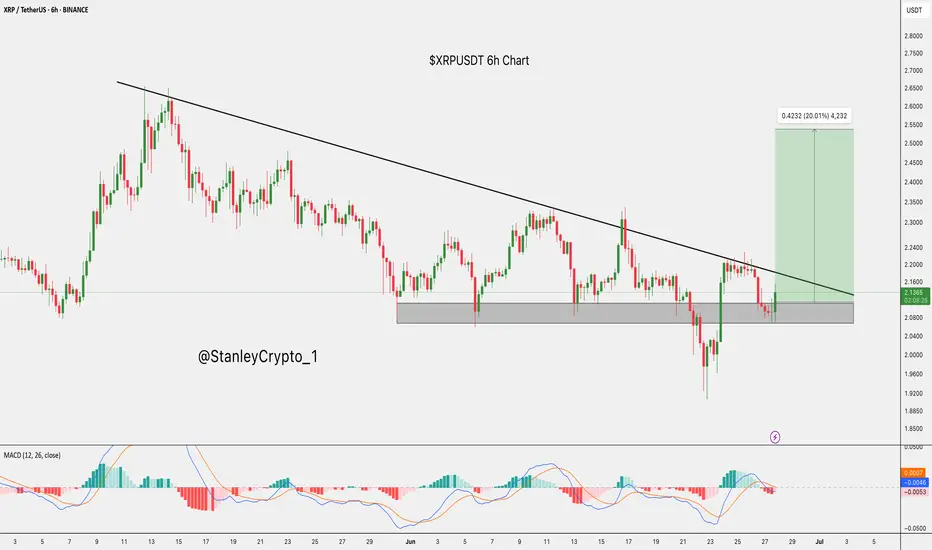
$XRP Breakout Loading: 20% Rally on the Horizon?CRYPTOCAP:XRP is showing strength after bouncing from a key support zone.
Price is pushing toward the descending trendline, and a breakout above it could trigger a 20% move toward $2.5376.
MACD is showing early bullish signs. Breakout watch is on!
DYRO, NFA
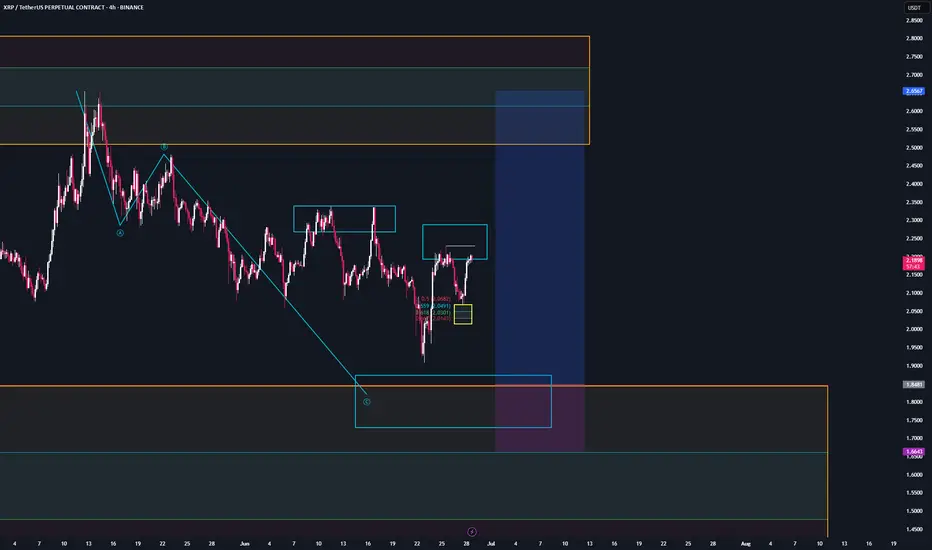
XRP - Trade SetupLocal Price Action:
We are in the area of the major trend reversal zone. Since the price has left the zone by more than its own size, the zone has been reactivated and is tradable again according to the System.
Macro Price
The 0.5 level of the major trend reversal zone overlaps with the bearish target areas on the hourly chart. If we reach this level, I will open another long position in $XRP."
An in-depth explanation of the XRP setupHi traders,
The thesis is explained in detail in this video!
CRYPTO:XRPUSD BINANCE:XRPBTC

XRP: The Next WaveHi traders,
In previous videos, I covered both LTF and HTF targets for BTC and ETH — everything is unfolding as expected. I'm now spotting growing opportunities on XRP, which is also reflected in the XRP/BTC chart.
Price action has respected a key volume area (VA), and the Head & Shoulders pattern is playing out nicely — each inflection point is being taken out. I'm patiently waiting for a potential LTF flag (correction) to form.
Although I normally avoid taking partials due to this being a swing idea — and considering swap fees on CFDs — I’m securing partial profits at each target.
I’ll be releasing a video soon to break everything down in full detail.
Onwards gang!
CRYPTO:XRPUSD BINANCE:XRPBTC

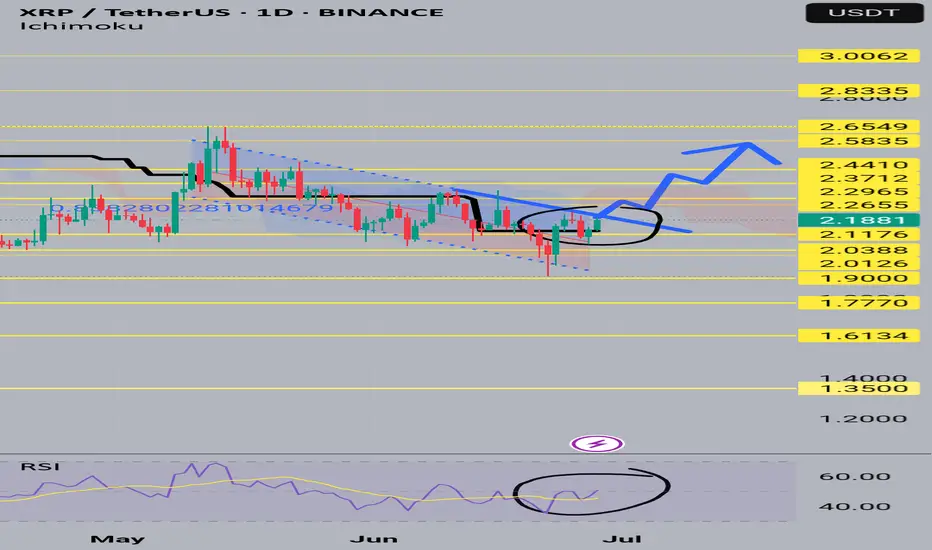
XRPUSDTHi snipers. The price of XRP has reached the channel ceiling on the one-day time frame and has also broken the black line, which is the 103-day moving average. The RSI is also in the neutral zone. As the price crosses the channel ceiling, expect significant price growth along with positive news. This is not a trading offer. I am learning and practicing. Good luck.
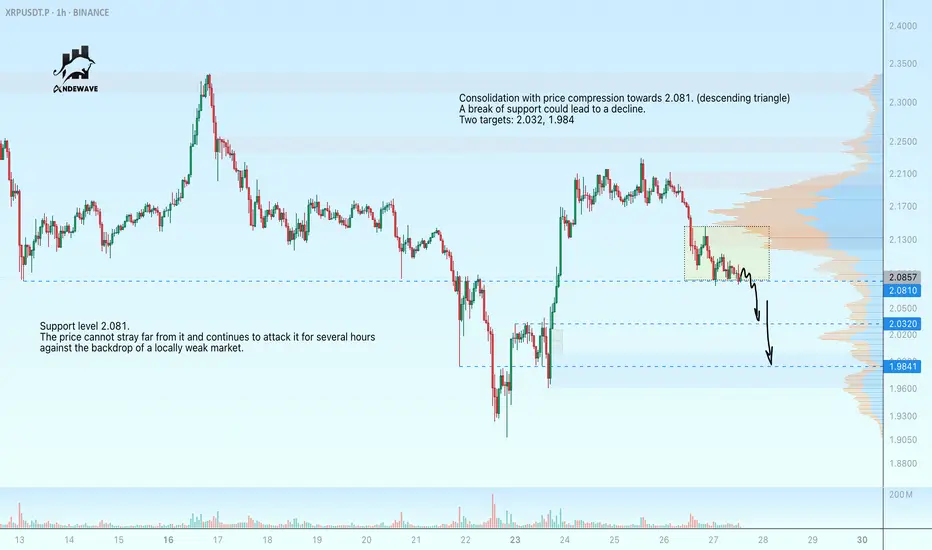
XRP is preparing to break through supportXRPUSDT is not yet ready for growth.
The important support level is 2.081. The price cannot stray far from it and has been attacking it for several hours amid a locally weak market.
Scenario: Consolidation with price compression towards 2.081. (descending triangle)
A breakout of support could lead to a decline.
Two targets: 2.032, 1.984
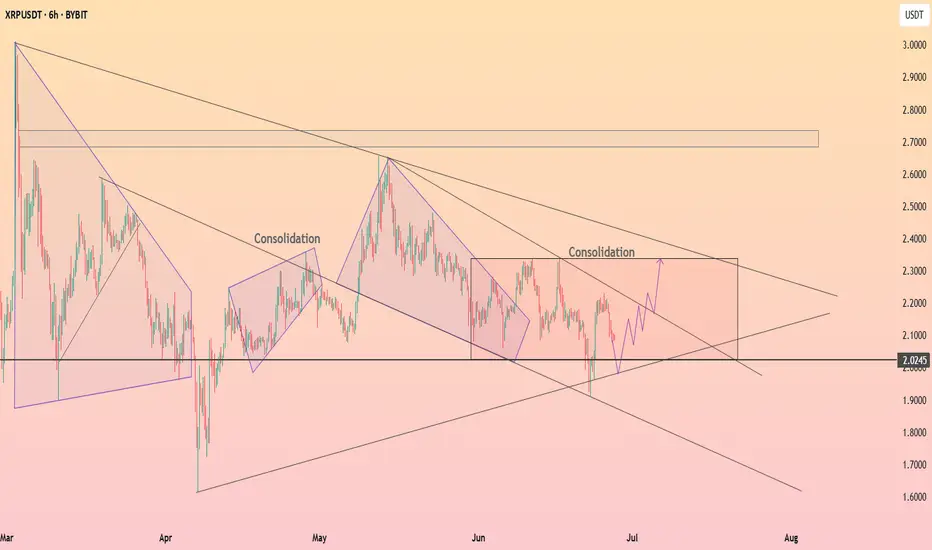
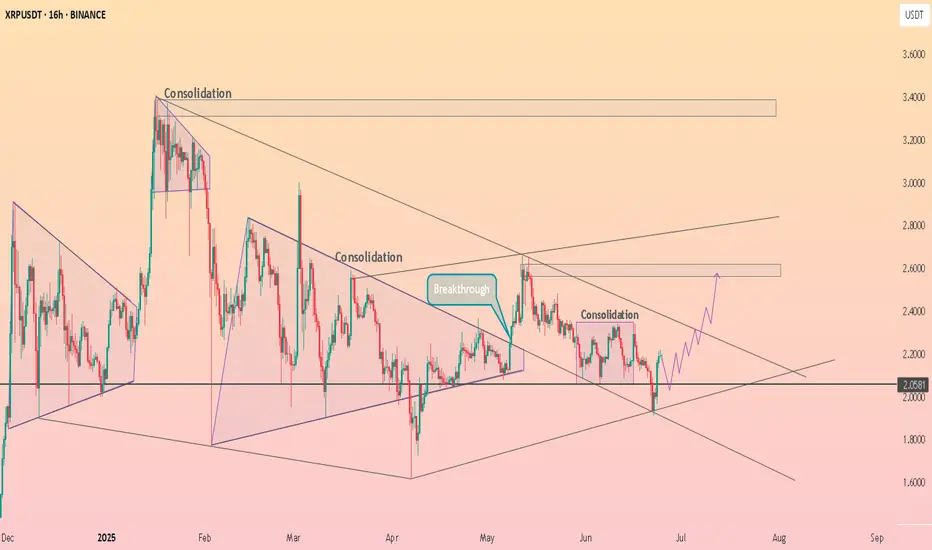
HolderStat┆XRPUSD consolidation of the assetBINANCE:XRPUSDT has bounced from the 2.02 level and is approaching the upper edge of a large consolidation structure. Multiple prior consolidation zones have led to breakouts, and the current bounce hints at continuation toward 2.30. A clean close above resistance would confirm bullish intent.
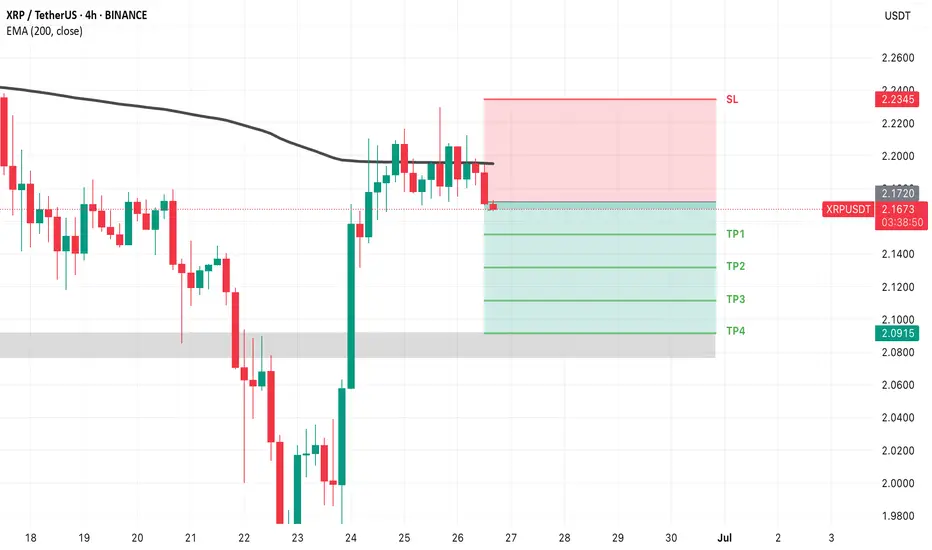
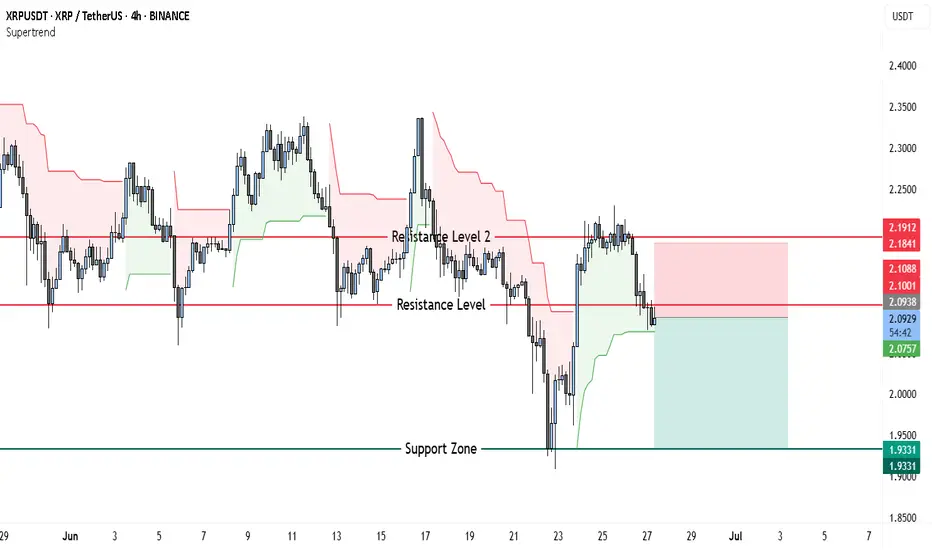
XRP Bears Ready to Feast? Short Setup Targets $1.93 With 1.6:1RROn the XRPUSDT 4-hour chart, price action shows a clear rejection of higher levels and a transition to a bearish tone. After rallying up toward the 2.19–2.18 USDT resistance zone, XRP failed to sustain momentum and rolled over sharply. The Supertrend indicator flipped to red, signaling renewed selling pressure.
Currently, the market is retesting the 2.09–2.10 USDT zone, which previously acted as strong support but is now functioning as resistance. This is a classic bearish retest structure, often confirming further downside if price fails to reclaim the level decisively. Beneath the current price, the most significant support area rests near 1.93 USDT, where buyers previously defended with strong volume.
This backdrop supports a short-biased trade setup. The ideal entry would be around 2.09–2.10 USDT, where the market is testing the broken support as resistance. The stop loss should be positioned just above the prior swing high and the top of Resistance Level 2, at 2.19 USDT. If the rejection holds, the take profit target aligns with the clear structural support around 1.93 USDT. This setup offers a risk of roughly 0.10 per XRP and a potential reward of about 0.16, maintaining a sound risk-reward profile near 1.6:1.
While a bullish reversal is possible if XRP can reclaim 2.19 USDT on a strong daily close, current price action and trend signals favor sellers in the near term.
XRP - Do you want to slurp?Yeah who doesnt wants to slurp profits? I shall say the move down shall be taken first before the formation of the pattern to work in accordance with the moves! Hope its understood
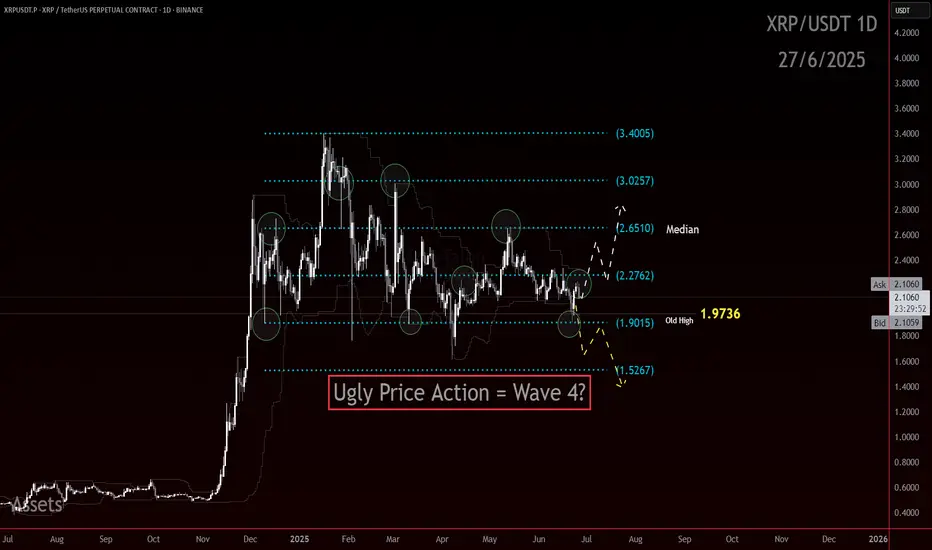
XRP UG-ah-LYXRP has been slowly chopping lower in a mess of overlapping candles. Lower highs and lower lows at the Highest degree. The trend is down and the Elliott Is ugly.
There is a chance here for the trend to shift, but that low needs to hold.
In Elliott Wave, ugly can be useful. An ugly pattern often screams correction. That is the working assumption right now. This structure could still be a complex wave four.
Even though the wave count has not been crystal clear, I am not flying blind. I am using support and resistance to track the structure and wait for clarity.
Here are the levels that matter right now:
3.4005 was the major high
3.0257 and 2.2762 are key reaction zones
2.6510 is the median and the first major line bulls need to beat
1.9736 is the old high that price continues to bounce from
1.9015 and 1.5267 are the potential downside reaction zones if the yellow path unfolds
If this is a correction, there is still potential to hold above 1.62 and send. If that level goes, the structure shifts fast to lower targets.
This is not the time to get brave without confirmation, mo.
Ugly price action can still resolve cleanly. But I want to see an impulsive move through one of these levels, followed by a corrective return to that level. That would offer a more ideal continuation in whichever direction price decides.
Let the level reactions speak first. I will act after.
HolderStat┆XRPUSD held the supportBINANCE:XRPUSDT on the 16h chart is showing strength above $2.05 after breaking out from consolidation. The path is clear toward $2.30 and $2.60 as buyers regain control. The bullish pattern sequence continues to develop.
XRP SHORT TRADE SETUPXRP/USDT is currently holding at a strong resistance zone, with a high probability of an downward price move. Also 200 EMA acting as a strong resistance .