XRP Price Soars Past $2.15: Next Stop $2.38? XRP Price Prediction: What’s Next After Breaking $2.15 Resistance?
Ripple’s XRP has been making waves in the cryptocurrency market, recently breaking above the critical $2.15 resistance level and surging nearly 8% in the last 24 hours to trade at $2.18. With a further 9% climb in recent sessions and open interest jumping to $3.77 billion, the coin is showing strong bullish momentum. Analysts are now eyeing targets of $2.33 and even $2.38 in the near term. But what lies ahead for XRP after this breakout? Is this the start of a sustained rally, or could resistance at higher levels cap the gains?
________________________________________
XRP Price Action: Breaking Key Resistance at $2.15
XRP’s recent price surge has caught the attention of traders and investors alike. After trading in a consolidation range for weeks, the cryptocurrency initiated a fresh increase from the $1.92 zone, gaining momentum as it approached the $2.00 level. A significant development came when XRP broke above a key bearish trend line with resistance at $2.00 on the hourly chart of the XRP/USD pair (data sourced from Kraken). This breakout was followed by a decisive move past the $2.15 resistance, a level that had previously capped upward movements.
Currently, XRP trades above $2.18, sitting comfortably above the 100-hourly Simple Moving Average (SMA), a widely watched indicator of short-term trend direction. The price action over the last 24 hours shows an 8.2% increase, with some sessions recording gains as high as 14%, particularly following geopolitical developments like the Iran-Israel ceasefire, which boosted risk assets across markets. This recovery from the $1.90 low demonstrates strong buying interest and renewed confidence in XRP’s potential.
The immediate question for traders is whether XRP can sustain this momentum. The next resistance zone lies between $2.20 and $2.33, with some analysts even targeting $2.38 based on rising open interest and market volume. A close above $2.18 in the coming hours could signal the start of another leg up, while failure to hold this level might see a pullback toward $2.10 or lower.
________________________________________
Technical Analysis: Bullish Indicators and Key Levels to Watch
To understand XRP’s potential trajectory, let’s dive into the technical indicators and key levels shaping its price action.
Support and Resistance Levels
• Support: The $2.10 level, previously a resistance, now acts as a near-term support alongside the 100-hourly SMA. A break below this could see XRP test the $2.05 zone, with further downside potential to $1.92 if bearish pressure mounts.
• Resistance: The immediate hurdle lies at $2.20, a psychological barrier that has historically posed challenges. Beyond this, $2.33 emerges as a critical target, as breaking this level could confirm a short-term bullish continuation. Analysts also highlight $2.38 as a feasible target if momentum persists.
Moving Averages and Trend Indicators
XRP’s position above the 100-hourly SMA is a bullish sign, indicating that buyers are in control of the short-term trend. Additionally, the price recently crossed above the 50-hourly SMA during its 14% surge, further reinforcing the bullish outlook. The convergence of these moving averages suggests that a golden cross—a bullish signal where a shorter-term average crosses above a longer-term average—could be forming on lower timeframes, potentially attracting more buyers.
Relative Strength Index (RSI)
The RSI on the hourly chart currently sits around 65, indicating that XRP is approaching overbought territory but still has room to run before reaching extreme levels (above 70). This suggests that the current rally could extend further, provided no major negative catalysts emerge.
Volume and Open Interest
One of the most encouraging signs for XRP bulls is the surge in trading volume and open interest. Open interest in XRP futures has jumped to $3.77 billion, reflecting growing speculative interest and confidence in further price gains. High volume accompanying the breakout above $2.15 adds credibility to the move, as it indicates genuine market participation rather than a low-liquidity pump.
Symmetrical Triangle Pattern
On the longer-term charts, XRP has been forming a 334-day symmetrical triangle, a consolidation pattern often preceding major breakouts. Analysts predict that this pattern could resolve between July and September 2025, with potential targets ranging from $2 to $5 depending on the direction of the breakout. The recent move above $2.15 could be an early indication of bullish intent, though confirmation of a full breakout from the triangle remains months away.
________________________________________
XRP Price Prediction: Short-Term Outlook (Next 24-48 Hours)
Given the current momentum, XRP appears poised for further gains in the immediate term. Analysts predict a potential 7% move toward $2.33 within the next 24 hours if the price maintains its position above $2.18. This target aligns with the upper boundary of the recent trading range and represents a key Fibonacci retracement level from the prior downtrend.
However, traders should remain cautious of the $2.20 resistance zone, where selling pressure could emerge. A failure to close above this level on the hourly or 4-hour charts might trigger profit-taking, leading to a pullback toward $2.10 or $2.05. On the flip side, a decisive break above $2.20 with strong volume could pave the way for a test of $2.33 and potentially $2.38 in the coming days.
________________________________________
What XRP Users Are Talking About This Week: Rumors, Predictions, and Debates
The XRP community has been abuzz with discussions this week, fueled by the coin’s impressive price action and broader market developments. Here are some of the key topics dominating conversations on platforms like Twitter, Reddit, and crypto forums:
1. Geopolitical Impact on XRP: The recent Iran-Israel ceasefire has been credited with boosting risk-on sentiment across markets, including cryptocurrencies. Many XRP holders believe this event contributed to the 14% surge that saw the price reclaim $2.00, with some speculating that further de-escalation could drive additional gains.
2. Regulatory Clarity for Ripple: Ongoing debates about Ripple’s legal battle with the U.S. Securities and Exchange Commission (SEC) continue to influence sentiment. While a resolution seems closer than ever, with rumors of a potential settlement circulating, uncertainty remains a key concern. A favorable outcome could act as a major catalyst for XRP, potentially pushing it toward new highs.
3. Adoption and Utility: XRP users are excited about Ripple’s continued partnerships with financial institutions for cross-border payments. Recent announcements of pilot programs in new regions have fueled speculation that increased adoption could drive organic demand for XRP, supporting long-term price appreciation.
4. Price Predictions: Community predictions range from conservative targets of $2.50 in the near term to more ambitious forecasts of $5 or higher by the end of 2025. Much of this optimism hinges on the symmetrical triangle breakout expected next year, as well as broader market trends like the Bitcoin halving in 2024.
These discussions highlight the mix of optimism and caution within the XRP community. While the recent breakout has bolstered confidence, many users remain wary of external factors like regulatory developments and macroeconomic conditions that could impact the coin’s trajectory.
________________________________________
XRP Climbs 9% as Open Interest Jumps to $3.77B: Eyes $2.38 Target
XRP’s 9% climb in a recent session, coupled with open interest soaring to $3.77 billion, underscores the growing interest from both retail and institutional traders. Open interest represents the total value of outstanding derivative contracts, and its sharp increase suggests that market participants are betting on continued price movement—likely to the upside given the current trend.
This surge in open interest aligns with XRP’s break above $2.15, reinforcing the notion that the rally has strong backing. Analysts now eye a $2.38 target, which corresponds to the 61.8% Fibonacci retracement level from the previous major swing high to low. Achieving this target would require sustained buying pressure and a break above the $2.33 resistance, but the current market dynamics suggest it’s within reach if no major sell-offs occur.
However, high open interest also introduces the risk of volatility. If the price fails to break higher and sentiment shifts, a wave of liquidations could amplify downside moves. Traders should monitor funding rates on futures platforms to gauge whether speculative positions are becoming overly leveraged, as this could signal an impending correction.
________________________________________
Ceasefire Boosts XRP Recovery: Bullish Continuation
Above $2.33?
The geopolitical landscape has played a surprising role in XRP’s recent recovery. Following a low of $1.90 amid broader market uncertainty, the announcement of a ceasefire between Iran and Israel injected optimism into risk assets, including cryptocurrencies. XRP responded with a 14% jump to reclaim the $2.00 level, a move that has since solidified with the break above $2.15.
This recovery highlights XRP’s sensitivity to external catalysts. While technical factors like resistance levels and chart patterns drive day-to-day price action, macro events can act as significant tailwinds or headwinds. If the ceasefire holds and global markets remain stable, XRP could see continued buying interest from investors seeking exposure to high-growth assets.
The key level to watch now is $2.33. A break above this resistance with strong volume could confirm a short-term bullish continuation, potentially targeting $2.38 or higher. Conversely, if geopolitical tensions resurface or broader market sentiment sours, XRP might struggle to maintain its gains, with $2.10 acting as the first line of defense.
________________________________________
When Will XRP Price Hit All-Time High? Timeline Revealed
XRP’s all-time high (ATH) of $3.84, reached during the 2017-2018 bull run, remains a distant target for many holders. However, recent technical developments and market trends provide clues about when the coin might approach or surpass this level.
Symmetrical Triangle Breakout: July–September 2025
As mentioned earlier, XRP has been forming a 334-day symmetrical triangle on the weekly chart, a pattern characterized by converging trendlines as price swings narrow over time. Such patterns often precede significant breakouts, with the direction determined by market sentiment at the time of resolution. Analysts predict that this triangle could break between July and September 2025, offering a window for a major price move.
If the breakout is bullish, targets range from $2 (a conservative estimate based on prior resistance) to $5 (a more optimistic projection based on the triangle’s height). A $5 target would represent a new ATH, surpassing the 2018 peak by over 30%. This scenario assumes favorable market conditions, including a broader crypto bull run potentially triggered by the Bitcoin halving in 2024.
Factors Influencing an ATH
Several factors could influence whether XRP reaches a new ATH within this timeline:
• Regulatory Resolution: A positive outcome in Ripple’s SEC lawsuit could remove a major overhang, unlocking significant upside potential.
• Market Cycles: Crypto markets often follow cyclical patterns, with bull runs occurring every 3-4 years. If 2025 aligns with the next cycle peak, XRP could ride the wave to new highs.
• Adoption Growth: Increased use of XRP for cross-border payments through RippleNet could drive organic demand, supporting a higher price floor.
• Macro Environment: Favorable economic conditions, such as low interest rates or stimulus measures, could boost risk assets like XRP.
While predicting an exact date for an ATH is impossible, the July–September 2025 window provides a reasonable timeframe for a potential breakout. Investors should remain attentive to technical confirmation and external catalysts as this period approaches.
________________________________________
XRP Price Reclaims Key Resistance: Are More Gains on the Horizon?
XRP’s reclaiming of the $2.10 and $2.15 levels marks a significant milestone in its recovery from the $1.92 low. This move above key resistance zones suggests that bullish momentum is building, with the potential for further gains if higher levels are breached.
The price is now trading above $2.18, and a close above $2.20 could signal the start of a fresh increase. However, the $2.20-$2.33 range remains a critical battleground. Bulls will need to defend recent gains while pushing for a decisive break above these levels to confirm the next leg up. If successful, targets of $2.38 and beyond come into play, aligning with analyst predictions and Fibonacci extensions.
On the downside, a failure to hold $2.10 could see XRP retest lower supports at $2.05 or $1.92. Such a pullback would not necessarily invalidate the bullish trend but could delay the anticipated rally toward higher targets. Traders should use stop-loss orders and monitor volume trends to manage risk during this volatile period.
________________________________________
Long-Term XRP Price Prediction: $2 to $5 by 2025?
Looking beyond the immediate term, XRP’s long-term outlook remains optimistic, contingent on several key developments. The symmetrical triangle pattern, if resolved bullishly, could propel XRP toward $2-$5 by the end of 2025. This range accounts for both conservative and aggressive scenarios, with the higher end assuming a full market cycle peak and positive catalysts like regulatory clarity.
Even in a more cautious scenario, XRP appears well-positioned to reclaim its prior highs above $3 if adoption continues to grow and broader crypto sentiment remains favorable. Key drivers include Ripple’s expansion into new markets, potential listings on major exchanges post-SEC resolution, and technological upgrades to the XRP Ledger that enhance scalability and utility.
However, risks remain. Regulatory setbacks, competition from other payment-focused cryptocurrencies, and macroeconomic downturns could cap XRP’s upside. Investors with a long-term horizon should diversify their portfolios and remain adaptable to changing market conditions.
________________________________________
Conclusion: XRP’s Path Forward After $2.15 Breakout
XRP’s recent breakout above the $2.15 resistance has ignited optimism among traders and investors, with the coin now trading at $2.18 after an 8.2% surge in 24 hours. Technical indicators like the 100-hourly SMA and rising open interest of $3.77 billion support a bullish near-term outlook, with targets of $2.33 and $2.38 in sight if momentum holds. The geopolitical boost from the Iran-Israel ceasefire and ongoing community discussions about adoption and regulation further fuel the narrative of potential gains.
In the short term, XRP must overcome resistance at $2.20 to confirm the next leg up, while holding support at $2.10 to avoid a pullback. Looking further ahead, the symmetrical triangle pattern suggests a major breakout window between July and September 2025, with price targets ranging from $2 to $5—potentially marking a new all-time high if conditions align.
While challenges like regulatory uncertainty and market volatility persist, XRP’s current trajectory indicates that more gains could be on the horizon. Traders and investors should stay vigilant, monitoring key levels, volume trends, and external catalysts to capitalize on this evolving opportunity. Whether XRP sustains its rally or faces a correction, one thing is clear: the cryptocurrency remains a focal point of excitement and speculation in the ever-dynamic crypto market.
XRPUSDT trade ideas
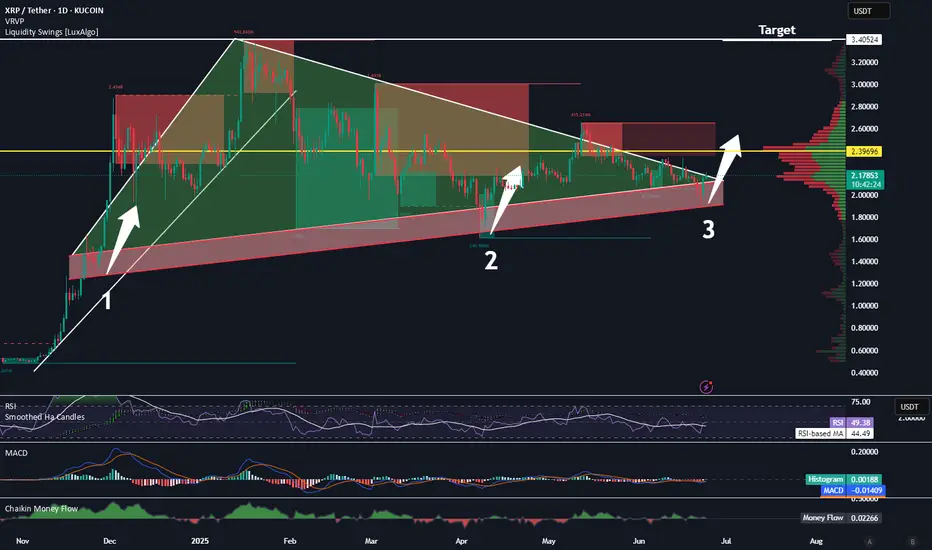
XRP About to Break Out! 3.40 Target.Trading Fam,
It's really this simple. This is a bullish triangle. Three hits in the premium buy zone (bottom of the triangle) and we're done. Once we break, there will be some resistance at that VRVP PoC (2.39) and then we're gone. 3.40 is an easy target.
Stew
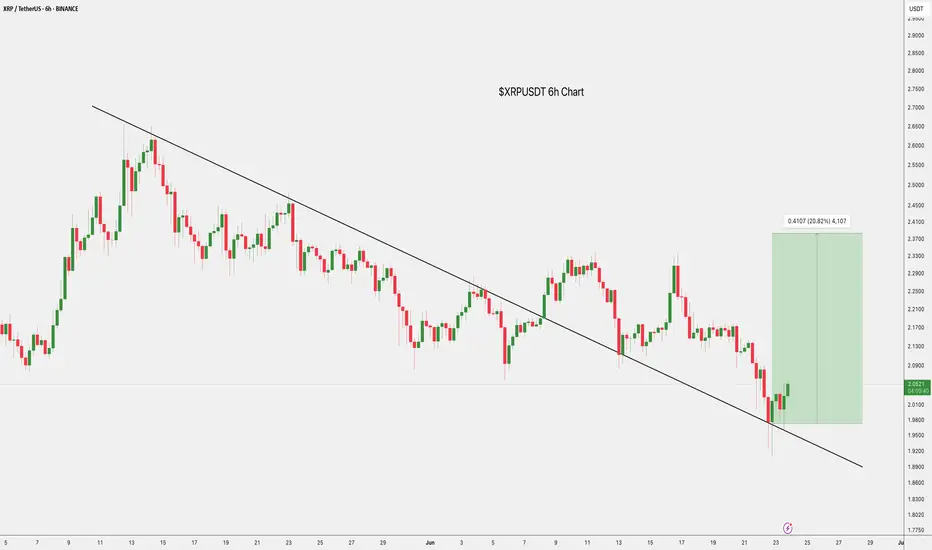
$XRP Trendline Breakout: +20% TargetCRYPTOCAP:XRP has broken out of a long-term descending trendline on the 6H chart, signaling a potential trend reversal.
Price is now holding above the breakout zone around $2.00, with a bullish target near $2.45, a potential 20% move.
Holding this support could fuel further upside.
DYRO, NFA
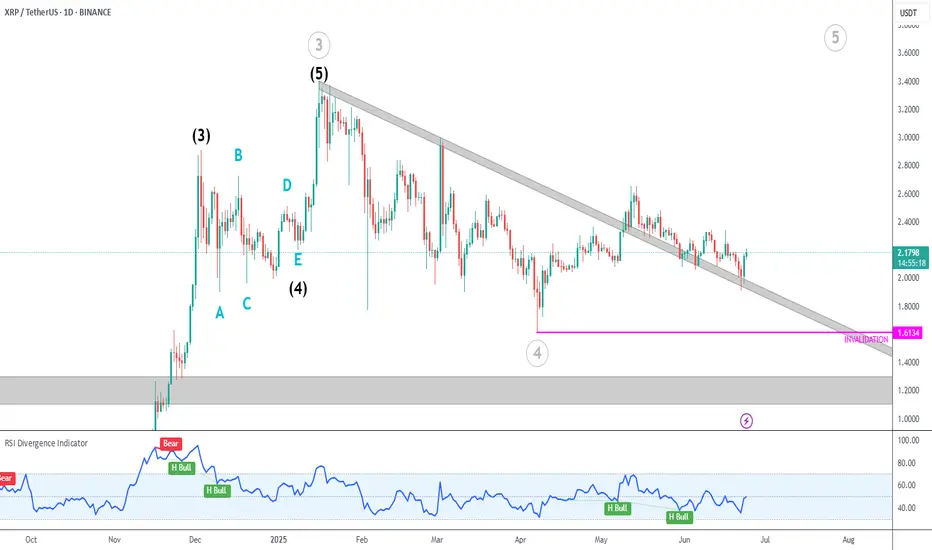
XRP Potential Wave 5Ripple could already be in the subwaves of gray 5. The gray descending trendline was broken and is serving as support for the correction.
In smaller timeframes, price is still making lower lows and lower highs. I´d wait for a clearer reversal in the 4H before taking long trades.
Invalidation is at 1.6134 (potential gray 4 low).
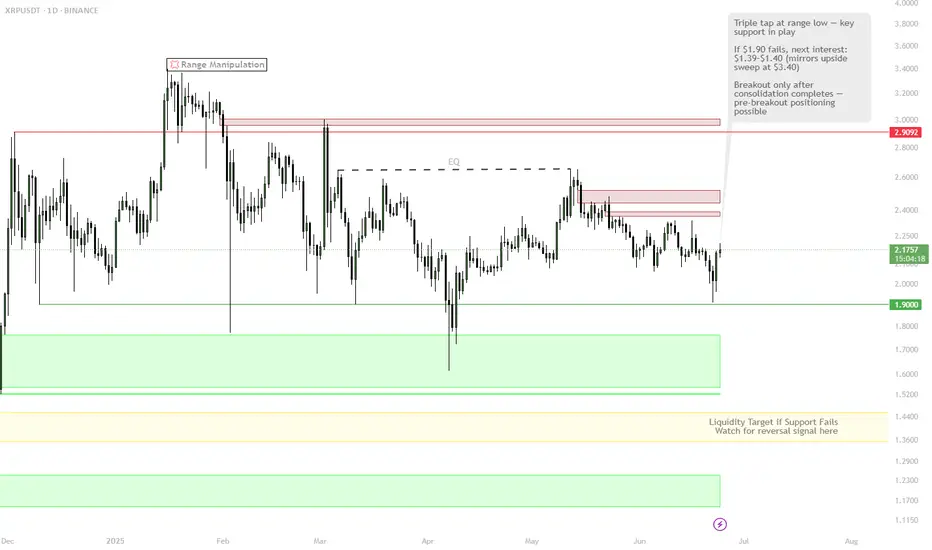
XRP — Triple Tap at Support or One More Low Before Lift-Off?🎯 BINANCE:XRPUSDT Trading Plan:
Scenario 1 (Support Holds):
Bullish above $1.90 — possible pre-breakout setup if structure improves
Look for volume/impulse above midrange to confirm move
Scenario 2 (Sweep Lower):
If $1.90 fails, set alerts at $1.39–$1.40 for reaction/reversal setup
Entry on strong reversal pattern at sweep zone
No Trade:
No action unless price at the range extremes or showing breakout structure
🔔 Triggers & Confirmations:
Only engage after confirmation: bullish SFP at $1.90 or $1.39–$1.40, or clear structure before breakout
📝 Order Placement & Management:
Buy: Only at $1.90 (on reclaim) or $1.39–$1.40 (on strong reversal)
Stop: Below range low ($1.90) or below sweep zone ($1.39)
Targets: $2.90 (range high), then $3.40 (liquidity sweep)
🚨 Risk Warning:
Wait for range extremes or breakout confirmation
Avoid chasing chop — patience until the setup is clean
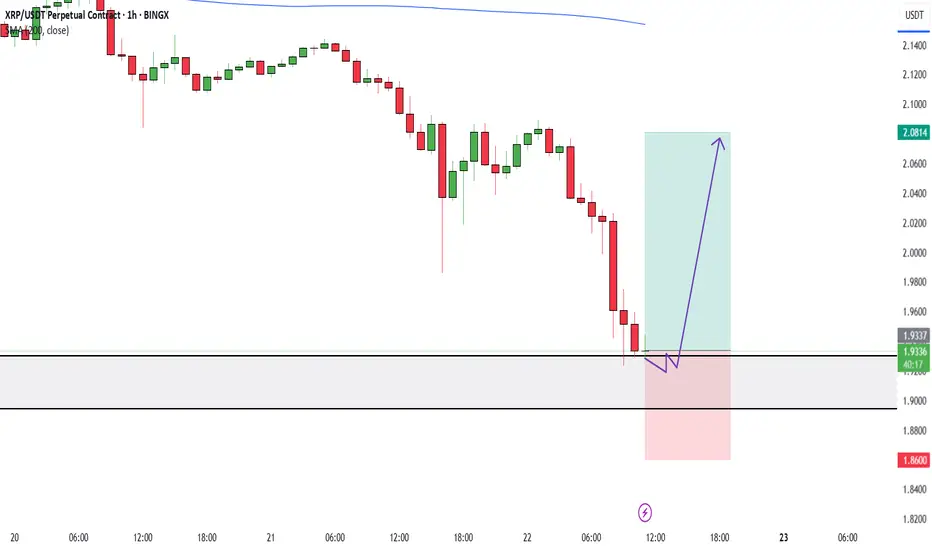
XRP should make a strong rejectionPrice is currently oversold and has eaten most the liquidity it could take for the current session. The 1.92 should hold and offer a bullish reversal in the short term.
My target is 2.0814
SL is 1.8600
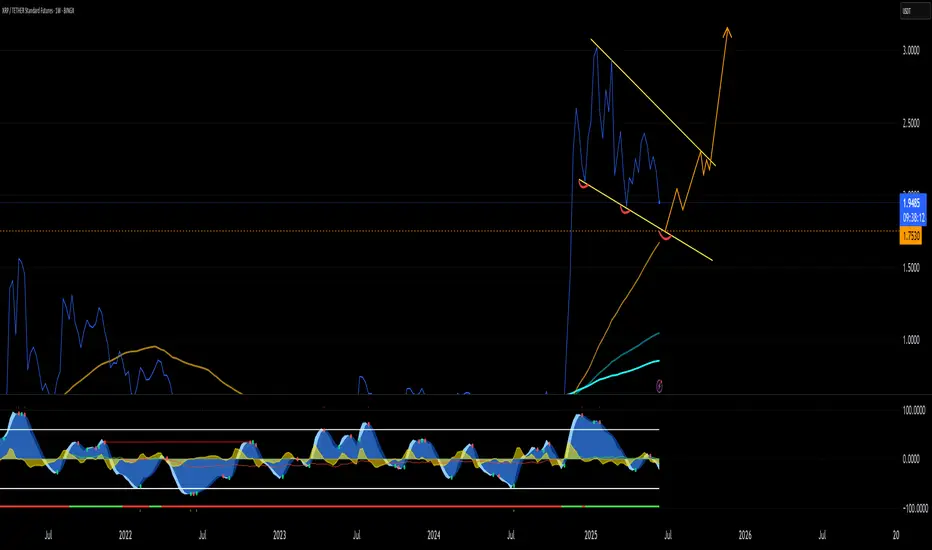
XRP 3 Line Drive and Bull FlagXRP about to make 2 major chart patterns for a bullish move to $5 range. 3 Line drive and trendline hit on a bull flag.
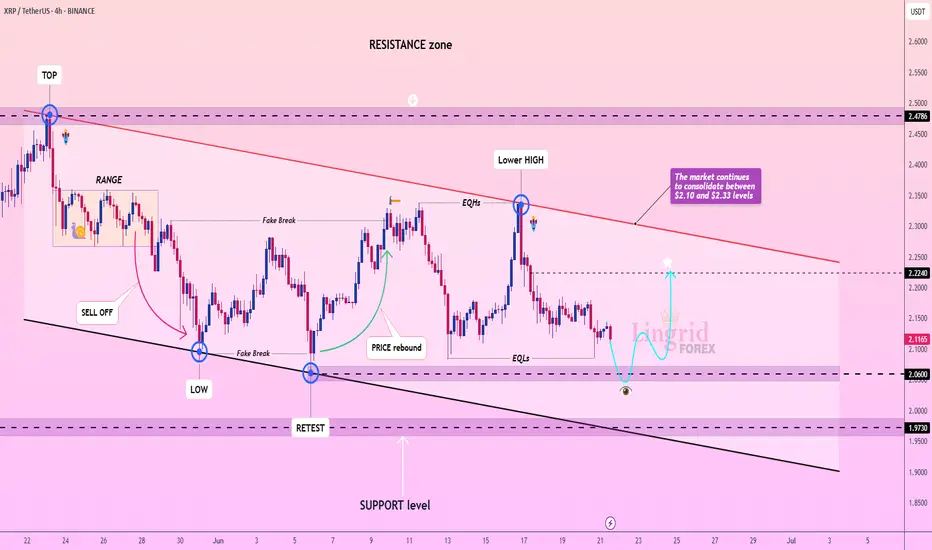
Lingrid | XRPUSDT sideways MOVEMENT ContinuesBINANCE:XRPUSDT is consolidating within a defined horizontal channel, currently sitting just above the 2.06 support after multiple fake breaks and failed attempts at a higher high. A bullish rebound from this zone could launch price back toward the descending resistance trendline. The 2.2240 level marks a key reaction point that may cap any breakout attempt short-term.
📈 Key Levels
Buy zone: 2.05–2.10
Sell trigger: breakdown below 2.05
Target: 2.22
Buy trigger: confirmation bounce above 2.10
💡 Risks
Sideways consolidation may extend, delaying breakout
Strong rejection near 2.22 trendline could trigger reversal
Break below 1.9730 confirms bearish continuation
Traders, if you liked this idea or if you have your own opinion about it, write in the comments. I will be glad 👩💻
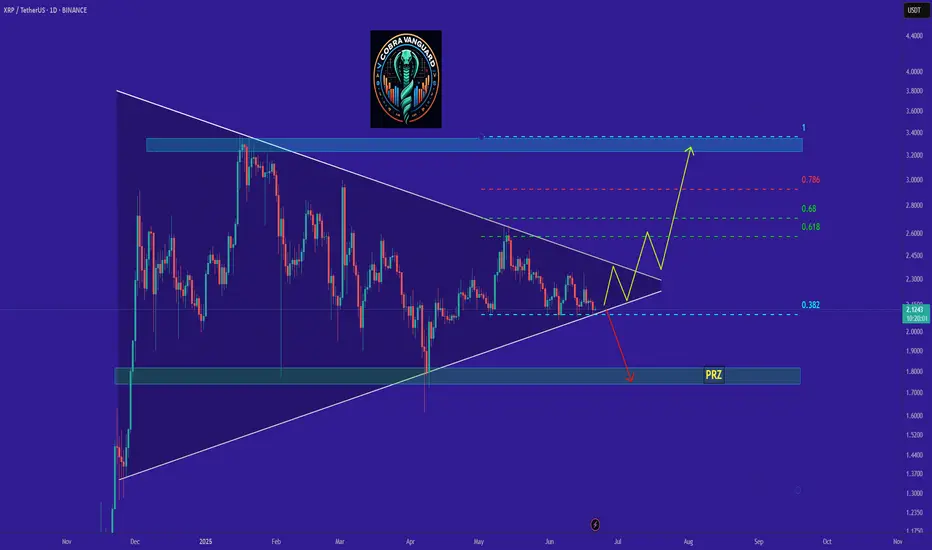
XRP road map (Daily)This could be the last chance for Ripple; if the triangle breaks downward, the price could enter a channel below $2.
Best regards CobraVanguard.💚
$XRPUSDT 6h Chart. $XRP/USDT 6H chart shows a clean breakout above the descending trendline, followed by a successful retest at the key demand zone.
This confluence suggests bullish momentum is building up.
As long as price holds above the $2.1023 support, the setup points toward a potential 17% upside move targeting the $2.4873–$2.5035 range.
DYRO, NFA

Ripple XRP price analysisCRYPTOCAP:XRP is another candidate that is predicted to launch an ETF in the foreseeable future.
The price of OKX:XRPUSDT is currently holding very well, and if this trend continues, it will be a very lucky thing if we can buy in the range of $1.68-1.88.
📊 And from there, the price should be heading for $6-6.25.
However, #Ripple is such a “specific coin” that first needs to be infused for 2-7 years before starting a good upward trend)
🧡 Do you hold it? Do you believe in continued growth? When is that CRYPTOCAP:XRP at $10?)
_____________________
Did you like our analysis? Leave a comment, like, and follow to get more

XRP LONG TRADE SETUPXRP/USDT is currently holding at a strong support zone , with a high probability of an upward price move.

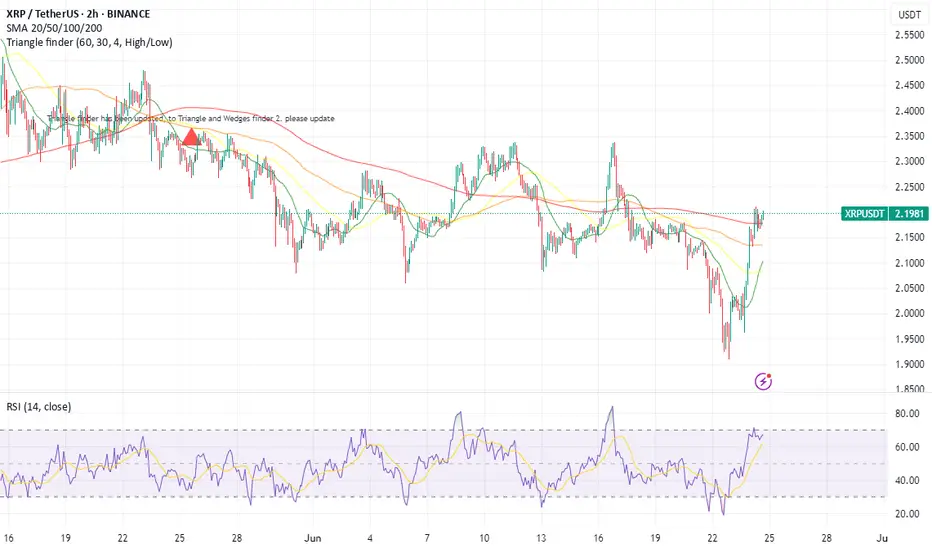
XRP ANALYSIS🔮 #XRP Analysis - Update 🚀🚀
💲 As we said earlier #XRP performed the same. Resistance1 achieved easily. Now we can see that there is a formation of Falling Wedge Wedge Pattern in #XRP and we can see a more retest before a bullish movement again.
💸Current Price -- $2.1729
📈Target Price -- $2.5964
⁉️ What to do?
- We have marked crucial levels in the chart . We can trade according to the chart and make some profits. 🚀💸
#XRP #Cryptocurrency #Breakout #DYOR

Possible outcome for $xrp 🚀 XRP Set for a Major Breakout: Bullish Outlook on XRP/USDT
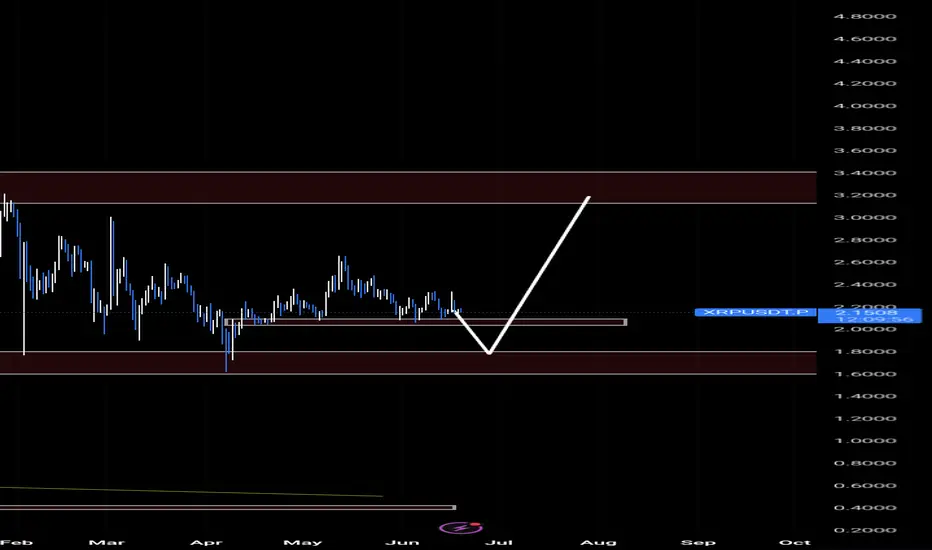
The XRP/USDT chart on the daily timeframe presents an exciting bullish setup that could see XRP rally towards significant highs in the coming months. Let’s break down the key technical insights and what they could mean for traders and investors.
📊 Current Price Action
At the time of analysis, XRP is trading around $2.15. The price has been consolidating in a wide range after an explosive move that took XRP beyond the $3 mark earlier in the year. This consolidation reflects market indecision but also builds up potential energy for a strong directional move.
🏗 Key Levels
Support Zone: $1.70 - $1.85
This zone has been identified as a strong demand area where buyers previously stepped in, preventing further decline. The chart suggests XRP might revisit this area, forming a solid base before a rally.
Immediate Support: ~$2.00 - $2.05
There’s a minor support level here, but the major bullish reversal is expected closer to the deeper support zone.
Resistance Zone: $3.20 - $3.50
This is the target region for the next bullish leg. Historically, this area has capped XRP’s upward movements, but a breakout could open the door to higher prices.
🔑 Bullish Scenario
The chart outlines a potential move where XRP could: ✅ Dip into the lower support range between $1.70 and $1.85, trapping late sellers and inducing demand.
✅ From this accumulation zone, XRP could launch a powerful upward rally.
✅ The rally could target the $3.20-$3.50 resistance area — a key zone that aligns with prior highs.
💡 Why This Setup Looks Bullish
Clear structure of higher timeframe accumulation: The long consolidation phase suggests that XRP may be preparing for a large move, typical after prolonged sideways price action.
Liquidity grab potential: A dip below minor support would shake out weak hands, before a sharp reversal.
Room for upside: Once $3.20 is tested and broken, FOMO (fear of missing out) could drive prices higher, possibly beyond prior highs.
⚠ Risk to Monitor
While the setup points to a bullish move, traders should keep an eye on:
The strength of the $1.70-$1.85 zone. If this level fails, deeper downside could occur.
External factors such as regulatory news or broader crypto market sentiment that might impact XRP’s price action.
🌟 Conclusion
The XRP/USDT daily chart hints at an imminent bullish opportunity as price approaches a key support zone. If the outlined path unfolds, XRP could see significant upside towards the $3.20-$3.50 area in the coming months. For traders, patience and careful risk management at the support levels could position them to ride the next wave of XRP’s move.
HolderStat┆XRPUSD correction from the trend lineOKX:XRPUSDT found footing at 2.09 and now grinds beneath descending resistance. Regaining 2.18 should unlock a glide toward 2.25-2.35 inside the larger bull channel, whereas failure to defend 2.05 risks a trip to 1.95 reload territory.

XRPUSDT Forming 2017-Style Flag — Major Breakout Loading! BINANCE:XRPUSDT is currently forming a classic bullish flag pattern, a setup that looks strikingly similar to what we saw back in 2017 before CRYPTOCAP:XRP went on a massive run. The price has been consolidating within a tight range, and this could be the calm before a powerful breakout.
Back in 2017, a similar flag formation led to a parabolic uptrend once the resistance was broken. While history doesn’t repeat exactly, this pattern suggests the potential for a significant upside move if the breakout confirms. Traders and investors should keep a close eye on this structure — a breakout from this flag could reignite bullish momentum and open the door for a sharp rally.
This is a buy and hold scenario for those who believe in XRP’s potential, but remember — risk management is key. Always use a stop loss below the flag support to protect your capital. Momentum could build quickly, so stay alert and watch for volume confirmation on the breakout.

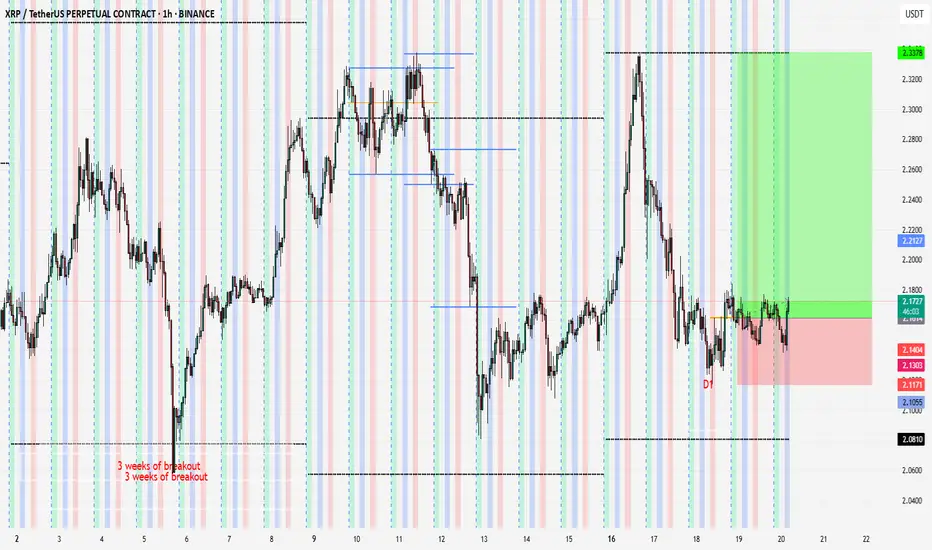
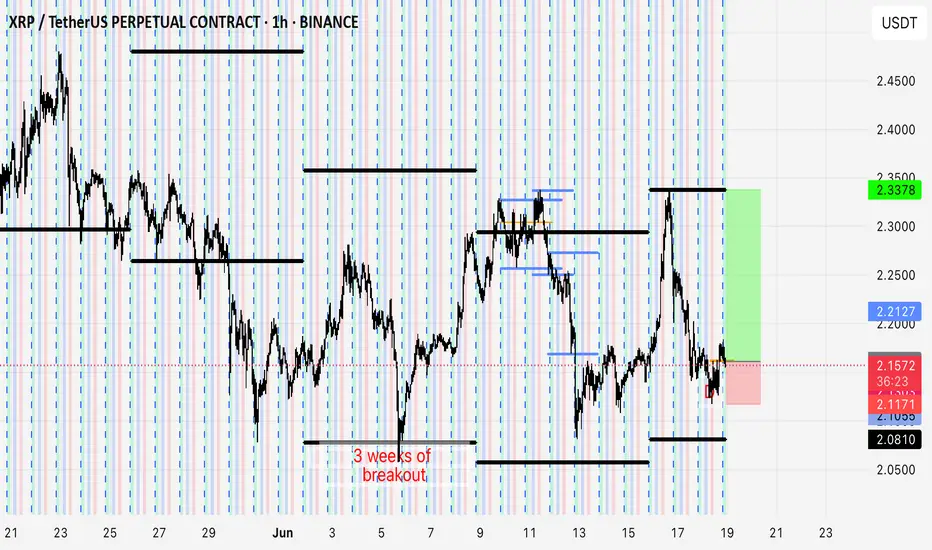
3 weeks of breakoutJust put on a long position, looking to hold till Monday open.3 weeks of breakout and false break
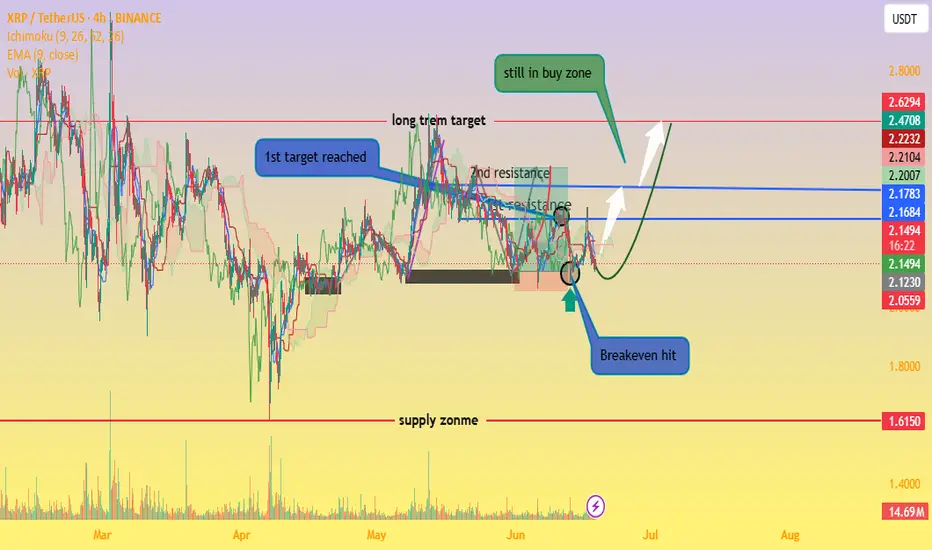
XRP Still in Buy Zone – Eyes on $2.50+our chart clearly marks that XRP has bounced off a strong buy zone (around the $2.10–$2.15 range), aligning well with a classic setup: price hitting support, creating a small base, and starting an upward rotation. 👇
Support area respected – The highlighted circle shows XRP revisiting the demand zone and quickly rebounding, very bullish behavior.
Lower wicks & volume spike – Indicate absorption of selling pressure and possible institutional interest.
Green arrow projection – Suggests a break above the immediate resistance (~$2.17 EMA/Ichimoku levels) could trigger a rally toward the next resistances around $2.22, $2.47, and potentially $2.63.
“Still in buy zone” annotation – Absolutely valid: as long as XRP stays above that key base ($≈$2.10), the bullish case holds.
🔍 Market Context
Range consolidation between ~$2.10–$2.30 has been the dominant theme, awaiting a breakout catalyst (e.g., ETF approvals or legal clarity)
thecryptobasic.com
+14
fxempire.com
+14
crypto.news
+14
.
Analysts highlight a falling wedge and support zone between $2.00–$2.20—if price holds, a move toward $3–$4 is plausible .
A range-bound weekly outlook anticipates a push toward $2.50 resistance before exploring higher targets .
✔️ Summary
Buy zone holding: Bullish pattern confirmed with rebound from support.
Key resistance levels: Watch for a breakout above $2.17/EMA and then $2.22–$2.30/$2.50.
Ideal strategy: Maintain position above support; add on breakout, targeting $2.50–$3.00.
Risk points: A drop below $2.10 could test $2.00 or even $1.85 support.
Your Liquidation can be Exchanges Business & Profit Ever feel like the market is designed to move against you ?
That your stop-loss is a magnet for price action?
What if it’s not just in your head? Behind every liquidation wave lies a structure and maybe even a strategy.
In this post, we dive deep into how exchanges might be benefiting from your losses and most importantly, how to flip the script in your favor.
Hello✌
Spend 3 minutes ⏰ reading this educational material.
🎯 Analytical Insight on XRP:
XRP is approaching a major daily support zone, aligned with the psychological level of $2.00. This area has historically provided strong buying interest. A potential rebound from this level could lead to a minimum upside of 16%, with a medium-term target around $2.50 . 📈
Now , let's dive into the educational section,
💣 Liquidation as a Business Model
In crypto derivatives markets, liquidation isn’t just a risk it’s a revenue stream. When your position gets liquidated, your funds don’t just vanish into thin air they become someone else’s gain. Often, the exchange itself.
Remember, exchanges control:
Price data
Order book matching
Access to retail trading behavior
That means they can anticipate and even design market conditions that favor liquidations . Especially from retail traders who overleverage or place their stops in obvious spots.
Scary? Maybe.
Avoidable? Absolutely.
📊 Why TradingView Is Where Your Survival Starts
When it comes to defending yourself against liquidity traps, your best weapon is data real data. Not gut feelings, not Telegram signals. TradingView offers a range of tools that help you detect the footprints of large players before they run over your position. Here’s how to use them:
Liquidity Zones: These zones highlight areas where most stop-losses cluster perfect for identifying where big players are likely to push price. Use community indicators like “Liquidity Grab Zones” or manually plot key levels.
Volume Profile: Shows you exactly where the highest traded volumes occurred. These “high interest” areas often become magnets for price and are favorite playgrounds for liquidity raids.
Order Blocks: Smart money often enters the market through order blocks. Tools like “SMC Tools” or custom scripts in TradingView help you mark these institutional footprints.
Open Interest & Funding Rates (via external data plugins): Watch for spikes in funding or sudden OI drops these can be early signs of liquidation sweeps.
Replay Tool: Rewind the market to any date and simulate price movement in real time. An amazing way to train your eyes on how liquidity hunts usually play out.
Bottom line? TradingView isn’t just a charting tool it’s your radar system in a market full of traps. But only if you use it the right way.
🧠 Market Psychology: Your Fear Is Their Fuel
Exchanges and the whales who partner with them thrive on predictable retail emotion:
Fear of missing out (FOMO)
Fear of liquidation
Greed for fast gains
They don’t need to fake anything your emotions are enough. They just need to let the herd run into the slaughterhouse. Your best defense? Awareness, logic, and a data-first mindset.
⚠️ How to Avoid Becoming Their Target
Stop following noise; start tracking smart data.
Never use stop-losses at obvious round levels or under candle wicks these are classic sweep zones.
Watch funding rates if it looks too bullish or bearish, get cautious.
Don’t enter trades when you feel too confident that’s often when traps are most effective.
Aim for higher-timeframe setups and avoid scalping in manipulated zones.
Most importantly: Treat every chart as a trap until proven otherwise.
🧭 Final Take
In crypto, knowledge isn’t power it’s protection. If you’re still hoping the market plays fair, it’s time to change perspective. Use TradingView to out-think and outlast the systems designed to exploit you. You don’t have to be a genius just informed.
✨ Need a little love!
We put so much love and time into bringing you useful content & your support truly keeps us going. don’t be shy—drop a comment below. We’d love to hear from you! 💛
Big thanks ,
Mad Whale 🐋
📜Please remember to do your own research before making any investment decisions. Also, don’t forget to check the disclaimer at the bottom of each post for more details.

DeGRAM | XRPUSD out of the triangle📊 Technical Analysis
● XRP has retested the long-term purple trend-line it broke in May and bounced at the $2.05–2.15 support, locking in a higher-low on the new rising base.
● Price is coiling inside an ascending triangle capped by $2.44; the pattern’s 1 : 1 swing and the channel roof intersect at $2.81. RSI stays above 50, showing buyers still control momentum.
💡 Fundamental Analysis
● In the remedies brief the SEC trimmed its disgorgement request, and the judge set a July settlement check-in, reducing tail-risk.
● Santiment notes whale wallets (>10 M XRP) accumulated ~60 M XRP since 14 Jun, hinting at renewed institutional demand.
✨ Summary
Buy $2.10–2.20; sustained break above $2.44 targets $2.60 then $2.81. Invalidate on a 16 h close below $1.98.
-------------------
Share your opinion in the comments and support the idea with a like. Thanks for your support!

#XRP/USDT#XRP
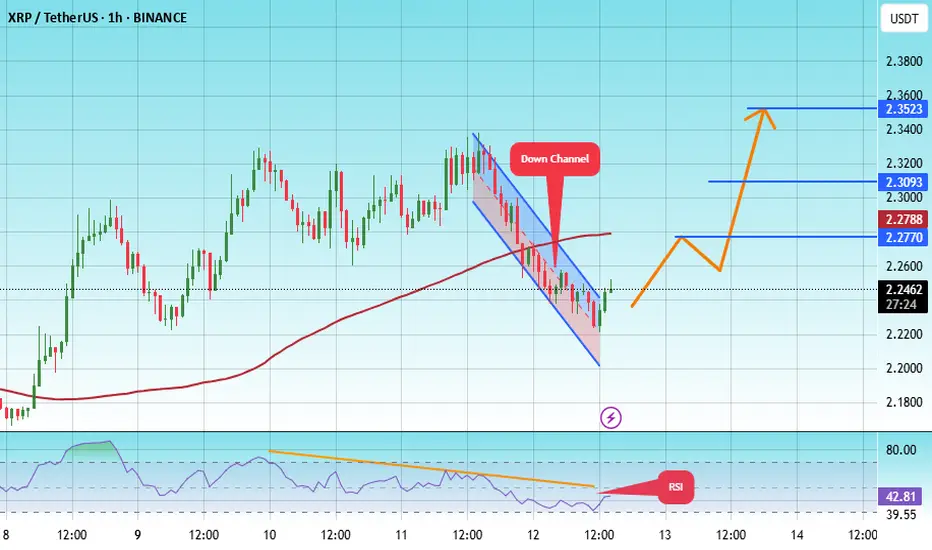
The price is moving within a descending channel on the 1-hour frame, adhering well to it, and is heading towards a strong breakout and retest.
We are experiencing a rebound from the lower boundary of the descending channel, which is support at 2.21.
We are experiencing a downtrend on the RSI indicator that is about to be broken and retested, supporting the upward trend.
We are heading for stability above the 100 Moving Average.
Entry price: 2.24
First target: 2.27
Second target: 2.30
Third target: 2.35
XRP: You Have What it Takes, Success is Yours!It seems XRP has been trading at the same price for more than 7 months. The mean price since XRP broke above $2 back in December 2024.
Can you see what I am referring to? Good if you do.
If you don't, continue reading, everything will be clear in a few seconds.
Price action
Is neutral price action at this point bearish or bullish?
Bullish.
Most of the action has been happening above $2 and this is clearly bullish.
The upswings are bigger than the down-swings.
Buy volume is higher than sell volume.
The main move is an advance that started in November 2024.
The bigger picture and major trend is bullish.
The fundamentals are getting better everyday; there is nothing bearish on this chart.
Where to next?
New all-time high and higher prices.
How to approach the market
Start with 3-5X. When the bullish action is fully confirmed, the market starts to move higher supported by high volume and marketwide wide action, go all-in. That's the only way to win.
Make the winners pay big. Keep the losers small.
If you don't take risk you can't win in this or any other game.
Thanks a lot for your continued support.
Trading tips
Only risk money you can afford to lose and make sure to do a calculated risk. Not crazy risk nor gamblers risk. 2-3X. As the market advances, 3-5X. When the trend is confirmed, go higher and continue to increase until you max everything out. When our target hits sell everything and never look back. You can buy again when there is a crash or a retrace. Opportunities are endless.
If you secure profits and the pair continues to grow; who cares! Buy one that is safe and secure. Buy a new one that is trading low. Don't go back to the same pair just because you won. Detach. Take some time out. Secure profits. Comeback refreshed and the market will bless you with endless opportunities, it is not going away.
Motivation
Just make sure to win-win-win.
If you can win small, you will eventually win big.
Win, win, win. Make a habit of winning.
Go step by step.
Many people overestimate what they can do in a year but underestimate what they can achieve in a decade. Think long-term.
Instead of tomorrow, next week or next month, think how much money you are going to make in a decade if you start preparing now. What if everything you are doing does not need to yield an instant result? Now you can relax your mind. It will all come to you, but let it come, there is no rush.
Even if you hurry, life will continue to give you what you need, what you earned and not what you think is best. Whatever situation you are in right now is the result of past action. Take responsibility and watch everything grow.
Your future can change if you make the right choices today. You can change everything, start now; what can I do today to make my day better? What is the best action to take? Should I go out and get drunk, sniff a bunch of drugs, or, should I exercise and eat clean, do what it takes to reach my goals?
Choose wisely and watch your profits grow.
Whatever results you get when trading is just a reflection of your mind and the choices you make in your day to day live. Belief and take control.
You have what it takes.
Success is yours.
Namaste.
