Xrp Buy zone📊 XRP/USDT Chart Breakdown
1️⃣ Price Structure Overview
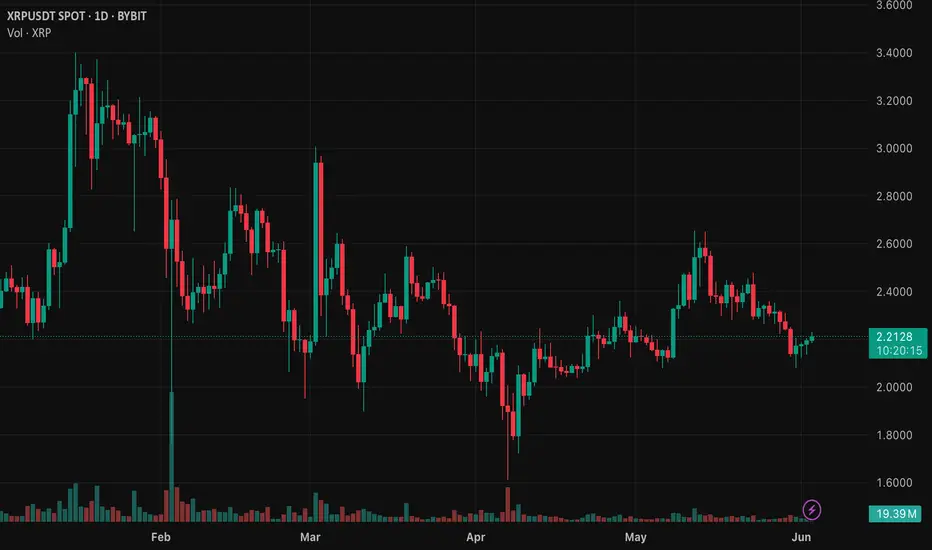
* The chart spans roughly from November 2024 to June 2025.
* We observe clear market structure changes:
* BOS (Break of Structure) and CHoCH (Change of Character) labels mark shifts between bullish and bearish trends.
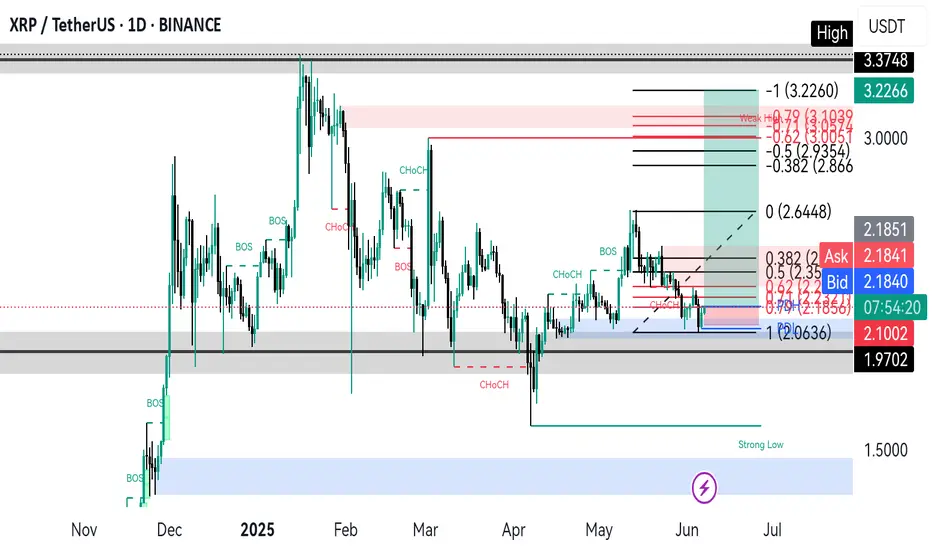
* The current price is consolidating around the \$2.17–\$2.18 level.
* Recent local low at \~ \$2.06 (marked as a strong liquidity area).
2️⃣ Key Levels and Zones
* Demand Zones (Support)
* \$2.06 (strong low marked).
* Grey and blue shaded zones from \~ \$2.00–\$2.18 acting as a major support cluster.
* Supply Zones (Resistance)
* \$2.42 (0.382 Fib retracement).
* \~\$2.85 (0.618 Fib) to \$3.19 (recent weak high) – high probability resistance on rally.
* Psychological resistance around \$3.00.
3️⃣ Fibonacci Retracement & Extension
* The Fib tool is applied from the last significant swing high (\~\$3.22)cto the current local swing low (\~\$2.06).
* Fib Key Levels:
* 0.382 → \$2.42
* 0.5 → \$2.64
* 0.618 → \$2.85
* Full extension → \$3.22
* Price currently testing the 0.382–0.5 range, signaling potential bullish continuation if broken.
4️⃣ Liquidity Zones
* The blue shaded region (\~\$2.00–\$2.18) is a major liquidity zone with strong historical reaction.
* Multiple CHoCH points in May-June indicate a possible trend shift to bullish if price holds above \$2.06 and clears \$2.42.
5️⃣ Market Context
* Daily Structure:Range-bound but with an emerging bullish bias after the \$2.06 low held.
* Current Pattern: Accumulation phase after liquidation sweep below \$2.06, possibly gearing for breakout if market conditions stay favorable.
🏆 Correlation with BTC – Recent 7 Weeks of Bullish Momentum
1️⃣ BTC Context
* Bitcoin has been on a sustained 7-week bullish run, breaking key resistance levels and reaching new 2025 highs.
* This has improved overall crypto market sentiment, leading to increasing altcoin interest.
* BTC Dominance is slightly high but showing signs of topping → good for large-cap altcoins like XRP.
2️⃣ Impact on XRP
* XRP is attempting to reclaim major levels and follow BTC’s momentum.
* BTC’s rally is pulling liquidity into the crypto market, benefiting XRP’s chances of a **breakout above \$2.42–\$2.64.
* If BTC consolidates or slightly pulls back without major weakness, XRP could see a strong move towards **\$2.85–\$3.00.
---
3️⃣ Watch For
* BTC holding above recent highs → more confidence for altcoins.
* BTC correcting sharply → XRP may retest **\$2.06** or lower.
* XRP key breakout: **\$2.42–\$2.64** → if broken with volume, targets \$2.85+.
📈 Summary
✅ XRP is currently in **accumulation mode** above a strong demand zone.
✅ Market structure shows **recent CHoCH indicating potential bullish reversal**.
✅ BTC’s 7-week rally has provided a **favorable environment** for XRP to rally if momentum continues.
✅ Critical level to reclaim: **\$2.42**.
✅ Bullish target if broken: **\$2.85–\$3.22**.
✅ Caution: BTC correction could stall XRP at current support.
XRPUSDT trade ideas
XRP looks like a good area needs volume to push up throughThe volume shelf is holding down, respecting the trendline of a previous bullish area
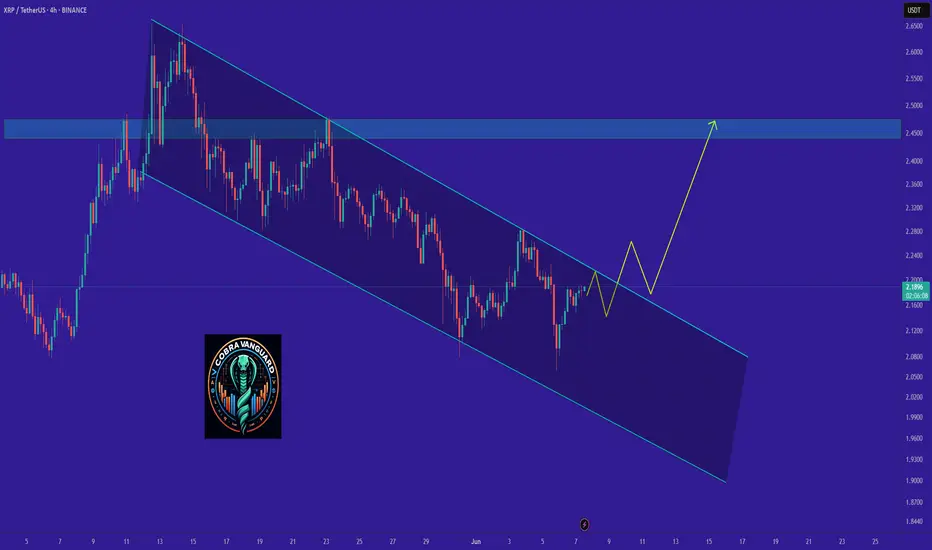
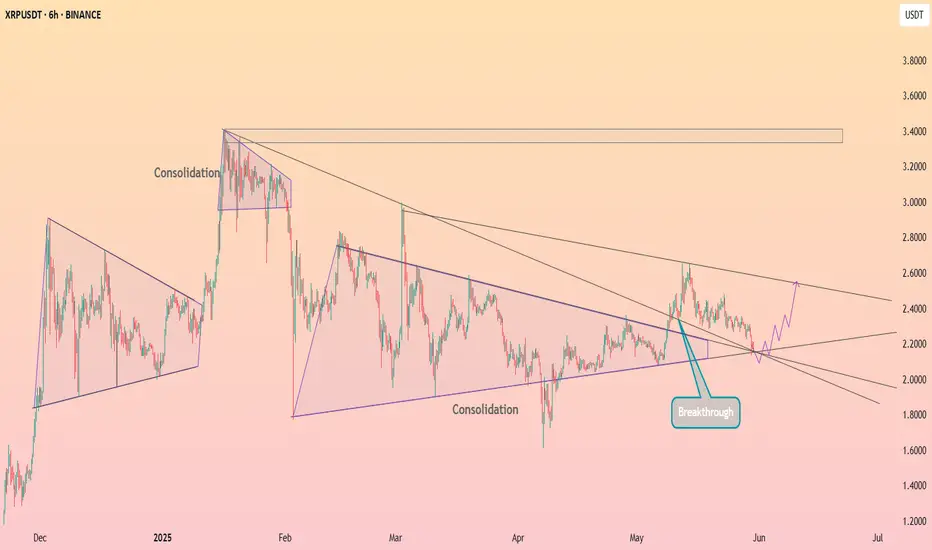
Ripple Analysis - What Shall we Expect !!!If the price can break through this channel's resistance, I expect it to reach $2.5 in a short time.
Stay Awesome , CobraVanguard
XRP Looking Better But... Mixed. Comment, Support Me!XRP is looking much better now. It closed four days green after a higher low but something is off.
I mean, it is good you can see the chart the rising channel but I am sensing some weakness. There is zero volume.
Normally, when the retrace ends and produces a higher low there is always at least a small spike in volume. But, it can happen that there is no volume because it is early and there will be long-term growth and so volume only shows up when resistance is being removed.
Since doubt can creep upon us we focus on the price and the chart.
Higher low the bears showed no strength with several days green we can see prices continue to increase. Let's keep it easy.
Set at stop below $2.07 and go all-in. Do what you think is right already LONG on XRPUSDT since 30-May. We have to wait and see for the market to produce the results.
I mean, what is your take?
You are an expert too give me something, give me something in the comments because it is not an easy chart but it is clearly pointing higher. The problem is that sometimes the chart signals are fake.
Leave a comment with your view.
Thank you for reading.
Namaste.
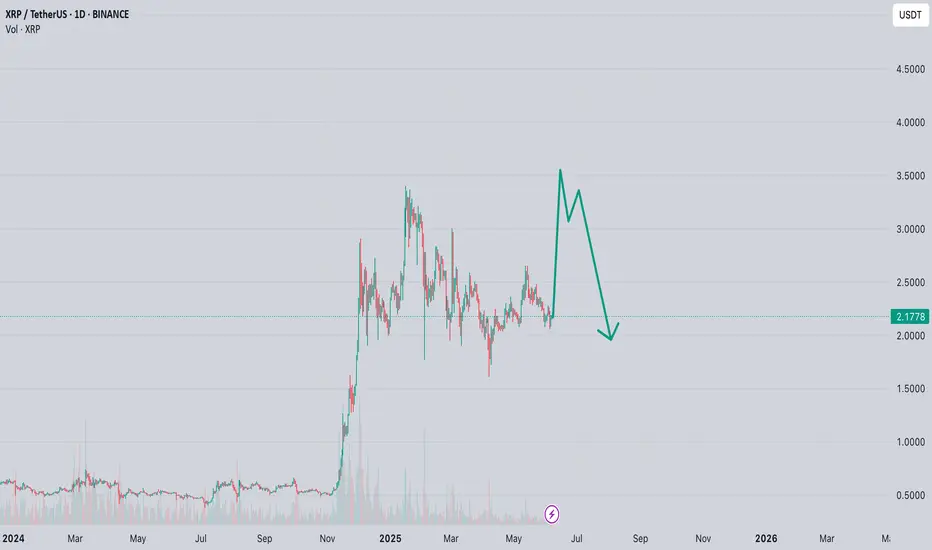
xrp long idea/classic patternI have been trading this pattern for a long time now, and I am waiting for a 3 top to form, the highest in the 3.55 zone from where a strong decline could occur. We have been preparing for a strong uptrend on the hrp at 40% for quite some time now
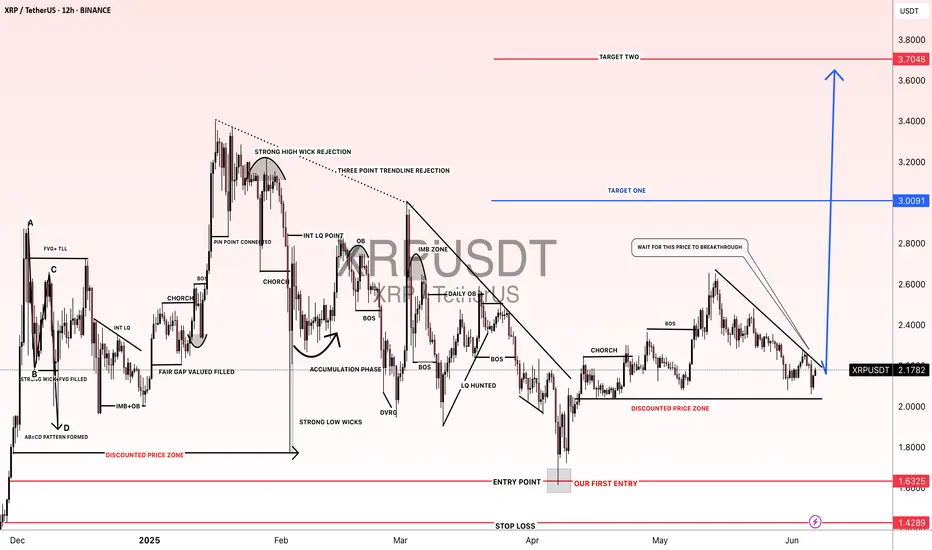
#XRPUSDT: $4 Is One The Way, Get Ready! Comment Your Views! Long term view on #XRP shows an extreme bullish projection, where price hitting $4 price range; there are three targets along the way which can be set according to individual interest and knowledge. We ourselves expect price to grow gradually over time and think long term with the help of fundamentals and economical side price surely can hit $4 target or may went beyond that.
If you like our work please like and comment for more such analysis.
Good luck,
Team Setupsfx_
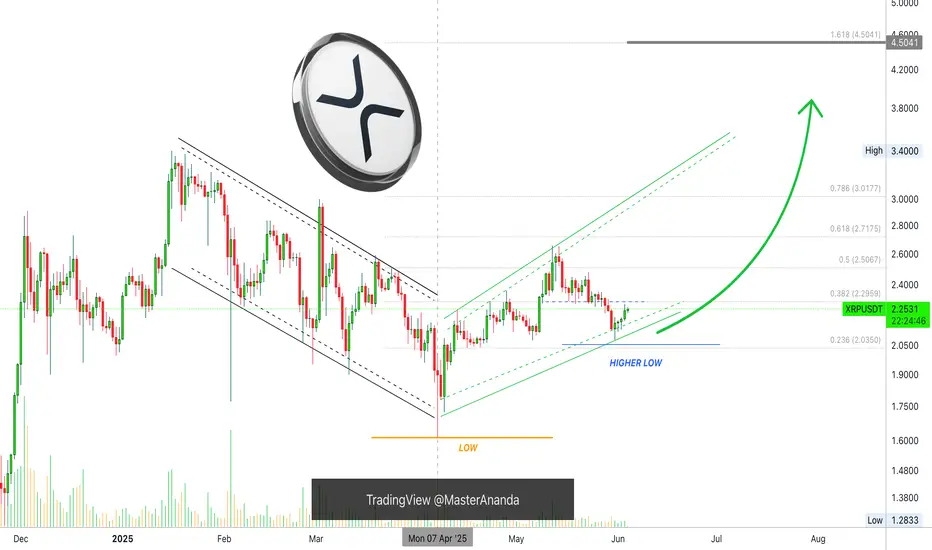
XRP Bullish, The Retrace is Over! Aim HighWhat we need to consider here is the size and duration of each move.
The rise from 7-April through 12-May amounts to 64%.
The retrace from 12-May to present week amounts to 24%.
» So the retrace is more than a third part the size of the advance.
The rise lasted 6 weeks.
The retrace so far has 3 weeks.
» So the retrace is half the length of the rise.
Both these readings are super standard for a bull market. A retrace can easily end this week or early next week followed by 2-3 months of growth. Within this new wave of growth, there will be other retraces but a correction only comes at the end of the main wave. After the correction comes another advance and then a bear market.
Ok. We have a higher low and the chart is pointing up.
After three weeks of bearish action there is no sellers pressure, trading volume is really low.
The bears have no steam, no force, no momentum; the bears are gone.
Knowing this, we can aim high...
The retrace is over!
Thanks a lot for your continued support.
Namaste.
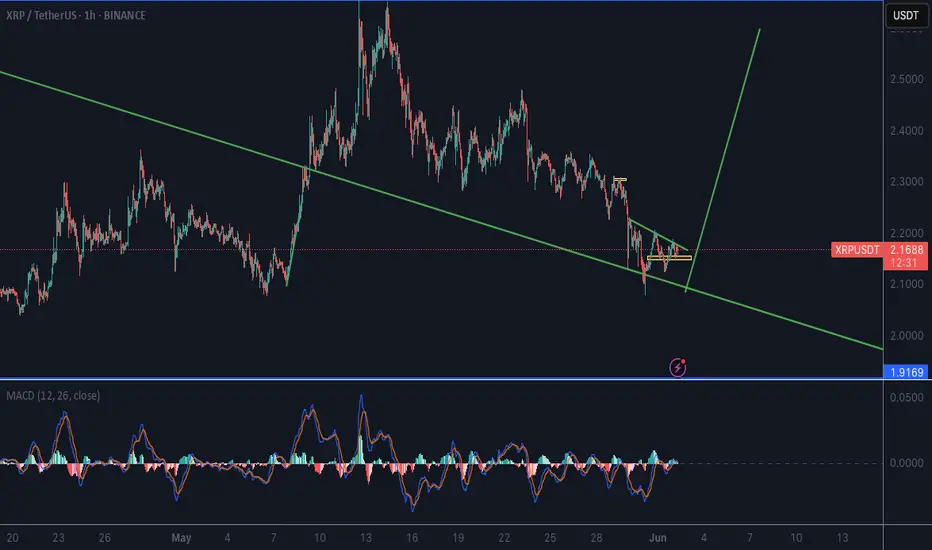
XRP/USDT at Key Support | Trendline Pressure Builds
ABT is currently testing a strong horizontal support zone around 2.08–2.15 USDT after rejecting from the descending trendline.
This area has held multiple times in the past, showing strong buying interest. If the support holds and price breaks above the yellow trendline, we could see a short-term bullish move toward the 2.30–2.45 resistance zone.
RSI is recovering from oversold levels, signaling potential for a reversal, but volume confirmation is still weak.
⚠️ Key levels to watch:
Support: 2.08–2.15
Resistance: 2.30 and 2.45
Breakout zone: Above descending trendline
I'm waiting for a clear breakout with strong volume before considering long positions.

HolderStat┆XRPUSD triangle coil to 2.38CRYPTOCAP:XRP snaps its descending trendline after a neat 4-h triangle + box consolidation combo, reclaiming 2.15 pivot and pointing to the 2.38 supply—trendline break, bullish continuation pattern, resistance retest and clear upside target.

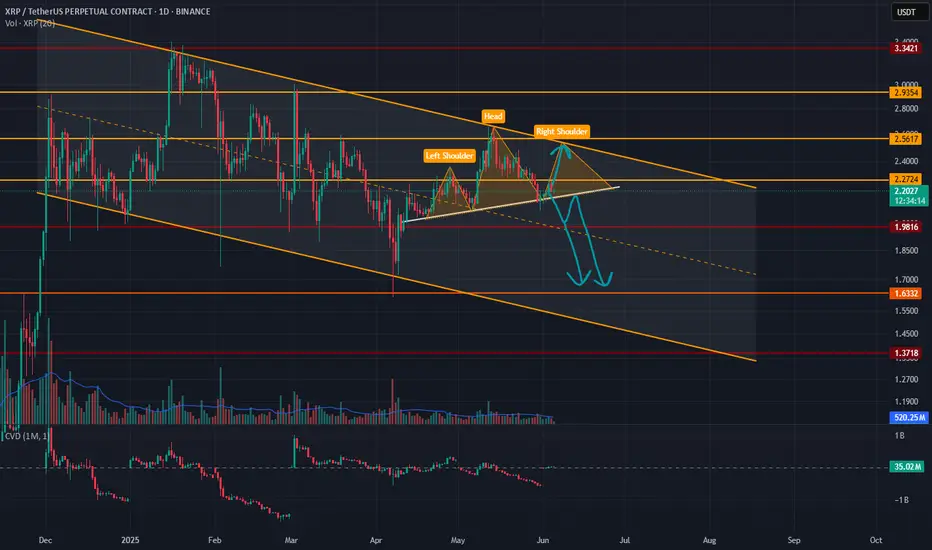
Xrp Can Make a Head And Shoulders PatternBINANCE:XRPUSDT.P
I am sharing this analysis for myself, it is not investment advice.
Xrp is in a big bearish channel, it can make a head and shoulders pattern and go down again.
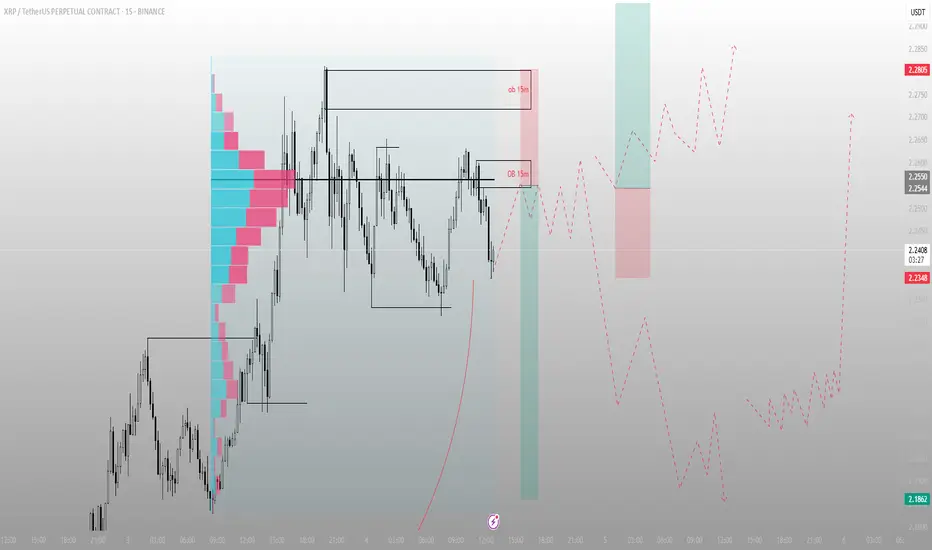
This isn’t distribution. It’s preparation.XRP has spent the last sessions consolidating just under a 15M OB — not failing, just gathering energy. Most traders confuse rejection for weakness. Smart Money sees opportunity.
What matters:
We’ve got stacked 15M OBs above 2.2544 and 2.2805 — liquidity zones that will either break or sweep
Price just tapped the local low while holding above volume cluster support
If we reclaim the midrange and hold above 2.2400, the setup for expansion into 2.2805 is in play
Lose 2.2348? Expect a deeper rotation to the 2.1862 demand zone
There’s no need to predict here. Just follow structure. Volume confirms intent, and the reaction around these OBs will dictate the next leg.
Execution:
Reclaim 2.2544 → long toward 2.2805
Clean breakdown? Step aside and re-evaluate near 2.19
Bias is bullish unless 2.2348 gets invalidated with conviction
You don’t need more signals. You need fewer distractions. The chart is already speaking.
More like this? Setup-first, noise-free — check the profile description.
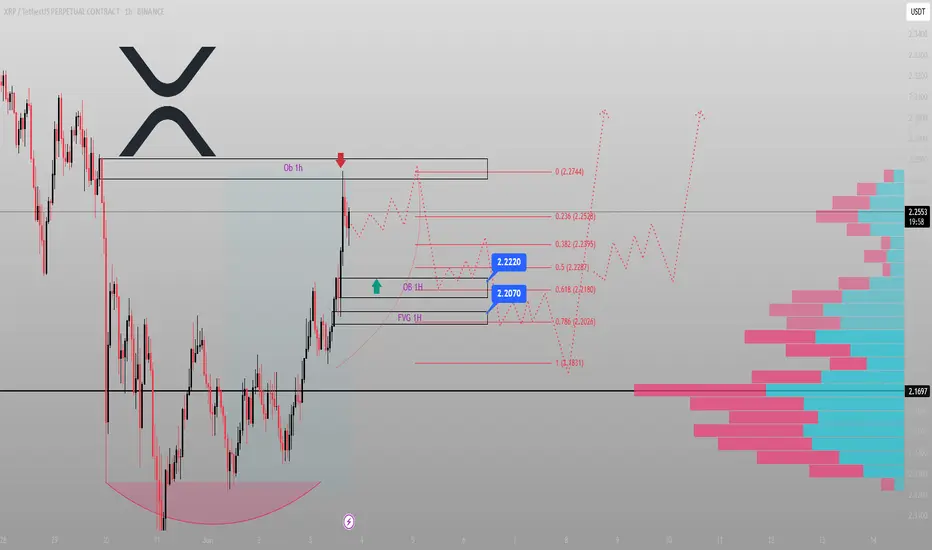
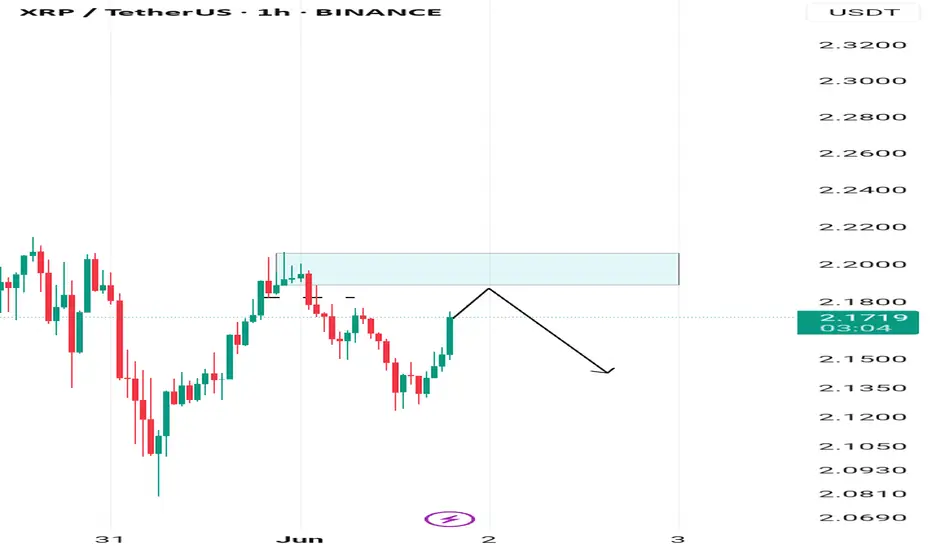
It wasn’t a breakout. It was a sweep.BINANCE:XRPUSDT.P didn’t rally to trend — it rallied to rebalance. The high at 2.2744 was always a liquidity draw, not a destination. Now that the market has taken what it needed, we trade the reaction — not the impulse.
Here’s how this unfolds:
Price tapped into a clean 1H OB and immediately rejected
Below that, we’ve got confluence between OB + FVG zones around 2.2220 and 2.2070 — that’s the re-entry window
Fibonacci levels reinforce the structure:
• 0.5 at 2.2287
• 0.618 at 2.2180
• 0.786 near 2.0266 — last line before deeper rotation
If price holds above the OB and starts to consolidate into a bullish MSS, I expect a rotation back toward the premium wick at 2.2744 — maybe even higher depending on volume profile buildup.
But if we lose 2.2070 decisively, all eyes go to 2.1697 and then 2.1831 — where the real volume sits.
Execution bias:
Accumulation above 2.2070 → bullish continuation valid
Break and hold below? Reversion into deeper discount zones likely
Targeting the sweep of 2.2528 and eventual test of 2.30+ if structure confirms
The move isn’t over. It’s transitioning. You either read the shift or get caught in it.
More setups built on narrative and price logic? They’re in the profile description. I don’t chase — I position.
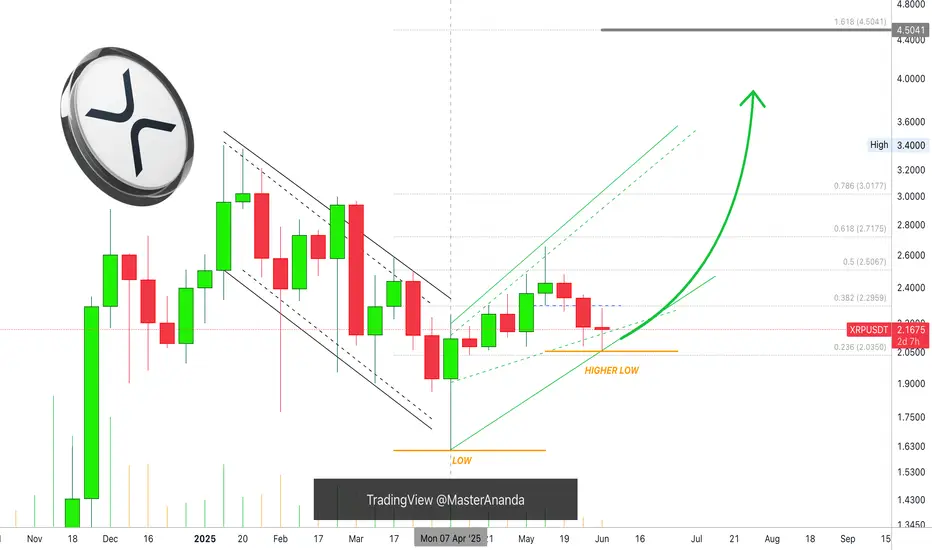
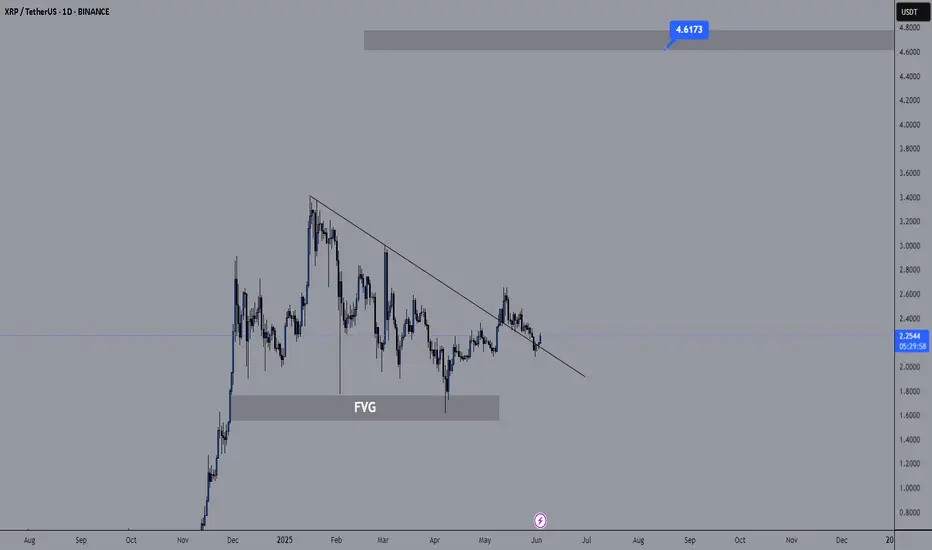
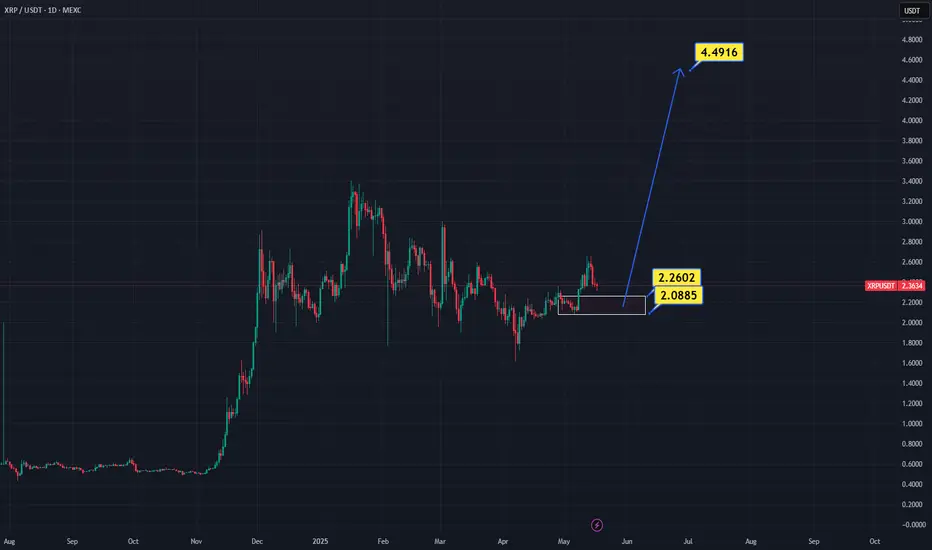
First, where is the growth target?Hello my friends.
If the Ripple cryptocurrency grows, the first target you can pay attention to is the specified area ($4.50).
Now, in my opinion, it is in a good area for buying.
You can make a step in these areas to buy.
.
.
I hope you have used this analysis well.
You can follow our page to see more analyzes.
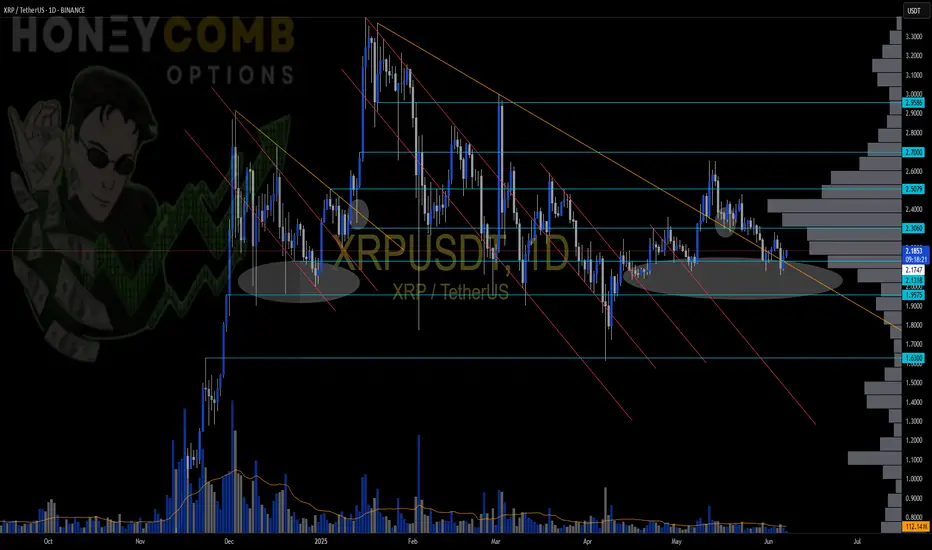
HolderStat┆XRPUSD rebound renaissanceCRYPTOCAP:XRP bounced off a long falling wedge, logged a labeled “rebound”, and now glides within a widening channel. Multiple consolidation pauses plus higher lows keep momentum positive; watch the 740 USDT overhead zone as resistance where breakout traders may aim next.
XRPUSD broke the Resistance level 2.2080 👀 Possible scenario:
XRP trades around $2.20, a key level. A breakout could lift it to $2.50, but a drop below the 200 EMA risks a fall to $2 or $1.80. RSI is near oversold, hinting at a rebound, though weak volume keeps bulls cautious.
Despite ongoing SEC uncertainty, institutional interest may be rising. BitGo plans a $100M XRP purchase for VivoPower, backed by $121M. Also, Classover (KIDZ) and Solana Growth Ventures launched a $500M crypto fund—a trend XRP advocate John Deaton sees as more than hype. Technicals support a bullish case. 'Charting Prodigy' sees a potential breakout above $2.56, targeting $2.90–$3.40. Egrag Crypto forecasts possible double-digit prices—up to $55—if XRP breaks the 21-week EMA within its long-term uptrend.
✅ Support and Resistance Levels
Now, the support level is located at 2.1400.
Resistance levels is now located at 2.2080.
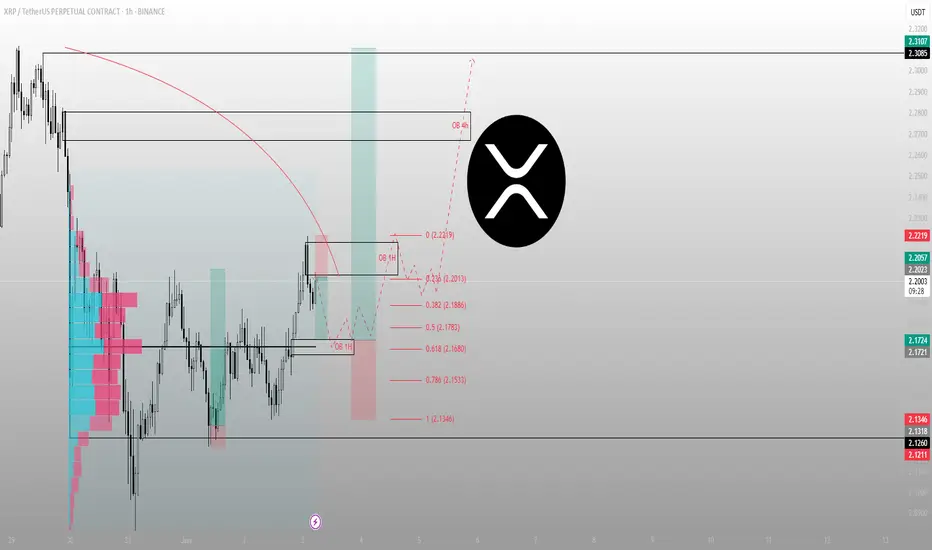
Price delivered the signal — now it’s time to follow structure.XRP isn’t reacting randomly. It’s responding to engineered inefficiencies and prior OBs that most overlook. What looks like resistance to others is just a staging ground for continuation.
Here’s the play:
Price ran into the 1H OB at 2.2219 — hesitation here was expected
We’re now pulling back into the equilibrium zone, anchored by 0.382–0.618 fib (2.1886–2.1680)
This zone also aligns with the previous 1H OB — an accumulation base that already proved itself
If price holds above 2.1533 and shows rejection at the 0.5 fib (2.1783), I expect the next leg to take out 2.2219 and push toward the 4H OB.
Execution thesis:
Ideal long re-entry is in the 2.18–2.16 zone
Invalidation below 2.1346
Targets: 2.2476 → 2.3107, with 2.2219 as first test
This isn’t about chasing highs. It’s about aligning with structure and letting the draw on liquidity do its work.
Want more trades delivered with this level of clarity? The account description has them. I don’t forecast with hope — I forecast with models.
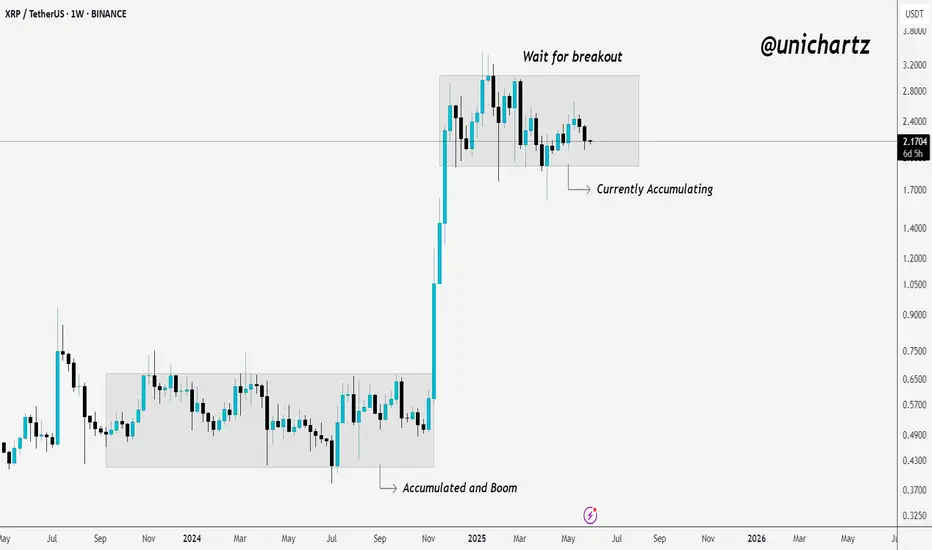
XRP Repeating 2024 Setup? Monitor the RangeCRYPTOCAP:XRP is once again in a familiar phase — accumulation. After its previous range-bound phase led to a powerful breakout, we’re now seeing a similar structure forming on the weekly chart.
The price is consolidating within a clear range, showing signs of strength but awaiting a breakout to confirm the next move. History suggests this kind of accumulation can often lead to explosive upside — but patience is key here.
📌 Key takeaway: Until a clean breakout occurs, it’s best to observe, not chase. Keep your eyes on the upper range boundary for confirmation.
Let the market come to you.
DYOR, NFA
Thanks for following along — stay tuned for more updates!
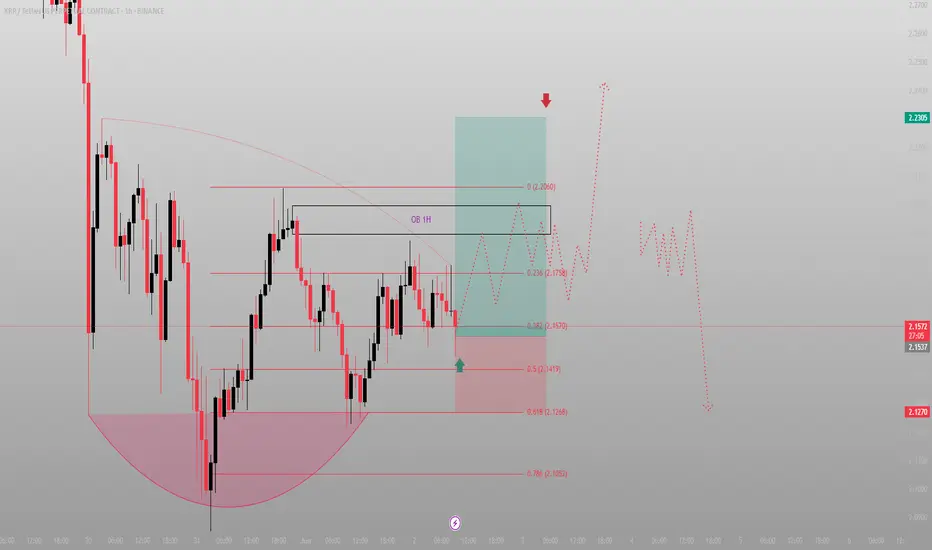
They waited for confirmation. I bought the retrace.XRP didn’t reverse. It refined.
After reclaiming the rounded base and pushing into a 1H OB, price rotated perfectly into the 0.5 retracement at 2.1419 — tagging the breaker wick, respecting structure, and front-running the deeper 0.618 by a hair.
This isn’t weakness. It’s an engineered dip into fresh demand. Smart Money logic doesn’t require “green candles” — it requires imbalance filled and structure respected. That’s exactly what we have here.
Now, price is boxed between two intentions:
If we hold 2.1419, the draw becomes the 1H OB above — 2.1758 to 2.2060.
If we break that level with conviction, 2.1268–2.1052 will serve as the next rebalance zone before any macro continuation.
Execution tier:
✅ Long bias above: 2.1419
🎯 Target 1: 2.1758
🎯 Target 2: 2.2060
❌ Invalidation: Clean 1H body close below 2.1268
Retail waits for signals.
Smart Money builds in silence — and exits with intent.
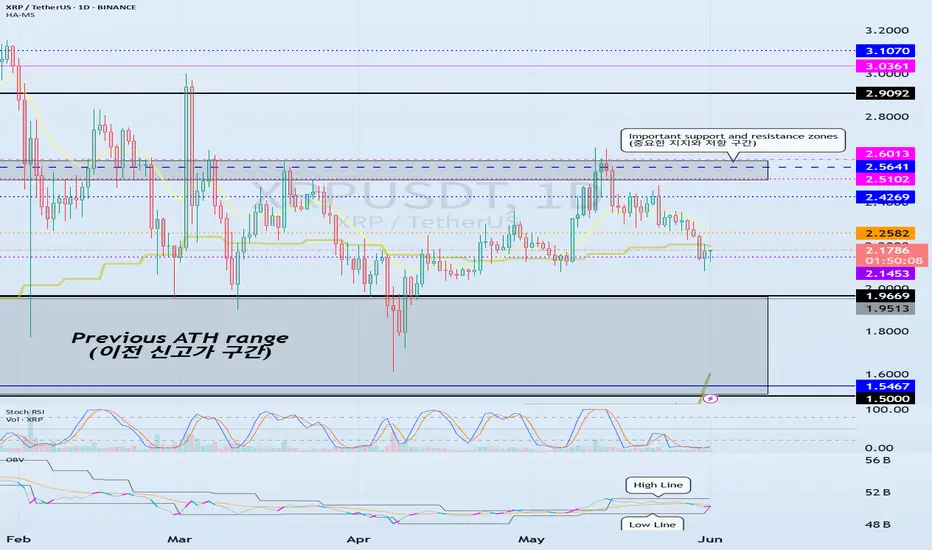
Support Zone: 2.1453-2.2582
Hello, traders.
If you "Follow", you can always get the latest information quickly.
Have a nice day today.
-------------------------------------
(XRPUSDT 1D chart)
The most important thing on the current chart is whether the price can hold above the previous ATH zone.
That is, can the price be maintained above the 1.5000-1.9669 range?
In order for an uptrend to begin, it is expected that the price will have to rise above the important support and resistance range of 2.6013 to start.
-
Currently, the channel of the High Line ~ Low Line of the OBV indicator is forming an uptrend channel.
We need to see if the uptrend channel can be maintained.
-
The 2.1453 point is the DOM (-60) indicator point, which corresponds to the low point range.
The key is whether it can receive support at this point and rise above 2.2582.
If not, it is expected to fall to the previous ATH range.
-
Thank you for reading to the end.
I hope you have a successful trade.
--------------------------------------------------
- This is an explanation of the big picture.
(3-year bull market, 1-year bear market pattern)
I will explain more details when the bear market starts.
------------------------------------------------------
xrp 1DThe technical outlook for xrp looks pretty good. It can be collected between $2.26-2.08. TP1 can be $4.50, TP2 can be $7.
XRP - setupWe’re currently in the daily bullish trend reversal zone, after slightly overshooting the bearish target region.
From here, we should expect a U-turn — but only once a bottom structure has formed.
That could be a double bottom or a bullish divergence on the higher timeframes.
I'm positioning myself accordingly
LFG
