XRPUSDT Weekly Chart Analysis | Next Bullish MoveXRPUSDT Weekly Chart Analysis | Major Resistance Levels Align for Next Bullish Move
🔍 Let’s break down the XRP/USDT weekly setup, highlighting key technical signals and major upside targets for the next rally.
⏳ Weekly Overview
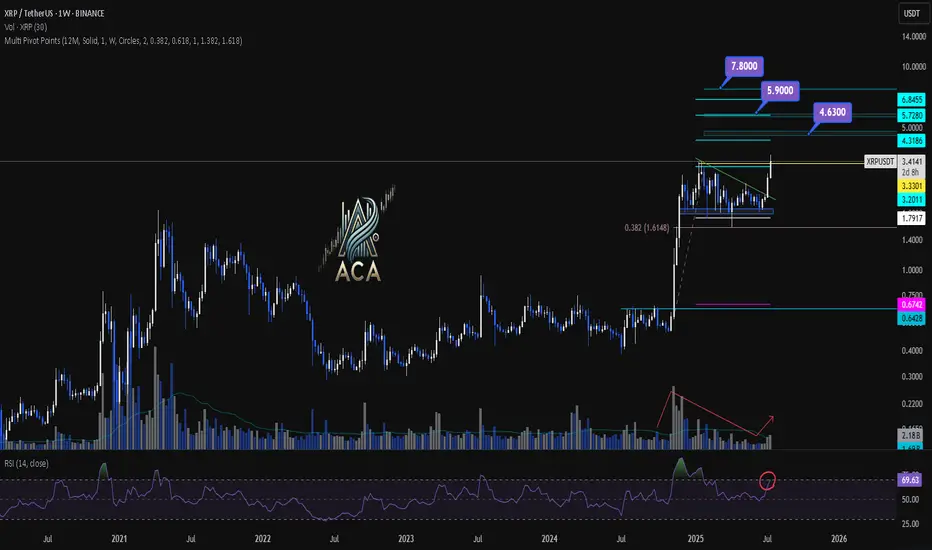
The weekly chart shows consolidation just below a major resistance, with price action tightening and preparing for a breakout. A recent correction found support near the 0.382 Fibonacci retracement level, which has acted as a springboard for renewed momentum. Notably, the R2 pivot point level aligns closely with this area, strengthening its importance as a decision zone for bulls.
🔺 Upside Targets & Confluences:
- First Target: $4.63 — This coincides with the R2 monthly pivot point and aligns with key Fibonacci extension targets, offering strong confluence for a reaction zone.
- Second Target: $5.90 — Our most realistic medium-term target, also backed by cluster resistance from both pivot analysis and fib projections.
- Final Target: $7.80 — This is the major Fibonacci extension level, marking the highest projected upside if momentum persists.
📊 Key Technical Highlights:
- Pivot Point R2 & Fibonacci Confluence: The R2 level reinforces a critical resistance, overlapping with the $4.63 Fibonacci target.
- Fibonacci Retracement: Price respected the 0.382 retracement during the latest correction, signaling healthy trend continuation.
- Volume Confirmation: An uptick in volume confirms that buyers are stepping in, supporting the bullish momentum.
- RSI Signal: RSI is entering the overbought zone, which typically indicates a strong surge in buying pressure and can mark the start of a momentum move.
🚨 Conclusion:
XRP is setting up for a major breakout as key technical levels align. Watch for a sustained move above $4.63 to unlock the $5.90 area, with a final potential push towards $7.80 if bulls maintain control. Volume expansion and an overheated RSI are both classic signs of an incoming momentum wave—keep your eyes on these levels for validation of the setup.
XRPUSDT trade ideas
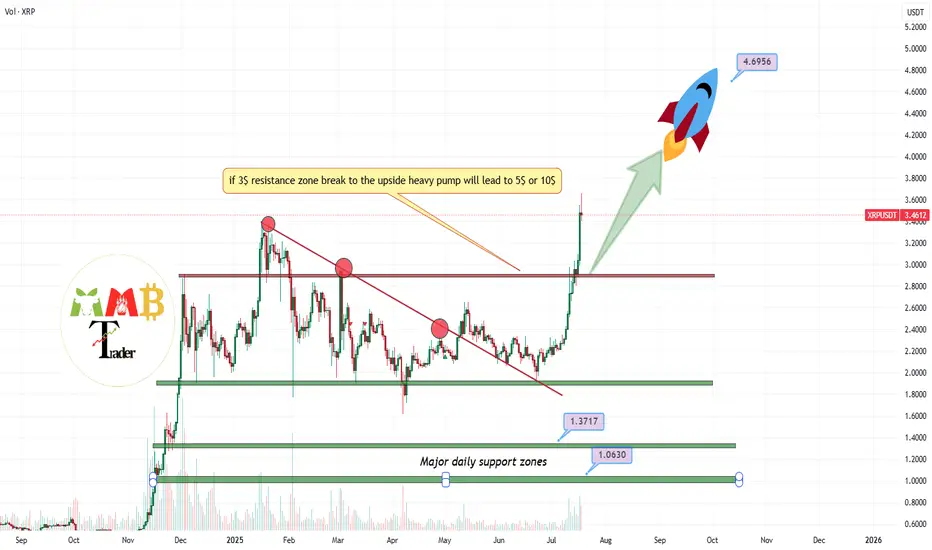
XRP New ATH is above 5$Our long from 2$ is now on +100% profit:
\https://tradingview.sweetlogin.com/chart/XRPUSDT/nI5aVpoY-XRPUSDT-after-breaking-red-trendline-can-easily-hit-3-5/
and red trendline broke and the pump started as it was expected but for now i think it can push a little more higher at least to the targes like 5$ and if this market remain bullish and BINANCE:BTCUSDT try to hit targets like +140K$ then XRP even can go for ATHS like 7$ and 9$.
DISCLAIMER: ((trade based on your own decision))
<<press like👍 if you enjoy💚
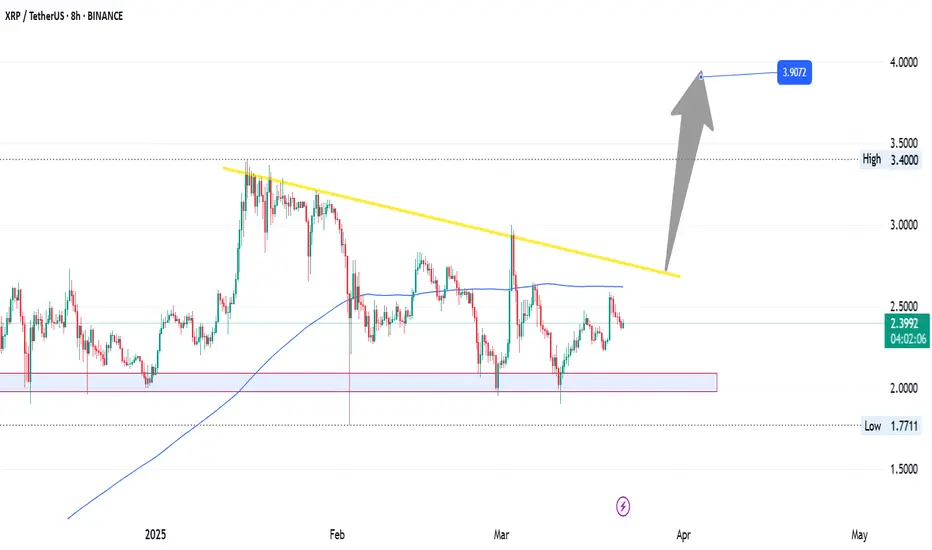
Setupsfx_ | XRPUSDT: Time For Strong Bullish Price Distribution!As previously described, the price bullish reversal did exactly that. The price has moved nicely, and this may be just the beginning of a bigger move. Long-term, we believe XRP will hit a record high, possibly even surpassing $4.
Please use accurate risk management while trading XRP.
Good luck and trade safely!
Explosion Imminent?As Bitcoin ( BINANCE:BTCUSDT ) is digesting price action towards further continuation of its preceding trend (Up), BINANCE:XRPUSDT is a prime candidate to gain great percentages to the upside, as a saying goes....
"A rising tide lifts all boats"

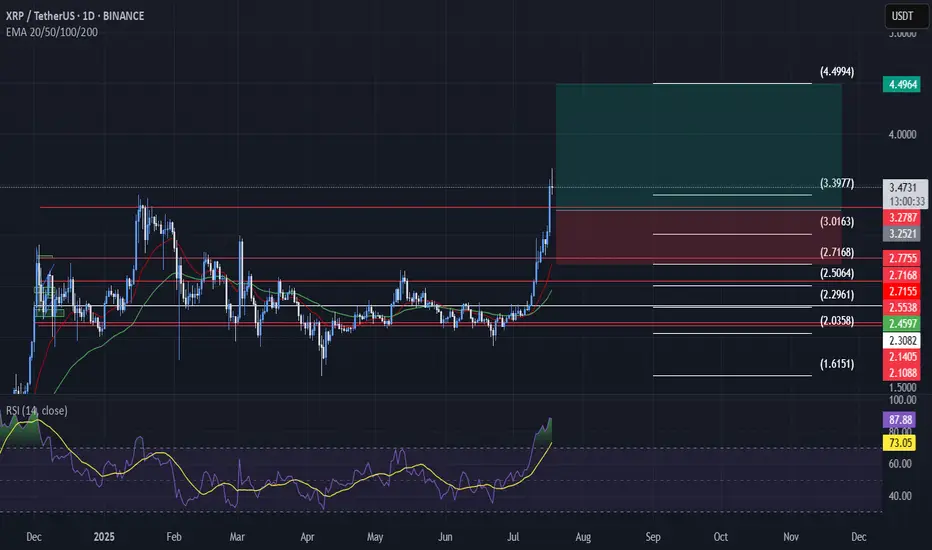
xrp breakoutXRP has broken out of a multi-month consolidation zone, clearing major resistance levels around $2.75–$3.00. The current price action shows strong bullish momentum supported by moving averages and an overextended RSI.
Key levels:
Entry: $3.46 (market price)
Stop-Loss: $2.75 (below 0.382 Fibonacci and prior resistance)
Target: $4.49 (based on previous price structure and Fibonacci extension)
Risk-to-Reward Ratio: ~1:3.9
Analysis:
Bullish EMA alignment (price is above 20/50/100/200)
RSI is overbought (~87), which signals strength but also warns of potential retracement
No retest of breakout zone yet — caution on late entries
This setup is momentum-based, not for late chasers. I will monitor for a clean retest around the $3.00–$3.20 area for a safer re-entry if price pulls back.
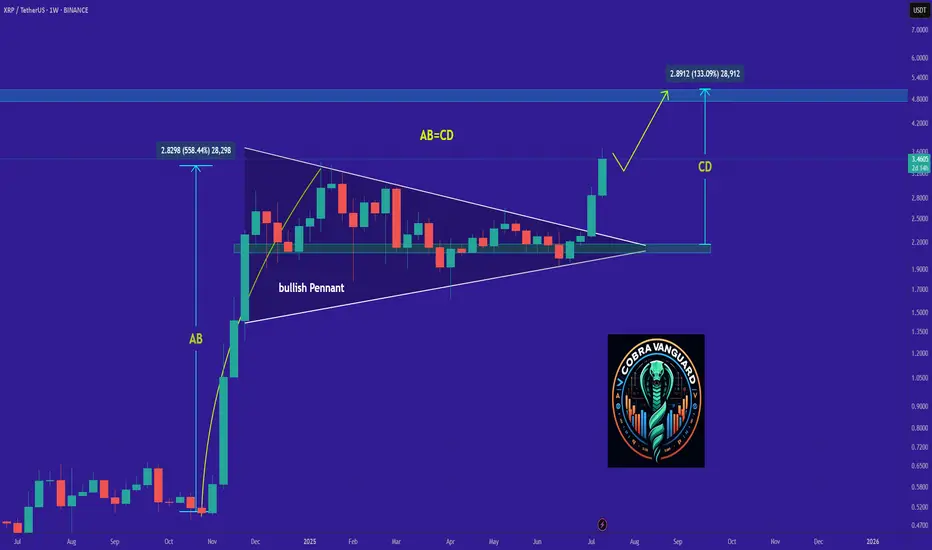
Be careful with RIPPLE !!!The pennant pattern has been broken, and the price follows an AB=CD pattern, targeting a rise above the 5 dollar.
Best regards CobraVanguard.💚
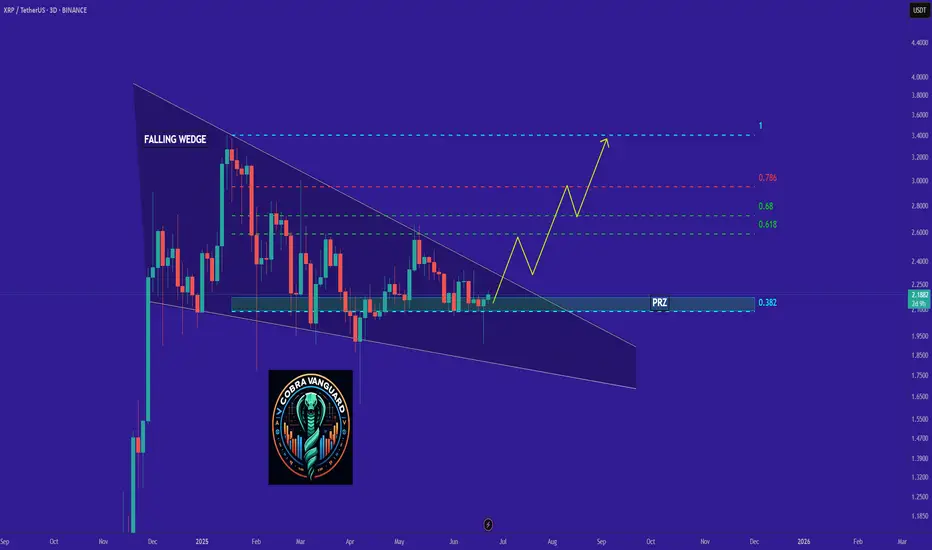
XRP's situation+ Target PredictionThe XRP is in a Bullish phase by a Falling Wedge Pattern.
A falling wedge indicates the potential for price to reach to $3.
Note if the PRZ ZONE is broken downwards with the strength of Bearish candles , this analysis of ours will be failed.
Best regards CobraVanguard.💚
XRP AccumulationI'm looking for a Model 2 on XRP, either from the liquidity, extreme demand, or extreme liquidity.
Is This the Last Dip Before XRP Hits $4+!CRYPTOCAP:XRP looks ready for another big move! 🚀
Price might drop to around $3.32, a strong support zone with Fib and trendline.
That dip could be a great buy opportunity.
If it bounces, we could see $4+ next.
#XRP

DeGRAM | XRPUSD continues to move in the channel📊 Technical Analysis
● Aggressive breakout from the 8-week green consolidation box has pierced both the purple ’23 trend-cap and inner wedge roof; pull-backs are holding above the prior 2.71 swing, confirming a fresh demand flip.
● Price is now tracking the mid-July parabolic support inside the black rising channel; the next confluence lies at the channel crest / Feb supply 3.11, implied by the 40¢ measured move of the July flag.
💡 Fundamental Analysis
● CME CF announced a cash-settled XRP reference rate for institutional derivatives, boosting open interest and signalling deeper liquidity ahead of the 23 Jul SEC status hearing.
✨ Summary
Long 2.70-2.80; hold above opens 2.88 → 3.11. Invalidate on a 6 h close below 2.60.
-------------------
Share your opinion in the comments and support the idea with a like. Thanks for your support!

$XRP is ready for another big move! CRYPTOCAP:XRP is ready for another big move! 🚀
Resets will be a buying opportunity.
Keep an eye on it.

Agar kok trend linyani buzsa 3 touchpuint boladi va sellIf a trendline is tested three times and then breaks out, there's a high chance the price will drop. But if it holds, the level may become even more significant.

1D XRP/USDT Projection, non-operable areaCurrently in the selling zone, I am selling 50% of my XRP capital, possible buyback zones down $3.

XRP ideaLooking to add long around 3.43
Expanding rising wedge and volume tapering off. 3.50 tough spot.
Rinse, repeat 🚀

XRP: 100% Gain in couple of weeks!Get ready for 100% surge in the coming weeks, but before that another low to grab liquidity is essential.
Place your buy order around 2$ mark and enjoy.
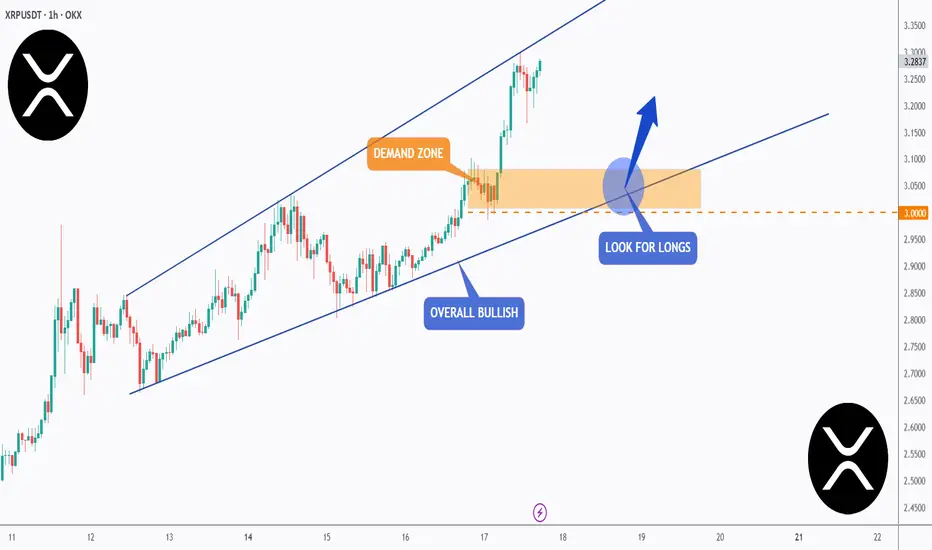
XRP - One More Wave Soon!Hello TradingView Family / Fellow Traders. This is Richard, also known as theSignalyst.
📈XRP has been overall bullish trading within the rising wedge pattern in blue.
However, it is approaching its all-time high at $3.4.
🏹 The highlighted blue circle is a strong area to look for buy setups as it is the intersection of the orange demand zone and lower blue trendline acting as a non-horizontal support.
📚 As per my trading style:
As #XRP retests the blue circle zone, I will be looking for bullish reversal setups (like a double bottom pattern, trendline break , and so on...)
📚 Always follow your trading plan regarding entry, risk management, and trade management.
Good luck!
All Strategies Are Good; If Managed Properly!
~Rich
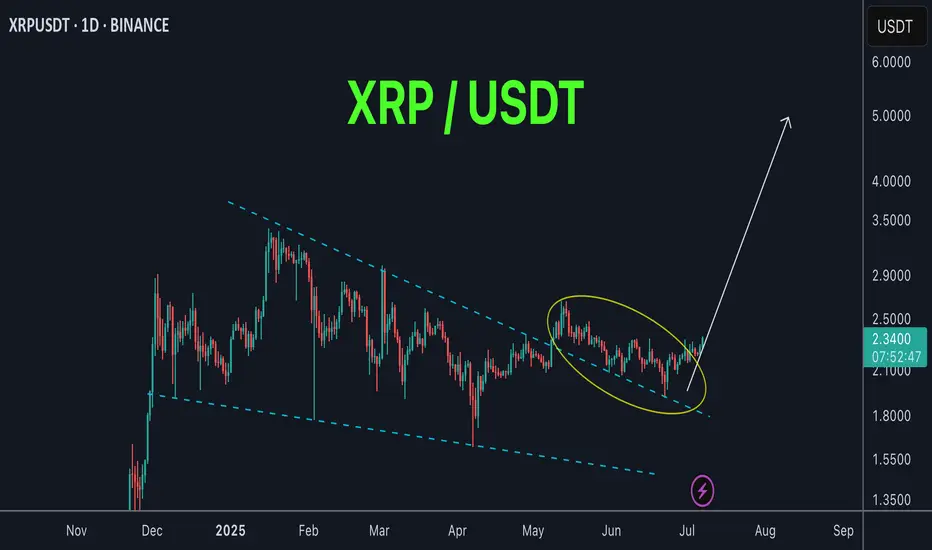
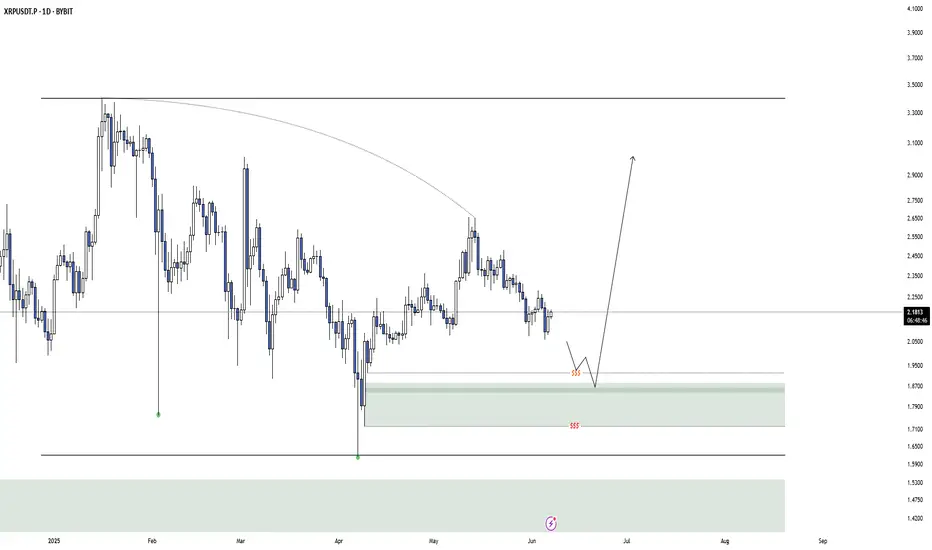
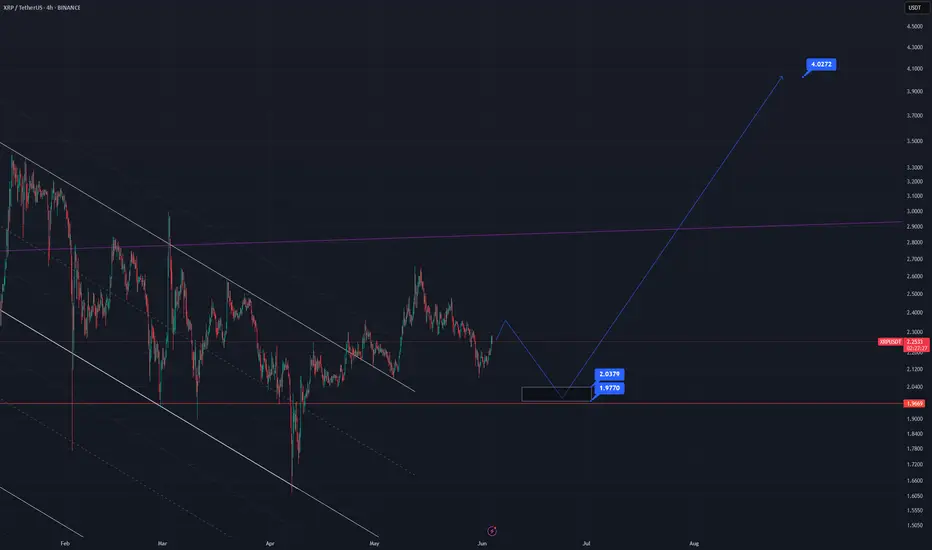
XRP’s Descending Trendline Showdown: Is a Breakout Toward $4From a purely technical‐analysis standpoint (not financial advice), here are a few observations and ideas you can take into xrp/usdt
1. Descending Trendline Resistance
- Price has been making lower highs, forming that yellow descending trendline. A sustained break and close above it (on higher‐than‐average volume) would be a strong bullish signal.
- If price rejects at the trendline again, that often implies more consolidation or another leg downward, so watch how price reacts if/when it retests that line.
2. Moving Average Context
- It looks like the market is hovering near or just below a key moving average (blue line). If the price can reclaim that moving average and stay above it, it typically signals renewed bullish momentum. Conversely, continued closes below it can cap upside.
3. Key Support Zones
- The pink/gray box in the chart (roughly the 2.0–2.1 area) seems to be an important support region; buyers have stepped in there before.
- Below that, the 1.77–1.80 area looks like a major support “floor” (dotted line). If price were to break below that, it could trigger a deeper pullback.
4. Potential Upside Targets
- The horizontal level around 3.40 is the next big resistance if price can break out above the descending trendline.
- If bulls really take over and push through that 3.40 zone, a run toward 3.90–4.00 (as shown by the arrow) becomes more plausible.
5. Watch Volume and Momentum**
- Pay attention to volume on any breakout. A low‐volume push above the trendline can be a fakeout, whereas a strong volume surge confirms conviction.
- Oscillators (RSI, MACD, etc.) can help you gauge whether momentum is building or fading as price approaches resistance.
Overall, a breakout above the descending trendline plus a reclaim of the moving average would favor upside toward the mid‐3s or higher. Failure to break out, however, might lead to another test of that 2.0–2.1 support or even the 1.77 floor. Keep risk management in mind either way.
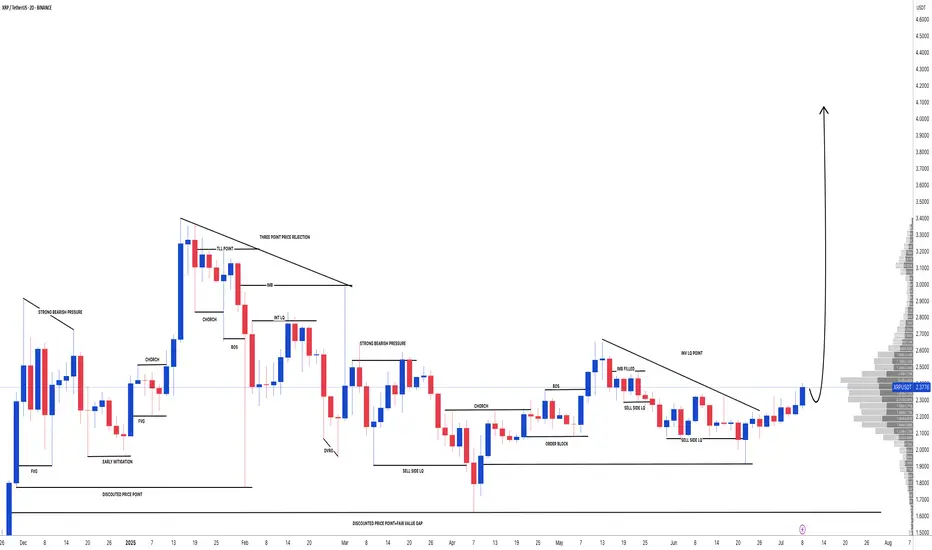
Four Failed Breakouts… Then the Real One HitThe $2.22 level stopped XRP dead in its tracks four times.
Each failed breakout built more pressure — and when it finally cleared, price exploded.
Now it’s trending clean, breaking structure after structure.
This is what a proper breakout looks like.
#XRP #XRPUSD #BreakoutTrading #ChartPatterns #FailedBreakout #CryptoSetup #BacktestEverything #TradingView #QuantTradingPro

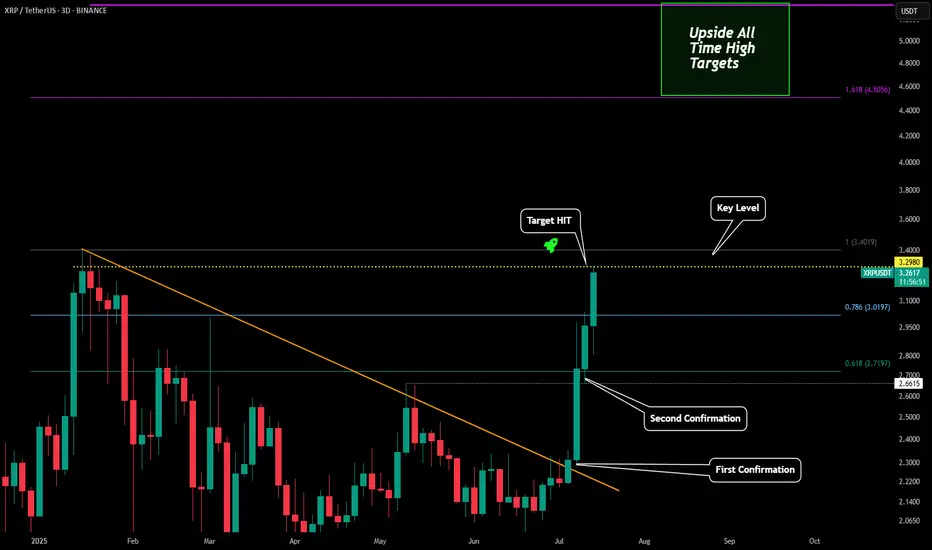
XRP - Perfect Prediction Please refer to our previous posts:
As stated in the last post our breakout target level (key level) was just hit. A 44% breakout move just occurred over the past 10 days due to the amazing analytics of the Viaquant system.
Now it is possible we see some profit taking in this region, but as soon as the last high is breached I have also outlined where to expect the next top to potentially come in at. Right now the range looks to be between $4.50-$5.33.
XRP may go furthermore!In my opinion, CRYPTOCAP:XRP has the opportunity to surpass $4 in the near future. It needs some rest and range above $3, and then the rising trend will start again.

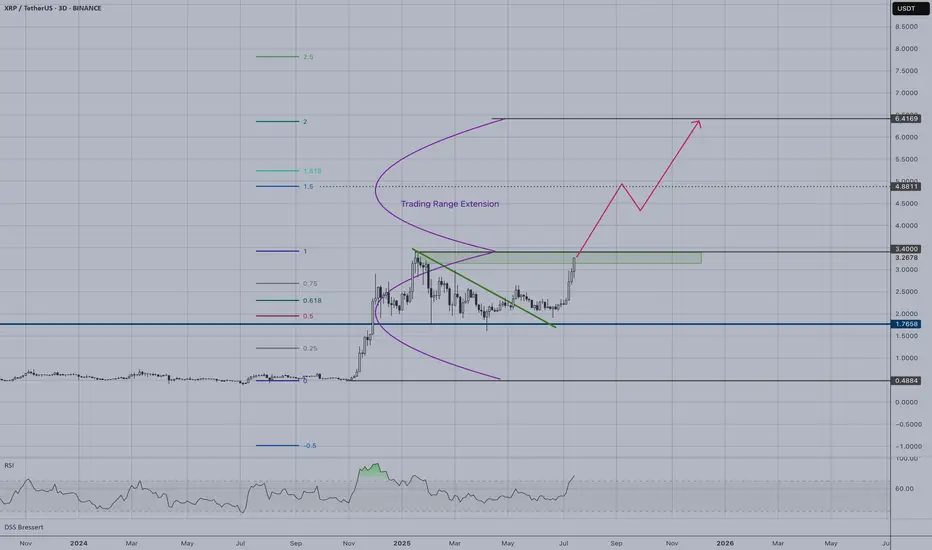
XRP | Up to New HighsXRP has successfully broken out of its consolidation pattern and is now targeting significant upside levels. A breakout from the green support zone around $3.27 will confirms the strong bullish momentum.
Key Technical Levels:
- Primary target: $6.42 (2.0 Fibonacci extension)
- Extended target: $7.50+ (2.5 Fibonacci extension)
Trade Setup:
- Support zone: $3.27 (former resistance now support)
- Stop loss: Below $3.00 to protect against false breakouts
- Risk/reward: Favorable with multiple upside targets available
Technical Outlook:
The projected path suggests continued upward momentum with potential pullbacks to retest the breakout level. RSI shows room for further advancement without being severely overbought.
XRP Hits $3.10 — Rising Wedge or Ready to Fly?XRP has been on a strong run over the past 24 days, rallying from $1.90 → $3.10 — a +62% price increase. But after hitting key resistance, is XRP about to correct, or will it break out further? Let’s dive into the technicals.
🧩 Market Structure
Rising Wedge Pattern:
The current market structure resembles a rising wedge, with XRP likely completing wave 5.
Rejection Zone Hit:
Price tapped the nPOC at $3.10 and rejected — providing a clean short opportunity.
📉 Key Support Levels & Confluences
Taking the full 24-day bullish move:
0.382 Fib Retracement: $2.6326 — aligns with liquidity pool below the $2.6596 swing low.
226-day Trading Range VAH: ~$2.62 (red dashed line) — adds confluence.
Daily Level: $2.60 — further support.
Anchored VWAP from $1.90 Low: ~$2.54 (rising over time).
✅ Conclusion: The $2.66–$2.60 zone is a critical support area and offers a solid long opportunity.
Trade Setups
🔴 Short Setup (After Breakdown Confirmation):
Wait for a sell-off & breakdown of the wedge.
Ideal entry: retest of the lower wedge edge, ideal short entry would be between 0.618–0.786 fib retracement.
🟢 Long Setup:
Entry Zone: $2.66–$2.60
SL: below VWAP line
Target: Fib 0.618 as TP
🧠 Educational Insight: Rising Wedges Explained
A rising wedge is a bearish pattern, often signalling weakening momentum as price climbs within narrowing highs and lows.
Key points:
➡️ Volume typically declines as the wedge matures.
➡️ Breakdown below the lower wedge edge often triggers stronger sell-offs.
➡️ Retests of the broken wedge support turn into ideal short entries.
Pro tip: Combine wedge patterns with fib retracement zones and VWAP levels for higher-confidence setups.
Watch for wedge breakdown confirmation before shorting.
_________________________________
💬 If you found this helpful, drop a like and comment!
Want breakdowns of other charts? Leave your requests below.

XRP new movement soon !XRP / USDT
XRP is on a long retest after breakout of accumulation zone weeks ago
successful retest here will result in strong bullish rally !
Keep an eye on it in the coming days 👀