XRP/USDT: Bullish Reversal Setup at EMA 200 & Daily OversoldHello traders,
I'm seeing a compelling long setup forming on the XRP/USDT 4H chart. While the immediate trend has been bearish, multiple key indicators are now signaling that a significant bounce or reversal is highly probable.
1. Trend & Context (The "Why")
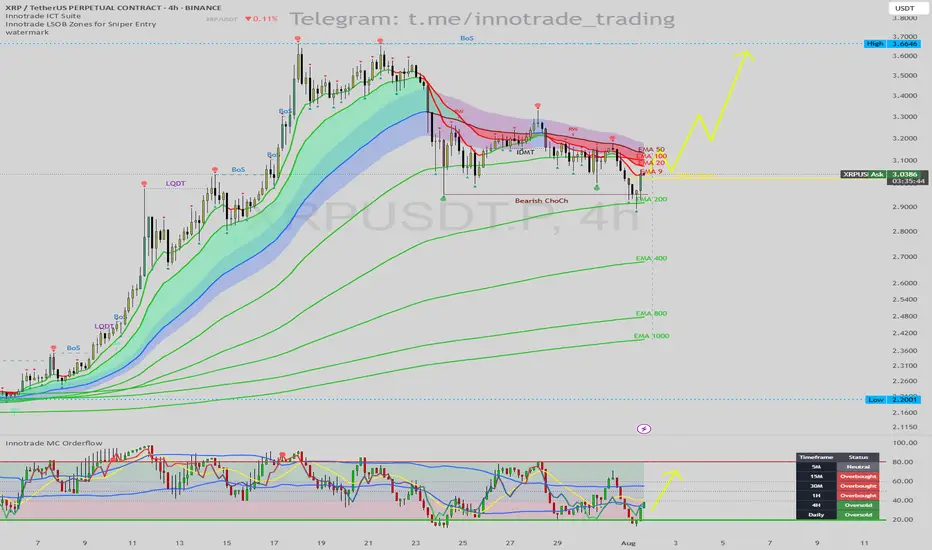
After a strong uptrend, the price has experienced a pullback, confirmed by a Bearish Change of Character (ChoCh). However, the price has now reached a critical support level where we can look for long opportunities.
Key Price Action Support: The price is currently finding support directly on the EMA 200. This is a major long-term moving average that frequently acts as a strong floor for price during a pullback.
Momentum Exhaustion Signal: The Innotrade MC Orderflow oscillator is giving a powerful confirmation for a potential bottom:
The oscillator is deep in the OVERSOLD zone (below 20), indicating that selling pressure is exhausted.
CRITICAL MTF CONFLUENCE: The Multi-Timeframe Cycle Table is the key to this trade. It shows that both the 4H and Daily timeframes are "Oversold". When higher timeframes like the Daily show exhaustion, it significantly increases the probability of a strong reversal on lower timeframes.
2. Entry, Stop Loss, and Targets (The "How")
This setup provides a clear, high-probability trade plan with a good risk-to-reward ratio.
Entry: An entry around the current price ($3.03 - $3.05) is viable as we are at the EMA 200 support. For a more conservative entry, wait for the MC Orderflow oscillator to cross back above its yellow MA.
Stop Loss (SL): $2.89. This places the stop loss safely below the recent swing low and the EMA 200. A break below this level would invalidate the bullish thesis.
Take Profit (TP) Targets:
TP1: $3.25 (Targeting the cluster of short-term EMAs and the recent swing highs).
TP2: $3.40 (The next logical area of resistance from the previous price structure).
TP3: $3.66 (The major swing high, a longer-term target if the bullish trend resumes).
Conclusion
This trade idea presents a strong case for a long position. The combination of a major technical support level (EMA 200) with a confirmed multi-timeframe momentum exhaustion signal (Daily Oversold) creates a high-probability environment for a bullish reversal.
Disclaimer: This is not financial advice. This analysis is for educational purposes only. Always conduct your own research and manage your risk appropriately.
XRPUST trade ideas
XRP Update · What To Expect Short-TermRetraces should be considered a buy opportunity. It is the only time when prices are not rising. Whenever there is a stop, a retrace, that is an opportunity to enter or buy more before the continuation of the bullish trend.
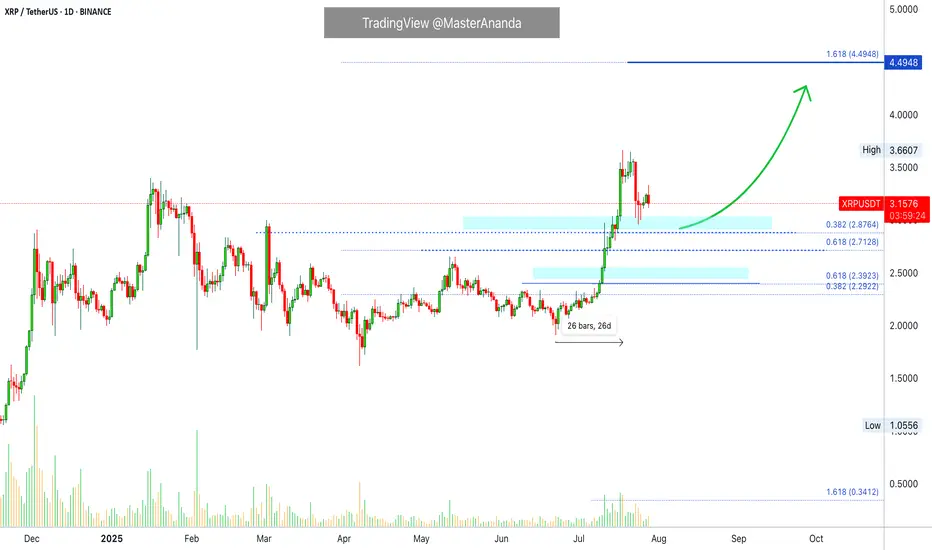
XRP started its latest major advance 22-June growing for 26 days straight peaking 18-July. there were only two red days in the entire move. This is certainly a strong advance and resulted in a new all-time high. More than 90% growth. After a strong move, there is always a pause, or correction or retrace.
A retrace can last a few days. Seeing this chart, here it can even last for weeks as I see no hurry on this chart. Prices can consolidate at support before the next advance. Some small swings are expected but nothing big and always knowing that the end result will be an advance going further toward $4.44. The bigger picture.
Do not try to SHORT within a retrace or even correction. It can lead to disaster. It is better to wait for support to show up and once confirmed buy LONG. The upside has no limitations while the downside is limited. It is harder and carries more risk, even more now that the market is bullish and people are starting to wake up. People can see the development of a major rise now, people are becoming aware and soon there will be a rush. This rush will fuel the next wave of growth.
XRP can consolidate for a little while after finding support before reaching higher. Market conditions remain strongly bullish for this pair. If support breaks, things can change.
Namaste.
#XRP Update #5 – July 29, 2025#XRP Update #5 – July 29, 2025
The long position we opened two days ago is still active, and as I mentioned earlier, I’m not planning to use a stop. In the previous trade, we took profit with 30% of our capital at the $3.33 level. Although there has been a pullback, I’m still holding the position. I have no intention of placing a stop and will continue by averaging down if necessary.
Currently, XRP has reacted from the K-Level zone. Its target is the $3.93 level, but the first major resistance it needs to break is at $3.66. I’m continuing to hold the position for now.
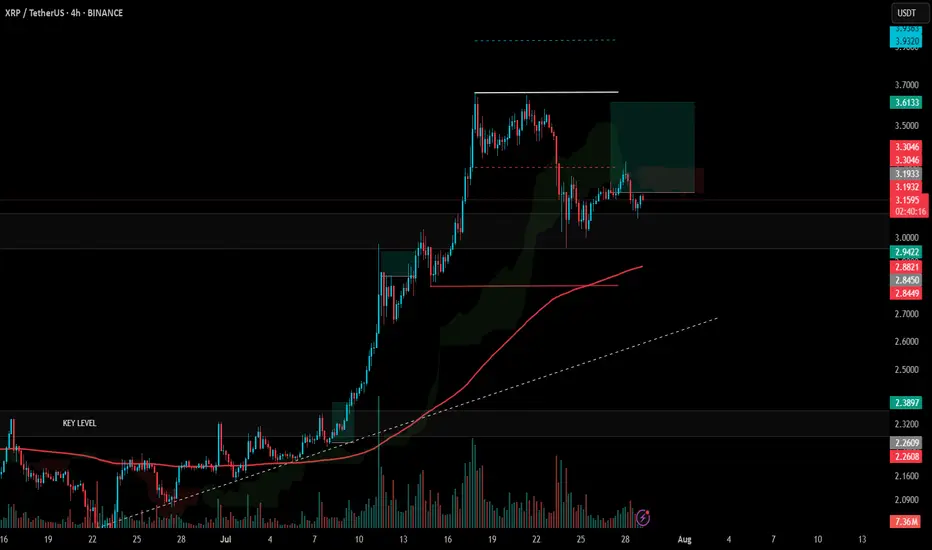
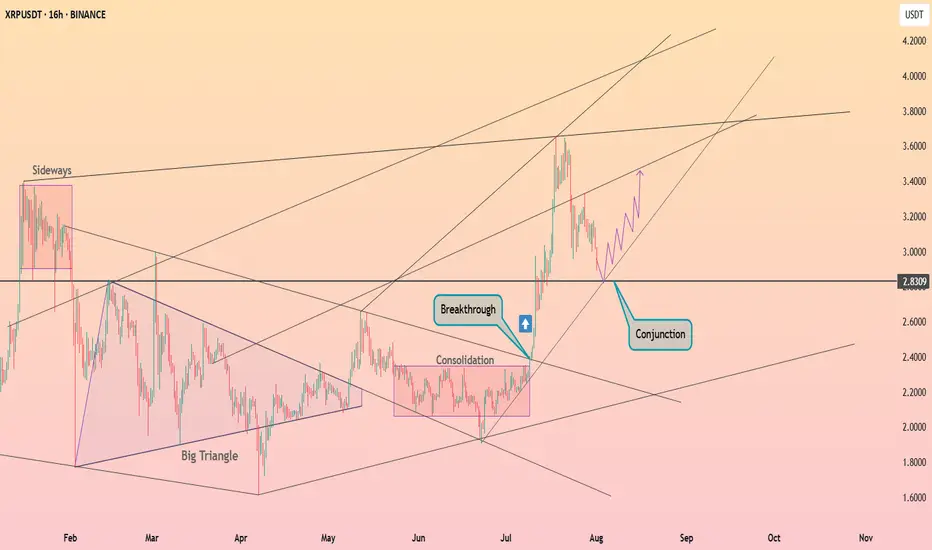
XRP continues to pullback ┆ HolderStatBINANCE:XRPUSDT surged above $2.83 after consolidating in a tight range. Price is now retesting the breakout zone at a key structural conjunction. If the level holds, a renewed move toward $3.40 may follow as bulls reclaim control.
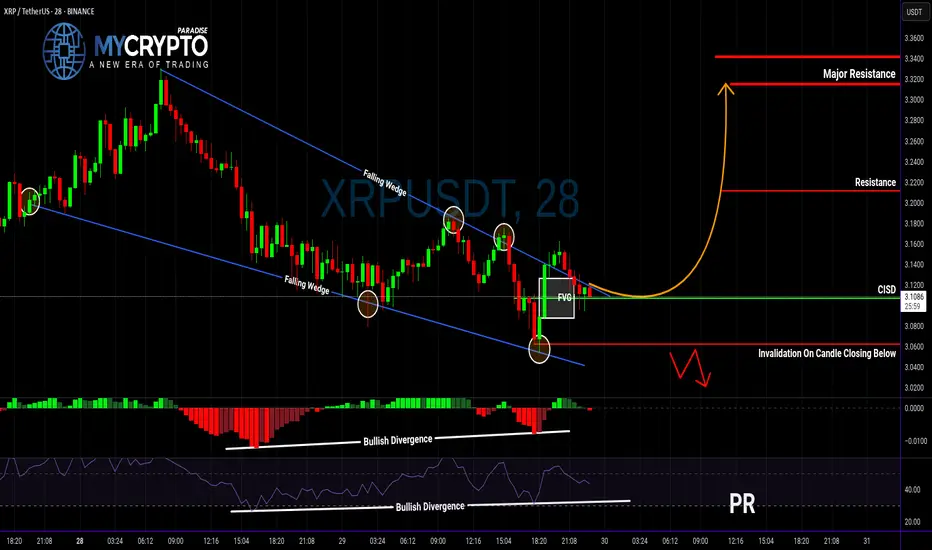
XRP Breakout Could Be a Trap… Or the Start of Something Big?Yello, Paradisers — are you about to buy into a fake breakout or position yourself right before a major move? Let’s break it down before emotions take over.
💎XRPUSDT has officially broken out of a falling wedge — a classic bullish reversal structure. What makes this breakout even more interesting is that it's supported by bullish divergence on both MACD and RSI, plus a Change In State of Delivery (CISD). All these technical signals combined significantly increase the probability of a bullish continuation.
💎Now, if you’re a disciplined trader looking for a safer entry with a higher risk-to-reward ratio, the smart move is to wait for a potential pullback to the CISD level. That would set up an opportunity offering a risk-to-reward of over 1:2.55 — not something you want to ignore.
💎But don’t get too comfortable…
💎If the price breaks down and closes below our invalidation level, the entire bullish idea is off the table. In that case, it’s wiser to stay patient and wait for clearer price action to develop. No emotional entries — only strategic moves.
🎖Strive for consistency, not quick profits. Treat the market as a businessman, not as a gambler. That’s how you’ll get inside the winner circle.
MyCryptoParadise
iFeel the success🌴
The Great XRP Escape Plan: Thief Strategy Deployed🌀 XRP/USDT – Thief Trader’s Master Heist Plan: Crack the Vault Before They Catch On! 🧠💰
🔐💸 Operation Code: Ripple Raid 3.9 - Eyes on the Prize, Hands on the Trigger 💥
🌍 Attention Global Market Robbers and Strategic Money Movers!
This ain't just another analysis—this is the Thief Trading Style Blueprint, surgically designed for the XRP/USDT Crypto Market. Whether you're a silent sniper or full-squad raider, this trade setup is your next high-voltage money heist.
🔍 Market Breakdown:
📊 Technical + Fundamental = Robbery Precision
Currently, Ripple (XRP) is showing bullish fuel—charging into our trap-the-bears zone. Volatility is tightening, resistance is trembling, and it smells like liquidity is about to get stolen.
⚠️ Warning: The market’s at a risky cross-zone – overbought with heavy consolidation – where big bears and trapped traders usually play defense. That’s exactly where we strike.
🔓 Entry Gameplan – “Wait, Trigger, Execute”
📈 Entry:
"The heist begins when the candle breaks the high and screams confirmation!"
Set Buy Stop Orders above the recent resistance (around 3.1000).
Alternatively, use Buy Limit Orders on pullbacks at key swing levels (15M or 30M timeframes).
We use a multi-layered entry strategy (aka DCA + stacking like a pro thief stacking vaults). Be surgical. Be patient.
📌 Pro Tip: Always set a chart alert at the trigger zone to avoid missing the breakout party.
🛑 Stop Loss – “Breakout First, Then Talk Safety”
🚫 NO SL BEFORE BREAKOUT. Period.
Once price breaks out, then:
🔐 SL = Nearest 4H candle wick swing low (around 2.8000).
But remember, your SL = your risk appetite.
Whether you're placing 1 big order or 10 mini traps, manage it smart.
🎯 Target – "Get Rich, Then Vanish"
🏴☠️ Primary Take Profit Zone:
Target: 3.9000
Or exit anytime you see signs of reversal.
Don't get greedy—get paid.
👀 Scalpers’ Note:
Only play the Long side.
If you're deep-pocketed, dive in straight. If not, ride with swing traders and trail your SL to protect profits.
🔥 Why This Trade is 🔐:
📈 Current price structure, liquidity zones, and momentum favor bulls.
📊 Correlated intermarket signals + on-chain activity + macro backdrop align with XRP strength.
🧠 Smart money accumulation is visible – this is your window before the big breakout.
🚨 News & Position Management Alert:
📢 Stay clear of opening trades during major news events.
Use Trailing Stop-Loss on running positions to lock gains while letting profits fly.
This is not hype. This is precision.
Thief Trader doesn’t guess – we plan, we trigger, we exit.
📌 Final Words:
Whether you're scalping seconds or swinging for days – follow the blueprint. XRP has a vault to crack, and we’re here to rob it clean.
Now go out there, set those traps, and let the market pay you like it owes you.
🧠💸🕶️ Next Heist Plan Coming Soon… Stay Sharp.

XRP may being its upward" Ripple (XRP) may begin its upward move from the price levels of 2.8865, 2.7984, and 2.6634, aiming for a first confirmed target at 3.6641 and then $4." BINANCE:XRPUSDT

XRP 1H – 21% Decline Off the HighAfter hitting a strong resistance near $3.75, XRP has been in a steady downtrend, losing over 20% from its peak. The chart shows clear lower highs and a strong descending resistance line capping every bounce. Price action remains bearish, but short-term momentum (via Stoch RSI) shows signs of being oversold — hinting at a potential relief bounce.
To flip bias, bulls would need a clean break of the trendline and reclaim the $3.15–$3.25 area. Until then, lower highs + sustained sell volume = caution for longs.
📌 20.6% decline
📌 Downtrend intact
📌 Momentum diverging — bounce or continuation?
This setup is primed for a mean-reversion or further breakdown — stay reactive, not predictive.

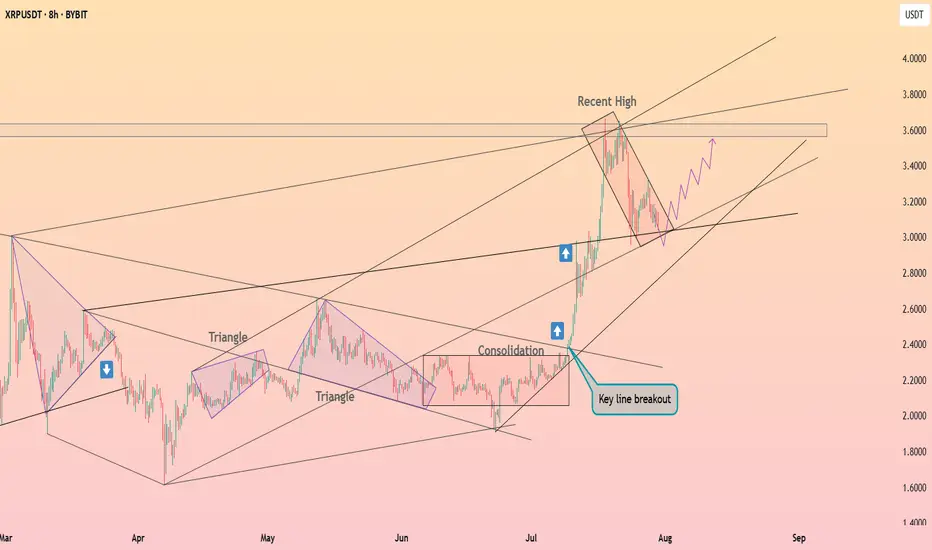
XRP is testing a support ┆ HolderStatBYBIT:XRPUSDT recently broke out of a long consolidation and triangle setup, rallying into the 3.60 region. It is now forming a falling channel — a common bullish continuation pattern. Price must hold the 3.10–3.20 support area for a renewed move toward 3.80–4.00. The broader structure remains bullish until invalidated.
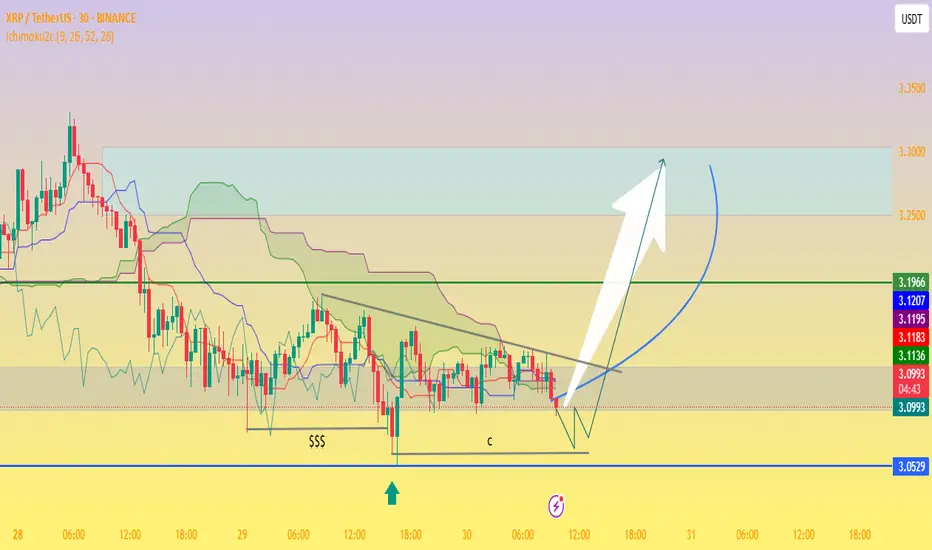
XRP/USDT Potential Reversal Zone — “Bottom Tested,Bullish Flag!📉 Chart Analysis Summary
The divided chart indicates XRP trading between a critical support zone near $3.05–$3.09 and overhead resistance around $3.19–$3.23, forming what could be a bullish pennant or descending wedge setup on the 30-minute timeframe:
Support Zone (~$3.05–$3.09):
Price retested this level multiple times (labeled as “$$$” and “c”), clearly identifying a demand zone.
Ichimoku cloud support lies nearby, adding technical relevance to the floor.
Resistance Trendline & Green Line (~$3.19–$3.23):
A descending trendline is visible, showing lower highs and building compression.
A breakout above this resistance zone is necessary to signal bullish continuation.
Projected Path:
The schematic arrow suggests a bounce off support, followed by consolidation, and then a breakout above resistance, targeting the $3.25–$3.30+ zone and potentially higher.
🔍 Context from Recent Market Commentary
Support Holding Above $3.11–$3.15: Analysts highlight strong support around $3.11–$3.15, where institutional and retail interest appears concentrated
TradingView
+13
TradingView
+13
CoinCentral
+13
.
Resistance & Consolidation at $3.30: While XRP briefly surpassed $3.30, it encountered rejection and remains rangebound. A confirmed break beyond this level could validate the bullish carry-forward
CryptoPotato
CoinDesk
.
Wave-Elliott Bull Case: Various Elliott Wave scenarios forecast targets as high as $5.25, $6.85, or even $10–$15 should Wave 5 materialize, though this depends on market strength and momentum
CoinCentral
.
✅ Trading Outlook
Bullish Scenario:
Bounce off $3.05–$3.15 support.
Break above $3.23–$3.30 resistance.
Potential upside targets:
Near term: $3.30–$3.40.
Medium term: $4.64 or $5–$6, with strong case for $6.85 if momentum and on-chain demand strengthen
CryptoPotato
+15
TECHi
+15
CoinGape
+15
.
Bearish Scenario:
Failure to hold $3.05–$3.11 risk retest toward $2.95 or lower zones ($2.30–$2.70)
TECHi
.
🧭 What to Watch
Key Level Role
$3.05–$3.11 Critical support/demand zone
$3.19–$3.23 Short‑term resistance/framing compression
~$3.30+ Confirm bullish breakout — key trigger for Wave 5 and higher targets
🧠 Overall Take
This chart is painting a classic consolidation near strong support with a visible descending upper boundary. If XRP holds the ~$3.05 zone and breaks above $3.23–$3.30 with conviction, it could initiate a bull move toward $3.40–$4.00, and potentially even $5–$6+ depending on volume and momentum.
However, breaks below $3.11 may open deeper downside risk. For many traders, this is a simple risk-reward setup: entry near the lower channel with a stop under $3.05 and initial profit targets at $3.30–$3.40.
XRP 4H – Precision Bounce from Golden Pocket After All-Time HighXRP just executed a perfect technical pullback — retracing into the golden pocket (0.618 Fib) after hitting its all-time high. The 4H chart shows textbook structure: a breakout, clean Fibonacci retracement, and an instant reaction from key levels.
📍 0.786 (2.28) marked the original breakout
📍 0.618 (2.58) triggered an aggressive bounce
📍 0.5 (2.79) saw instant rejection on the rebound
📍 All-time high resistance still looms above ~$3.75
What makes this setup especially clean is how XRP respected each Fib level like a playbook — reacting on the dot while Stoch RSI reset completely and flipped upward.
This could be the beginning of a bullish continuation… if we reclaim the mid-range and break above $3.30–$3.50 cleanly.
Until then, this is prime territory for range-bound volatility.
How are you playing it: swing long, short fade, or watching for confirmation?
👇 Drop your setup below.


XRPUSD LongWe just finished the 5th wave as exspected and allready started the 1st wave of the next bullish move. I will wait for a correction and enter a long position.
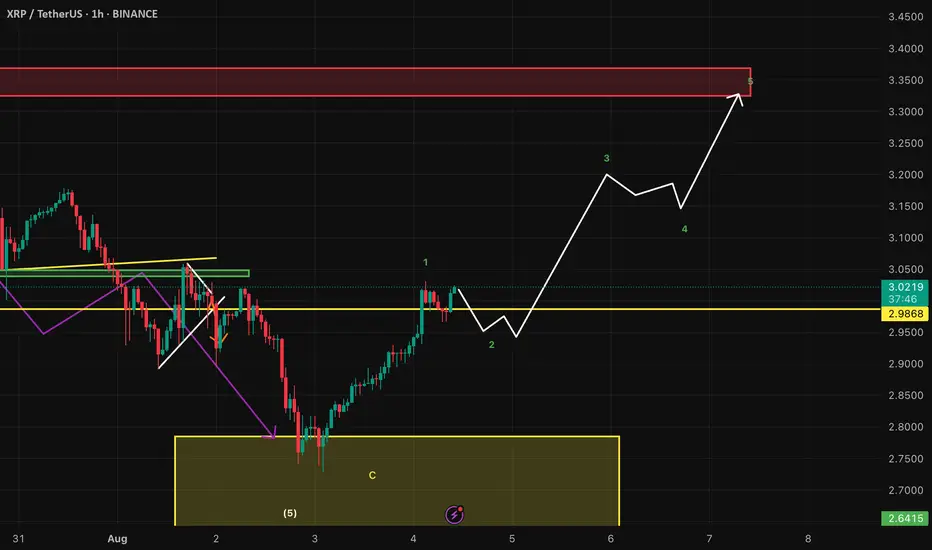
Ripple (XRP/USDT) Technical Analysis – 1H Timeframe🔰 Current Market Context:
After breaking below the ascending channel near $3.50, XRP has entered a corrective phase within a descending channel. Price is now hovering around a mid-range resistance zone, and we can outline two key potential scenarios from here:
⸻
📌 Scenario 1 (Sc1) – Immediate Rejection and Bearish Continuation
In this case:
• Price gets rejected from the current resistance zone ($3.05–$3.10).
• A quick corrective pattern (likely a Zigzag or Flat) plays out.
• XRP moves down to test the next demand zone near $2.70–$2.65, breaking below recent swing lows.
✅ This scenario aligns with the current weak structure and visible sell-side pressure. Liquidity above recent highs has likely been swept, creating a setup for continuation downward.
⸻
📌 Scenario 2 (Sc2) – Extended Correction with a Final Bull Trap
In this case:
• Price pushes higher toward a deeper resistance zone near $3.30–$3.40.
• A liquidity grab above the prior highs triggers a sharper reversal afterward.
• The overall structure could form a Diametric or Complex Correction, suggesting a deeper and more time-consuming wave before resuming the bearish trend.
⛔ This scenario requires strength and acceptance above $3.15, and should be treated as an alternative unless proven by price action.
⸻
🎯 Summary & Trade Strategy:
Scenario 1 is currently more probable unless we see a strong break and close above $3.10. Expectation: XRP may head toward the $2.70–$2.65 demand zone if resistance holds.
⚠️ Avoid entering early. Wait for confirmation via internal BOS (Break of Structure), bearish engulfing near OB zones, or signs of rejection with volume at resistance.

XRP/USD 1:4 RRBullish sentiment targeting ATH
Bouncing off break and retest of downtrend
LIQ swept already, feels like the bottom is in and ready for another leg up
Lets see....

XRY to 4.50 next weekthe case with the sec lines up with the cup and handle formation. it will pop after news gets out next Friday.

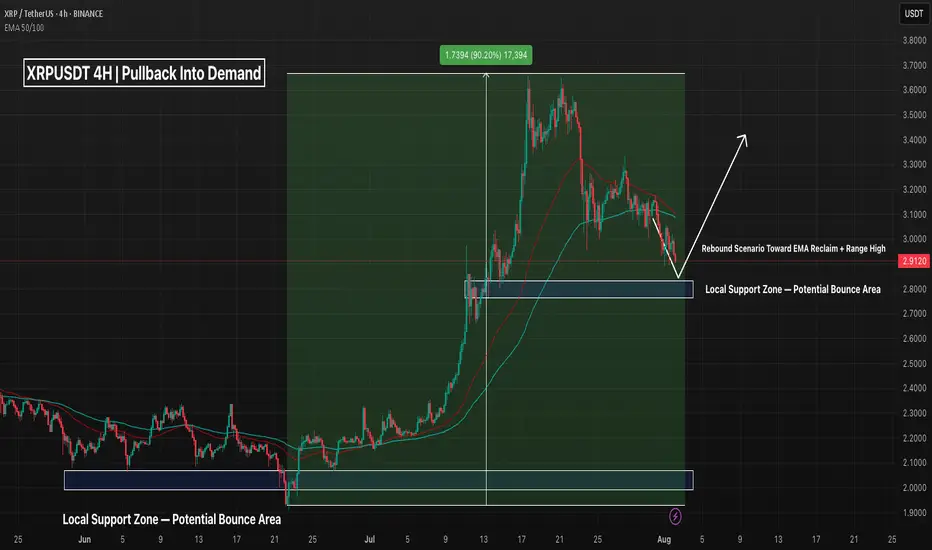
XRPUSDT 4H – Pullback Into Support, But Will This Bounce Stick?XRP has retraced nearly 25% off its local highs after a powerful +90% move in July. Price is now pulling back into a well-defined demand zone around 2.85–2.88, which previously triggered the breakout impulse.
📌 What’s notable:
Clean retest of demand + price hovering above the final bullish structure
EMAs are overhead, but not yet fully bearish — a reclaim could flip short-term bias
The lower demand zone (~2.15–2.25) still stands as a last line of defense from the original rally base
This bounce attempt is key — a strong push from here could send price back toward the $3.30–3.50 region. But if bulls fail to hold, there’s room for a deeper retracement.
Trade Planning Notes:
Aggressive Long: Entry on wick into support with tight invalidation
Conservative Long: Wait for EMA reclaim confirmation
Bearish Case: Breakdown = target $2.25 zone
The path from here decides whether this is a healthy pullback — or the start of a reversal. What’s your play? 👇
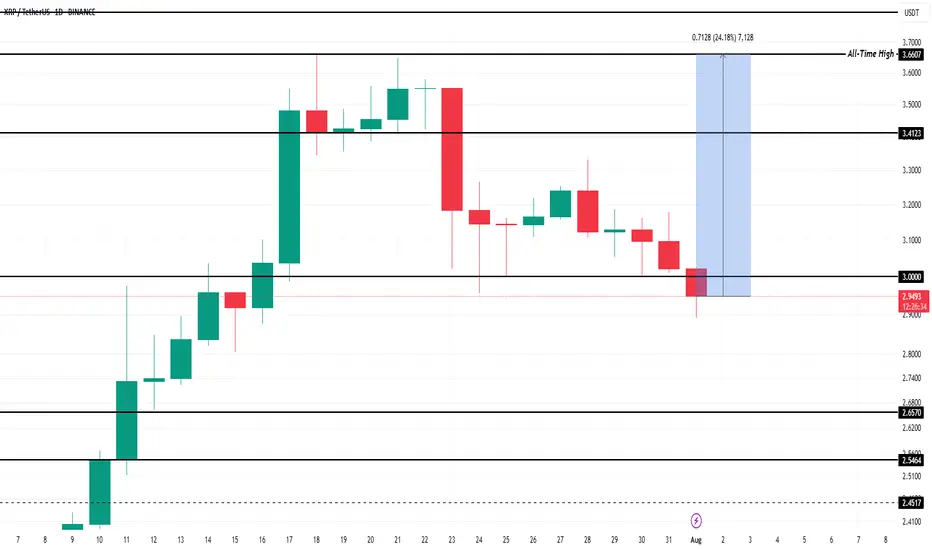
What To Expect From XRP In August 2025?Currently, BINANCE:XRPUSDT is trading at $2.99, slipping through the key support level of $3.00. While the altcoin is still over 22% away from its ATH of $3.66 , the foundation for potential growth remains strong. Historical data has shown that August typically brings bearish momentum for BINANCE:XRPUSDT , with median monthly returns of -6% .
However, given the strong buying activity observed recently and the positive technical indicators, this August might defy the usual trend. If BINANCE:XRPUSDT manages to secure support above $3.41, the altcoin could push towards its ATH once again . Alexis Sirkia, Captain at Yellow Network, discussed with BeInCrypto how XRP’s future could be looking like.
“Institutions that have been in the market for a while are gaining momentum. We're also, in the meanwhile, in a macro environment where funds are doing risk rotation… BINANCE:XRPUSDT is taking its stand with regulation and infrastructure, not hype. That's what will endure in the long run. Short-term flows are fleeting, but the groundwork laid today will define the cycle to follow.”
However, there’s a downside risk. If BINANCE:XRPUSDT fails to reclaim the $3.00 support, the price could fall to $2.65, invalidating the bullish thesis. A drop to this level would mark a four-week low and would likely lead to further selling pressure.
XRP should be PumpedXRP pullback is ending. If the price does not break above $3, growth is likely go to 4$.

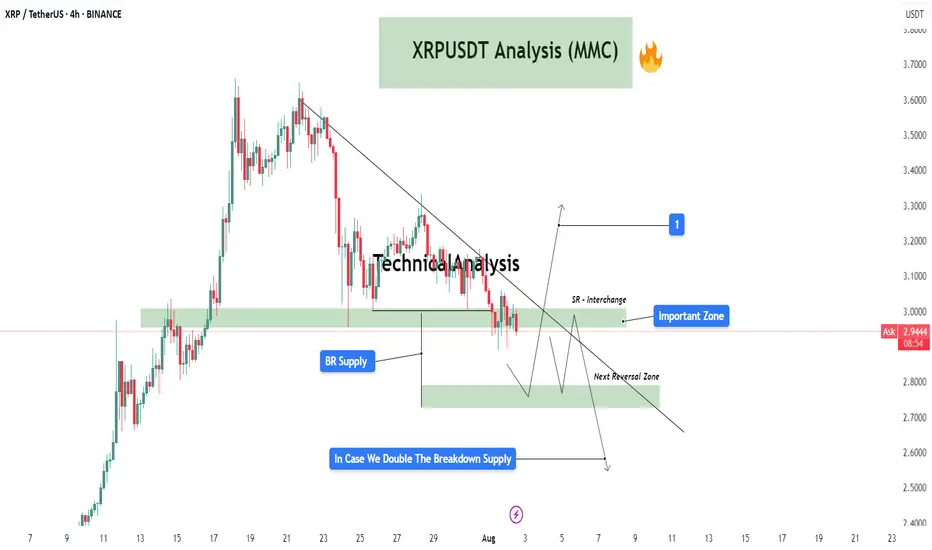
XRPUSDT Analysis (MMC) : Decision Point + Next Move Loading In this 4-hour chart of XRP/USDT, we're observing a critical structure forming under the Mirror Market Concepts (MMC) framework. Price action is compressing near an important descending trendline, suggesting that a breakout or breakdown is imminent. Let’s break it down zone by zone:
🔍 Key Zones & Price Structure:
Important Zone (SR Interchange Zone – $2.95 - $3.05)
This is a major supply-to-demand flip zone. It has served as both resistance and support in the past and is now acting as a potential interchange level. The price is hovering just below this area, retesting it after a significant bearish structure.
BR Supply Zone (Breakdown Retest Supply – $2.93 - $2.98)
After price broke down from this zone, it created a base for a retest. This level has since acted as a cap to further upside movement. It also coincides with the descending trendline, adding confluence to its strength as resistance.
Next Reversal Zone ($2.75 - $2.85)
In case the price fails to reclaim the Important Zone, we could see a bearish continuation move into the next zone of interest. This is a likely reversal or reaction area based on previous demand imprints and price imbalance.
SR Flip Watch
If price breaks above the trendline and sustains above the SR Interchange Zone, this could trigger a potential bullish breakout toward the $3.20+ region (labeled as target “1”). This move would be backed by trapped sellers and liquidity above the descending structure.
📈 Potential Scenarios:
✅ Bullish Case:
Break and close above the descending trendline.
Successful retest of the Important Zone as demand.
Push toward $3.20 - $3.30 where the next supply awaits (target 1).
❌ Bearish Case:
Rejection at the Important Zone and trendline resistance.
Breakdown below $2.90 confirms bearish pressure.
Possible liquidity sweep and reaction from the Next Reversal Zone ($2.75-$2.85).
If this zone fails to hold, continuation toward lower zones becomes likely.
🧠 MMC Perspective:
From a Mirror Market Concepts (MMC) standpoint, the market is currently at a reflection point where a decision between bulls and bears is about to play out. The clean diagonal structure plus clear horizontal liquidity pockets makes this setup ideal for anticipating manipulation traps and smart money moves.
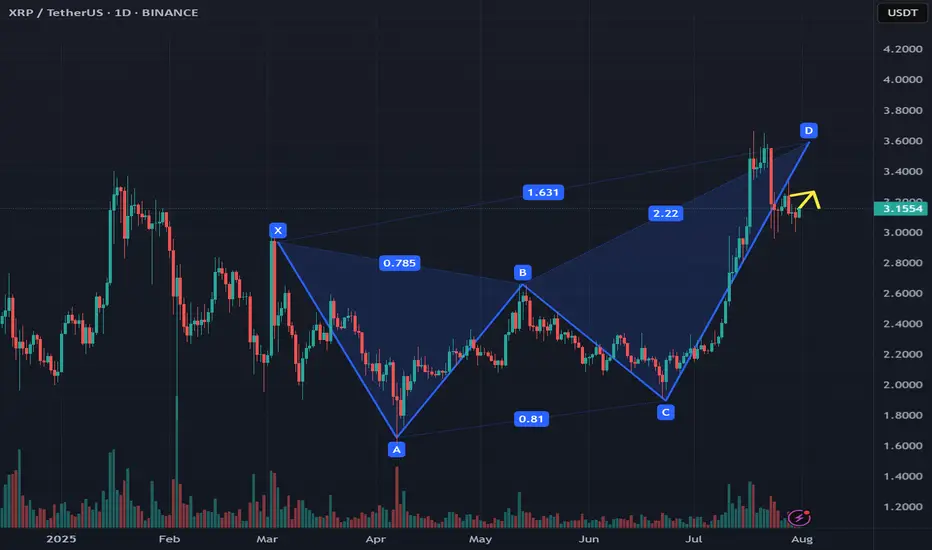
XRP Chart Nears Completion of Butterfly PatternXRP Chart Nears Completion of Butterfly Pattern – Potential Upside Movement Expected
On the XRP chart, there is an almost formed butterfly pattern, according to this pattern, the movement is more likely to go up
Current price: $3.149
With a high probability, the price can reach the $3.17 and $3.22 marks, if we reach them, then there is a possibility that we can go to $3.29
However, there is always a possibility of breaking through the pattern, and going to $3.061
This analysis is based on the technical pattern and also incorporates AI to provide more accurate results.
XRPThe primary regulatory catalyst boosting XRP's bullish outlook in 2025 is the resolution of Ripple Labs' long-standing lawsuit with the U.S. Securities and Exchange Commission (SEC). In March 2025, Ripple settled the case by agreeing to pay a $50 million fine, and crucially, it was clarified that XRP is not considered a security in the context of secondary market sales. This settlement removed years of significant regulatory uncertainty that had suppressed XRP's price and led exchanges to delist XRP. Following this resolution, major U.S. exchanges reinstated XRP trading, and institutional confidence in XRP surged, unlocking large-scale adoption and market participation by regulated investors.
Another key regulatory development providing bullish momentum is the passage of the GENIUS Act in the U.S. House of Representatives, approved around mid-July 2025. This legislation establishes a clearer federal framework for stablecoins and digital assets like Ripple's RLUSD stablecoin, further reducing regulatory risks and positioning XRP for broader mainstream utility and adoption.
In summary, the decisive legal settlement with the SEC and U.S. legislative progress (notably the GENIUS Act) have greatly clarified XRP's regulatory status, providing a green light for institutional entry through regulated channels such as exchange-traded funds (ETFs). The proliferation of XRP ETFs—including the approved ProShares XRP Futures ETF—amplifies this effect, enabling easier institutional and retail investment and fueling bullish price momentum
XRP Real-Life Use Cases in Finance
XRP REAL LIFE APPLICATION IN THE ECOSYSTEM.
1. Cross-Border Payments
XRP’s core financial use case is to act as a bridge for cross-border payments.
Traditional international money transfers often take days and involve high fees due to intermediary banks (the SWIFT system).
With XRP, financial institutions can instantly convert and transfer value across borders. Typical settlement times are 3–5 seconds, with transaction costs usually less than a cent.
Numerous global banks and remittance providers have adopted XRP and the RippleNet system to cut costs and provide real-time international payment services.
2. On-Demand Liquidity (ODL) & Liquidity Bridging
Banks and payment providers use XRP to manage liquidity.
With XRP as a bridge currency, financial institutions do not need to pre-fund nostro accounts in multiple countries. Instead, they can source liquidity ‘on demand’ using XRP, freeing capital and reducing operational costs.
On-demand liquidity flow improves cash efficiency and speeds settlements between a wide variety of global fiat currencies.
3. Micropayments
Due to low fees and fast settlement, XRP is suitable for micropayments.
This enables new use cases in digital content (e.g., pay-per-article, tipping creators) and gaming, where sending tiny amounts is otherwise unfeasible.
Such micropayment abilities open the door to innovative business models in finance and online services.
4. Tokenization and DeFi
The XRP Ledger supports tokenization of financial assets and decentralized finance (DeFi) use cases.
Financial firms can issue stablecoins or tokenized assets (including stocks, bonds, or other real-world assets) on-chain, fostering new kinds of investment products, automated trading, and settlement.
XRP’s ledger powers “sector-based index funds,” asset baskets, and other financial instruments, expanding real-world utility within decentralized finance.
5. Remittances
Remittance companies use XRP to offer faster and cheaper international transfers.
This is particularly valuable for migrant workers sending money home, reducing transaction times from days to seconds and cutting fees, thereby increasing the amount recipients receive.
6. Banking and Trade Finance
Some banks and trade finance platforms use XRP to improve operational efficiency.
By digitizing trade documentation and facilitating instant payments, XRP is helping modernize the traditionally slow and paperwork-heavy trade finance sector.
7. Collateral & Trading
XRP can be used as collateral in digital asset trading and arbitrage.
Traders and financial institutions leverage XRP for high-speed transfers between exchanges, using its liquidity to seize arbitrage opportunities and service margin calls rapidly.
Countries adopting XRP for real-life payments, especially cross-border transactions, include several key nations across Asia, the Middle East, and beyond. Here are some notable examples of countries actively integrating XRP into their financial systems and payment infrastructures as of 2025:
Japan: A pioneer in cryptocurrency adoption, Japan has multiple banks partnered with Ripple using XRP to streamline cross-border payments. The Bank of Japan and major institutions like SBI Holdings support XRP integration to provide faster, lower-cost international transactions across Asian markets.
United Arab Emirates (UAE): The UAE is proactively integrating blockchain technology, including XRP, with banks such as Zand Bank and fintech firms using Ripple’s platform for faster cross-border payments. Dubai’s financial initiatives leverage XRP to boost transaction efficiency within and beyond the region.
South Korea: Known for its vibrant tech ecosystem and supportive crypto regulations, South Korea has seen local banks experimenting with XRP to reduce international payment costs and increase speed, making it part of the broader fintech innovation landscape.
Mexico: Financial institutions in Mexico use XRP to improve remittances, especially those coming from the U.S., reducing processing time and fees significantly.
India: Given its large remittance market and fintech growth, India is exploring the use of XRP to address the need for low-cost, quick international payments.
Singapore: XRP adoption is growing here, with increasing numbers of users and integration of Ripple’s stablecoin RLUSD into payments.
United States: Some American banks and financial institutions are starting to integrate XRP for international payments, signaling growing institutional interest.
Canada: Banks like Canadian Imperial Bank of Commerce (CIBC) and remittance services use Ripple technology, including XRP, to enable faster cross-border money transfers.
Brazil: Various financial players collaborate with Ripple to modernize the country’s payment infrastructure using XRP.
United Kingdom: Institutions and fintech firms in the UK leverage Ripple’s technology for faster, cheaper international transactions.
Thailand and Sweden: Banks in these countries are partnering with Ripple to enhance their cross-border payment capabilities by leveraging XRP.
Egypt: Major banks are collaborating with Ripple to improve payment efficiency, including through XRP-based solutions.
In essence:
XRP directly addresses major friction points in global finance by cutting costs, increasing speed, and providing new ways for banks, companies, and individuals to move and manage money—all with increasing real-world adoption in cross-border payments, liquidity management, and digital asset innovation.

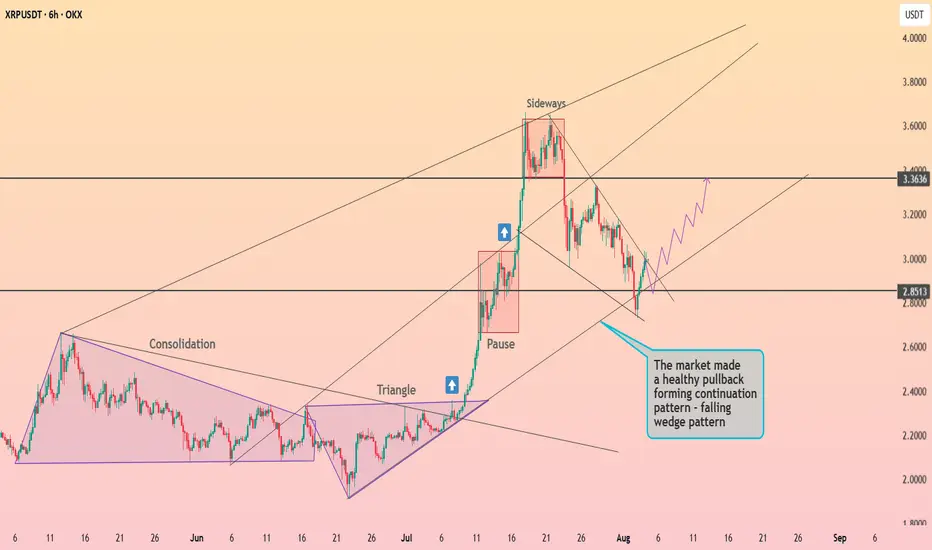
XRP is preparing to exit the wedge ┆ HolderStatOKX:XRPUSDT is forming a falling wedge after a sharp breakout and pullback. Price is stabilizing near $2.85, a key former resistance level. If bulls reclaim momentum here, a move toward $3.36 becomes a high-probability scenario.