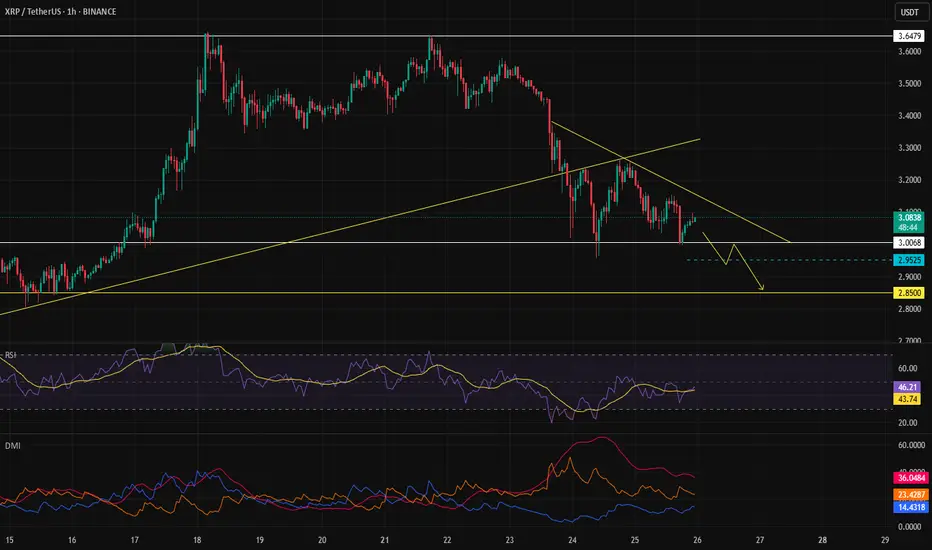
XRP - FUTURES SIGNALFUTURES SIGNAL
Coin: XRP
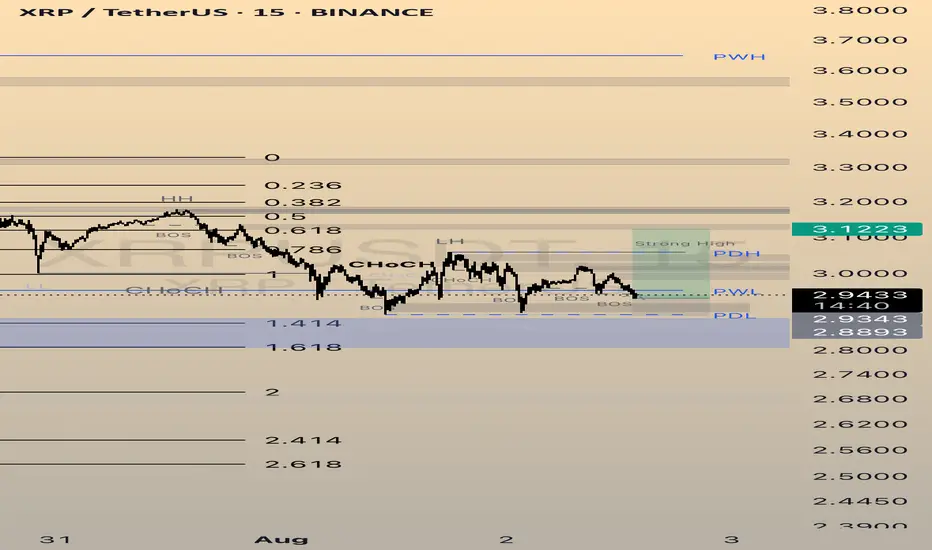
Direction: LONG
🟢Input range: 2,9358-2,9219
✔️ТР: 3,0116/3,0606/3,1223
❌SL: 2,8893
We try to carefully open a long position from the order block after the structure is broken on the 15-minute time frame. We enter at a reduced risk
XRPUST trade ideas
XRP Price Prediction: Is a Breakout to $15 Imminent? XRP Breakout Targets $15 — Analyst Says 'This Is Just The Start': Is XRP Set to Explode?
The cryptocurrency world is once again turning its attention to XRP, the token developed by Ripple Labs, as bullish analysts predict an imminent and explosive rally. After a strong run-up earlier in 2025, XRP has pulled back slightly and is now approaching a critical support zone. Some analysts are now calling for a $15 breakout target, even as the token hovers near $2.80, a level many see as a pivotal point for the next leg of the bull market.
Let's dive into the latest developments, technical analysis, and market sentiment surrounding XRP — and why some believe "this is just the start."
XRP Price Overview: Current Positioning
As of early August 2025, XRP is trading around the $2.85 mark, down from its recent high near $3.70. While this pullback may concern short-term traders, technical analysts argue that this retracement is healthy and necessary for the formation of a higher low, a common pattern in bullish market structures.
The key price levels to watch include a support zone between $2.80 and $2.95, resistance at $3.70, downside risk to $2.20 if $2.80 fails, and upside targets of $5 in the short term and $15 in the mid-term.
Why $2.80 Is So Important
The $2.80 support level is emerging as a make-or-break price zone. It aligns with multiple technical indicators including the 0.618 Fibonacci retracement from the previous rally, the Value Area High (VAH) from recent price accumulation zones, and Higher Time Frame (HTF) structure showing consistent support around this level in recent months.
If XRP manages to hold this level and establish a higher low, it could kick off a new bullish wave, potentially targeting $5 in the short term and beyond in the medium term.
Analysts Call for $15 XRP — Is It Possible?
Several key factors support the bull case. Institutional interest continues to grow as Ripple's partnerships with banks and financial institutions support long-term utility. Legal clarity has improved significantly after years of regulatory uncertainty, with the SEC lawsuit largely resolved, removing a major overhang. Technical indicators including bullish divergence on the RSI, MACD bullish crossover, and increasing volume all support upward momentum. Additionally, as Bitcoin stabilizes, funds are flowing into major altcoins, including XRP, as part of the typical altcoin rotation cycle.
August Rally Incoming? Bullish Divergence Signals 20% Upside
Technical analysts have identified a bullish divergence forming on the daily and 4-hour charts — a classic signal that often precedes a strong move upward. This divergence appears as the price makes lower lows while the RSI makes higher lows, suggesting momentum is shifting in favor of the bulls.
If confirmed, this divergence could catalyze a 20% rally in August, potentially pushing XRP back above $3.40 and testing the critical $3.70 resistance. A clean break above this level would likely open the floodgates for further gains.
$3.70: The Gatekeeper to Higher Highs
While there's excitement around the potential for XRP to hit $5 or even $15, the path forward must first go through $3.70. This resistance level has stalled price action multiple times in 2025 and will likely serve as a psychological and technical barrier.
Two scenarios are possible: a break above $3.70 would open the door to $5 and $7 targets quickly, while a rejection at $3.70 could lead to a pullback toward $2.20, especially if $2.80 fails.
Traders Hedge With New XRP Rival: Remittix
As XRP consolidates, some traders are diversifying their holdings into Remittix (RTX), a new cross-border payments token that promises enhanced scalability and compliance tools. RTX has gained traction recently, especially among DeFi-native traders seeking alternatives to XRP's centralized development model.
Remittix highlights include strong tokenomics with a deflationary model and staking rewards, a real-world use case targeting remittance markets in Asia and Africa, and a PayFi Wallet with beta slated for launch in Q3 2025, offering seamless integration with fiat on/off ramps.
While Remittix is gaining momentum, XRP's brand recognition, liquidity, and institutional partnerships still give it a significant edge in the payments space.
XRP Price Forecast: Short-Term and Long-Term Outlook
In the short term over the next 30 days, the bullish scenario involves holding $2.80 support, breaking $3.70, and rallying to $5. The bearish scenario would see XRP lose $2.80, drop to $2.20, and consolidate.
For the mid-term outlook in Q4 2025, if the bullish trend continues and macro conditions remain favorable, XRP could target $7 to $10 by the end of the year. In a full altseason scenario, $15 is not out of reach, according to some analysts.
Key Catalysts That Could Drive XRP Higher
Several catalysts could propel XRP higher. Institutional adoption continues to expand as Ripple's partnerships, especially in the Middle East and Asia-Pacific, lay the groundwork for long-term utility. CBDC integration presents another opportunity as Ripple works with multiple central banks on developing Central Bank Digital Currencies. Any progress here could significantly boost XRP's real-world use.
ETP listings could bring new inflows as XRP may benefit from exchange-traded products in Europe and Asia, especially if more crypto-based ETFs gain traction globally. The macro environment also favors growth, with a dovish Fed, weakening USD, and rising crypto adoption all creating a fertile environment for altcoins like XRP to thrive.
Community Sentiment: Is the XRP Army Ready?
The XRP community, also known as the XRP Army, remains one of the most passionate and active in the crypto space. Social media sentiment has turned increasingly bullish, with hashtags like #XRPToTheMoon and #XRP15 trending on X (formerly Twitter).
However, analysts caution against overexuberance, noting that market cycles can be volatile and unpredictable.
Risks to Watch
While the bullish case is compelling, it's important to consider the risks. Macro-economic shocks from a sudden shift in interest rates or recession fears could impact crypto markets broadly. Regulatory setbacks remain possible — although Ripple has gained legal clarity in the U.S., future regulations in Europe or Asia could cause volatility.
Network risks from any technical issues or security breaches could erode trust and trigger selloffs. Competition from new projects like Remittix, Stellar (XLM), and other payment-focused tokens could eat into XRP's market share.
Final Thoughts: Is XRP Set to Explode?
With XRP hovering near a critical support zone at $2.80, all eyes are on whether bulls can defend this level and push the token back into an uptrend. If successful, the next moves could be explosive, with analysts forecasting $5 in the short term and potentially $15 or higher before the end of 2025.
While risks remain, the technical setup, improving fundamentals, and renewed community optimism all point toward a bullish continuation — if key levels hold.
As always, investors should stay informed, manage risk, and avoid emotional decisions in this fast-moving market.
Summary
XRP currently trades around $2.85 with key support at $2.80 and major resistance at $3.70. Short-term targets point to $5 while mid-term projections suggest $10 to $15 is possible. Downside risk exists to $2.20 if support fails. Bullish catalysts include legal clarity, growing utility, and increasing adoption, while bearish risks encompass macro shocks, competition, and potential regulation.
Disclaimer
This article is for informational purposes only and is not financial advice. Cryptocurrency investments are highly volatile and involve significant risk. Always do your own research (DYOR) and consult with a financial advisor before making investment decisions.
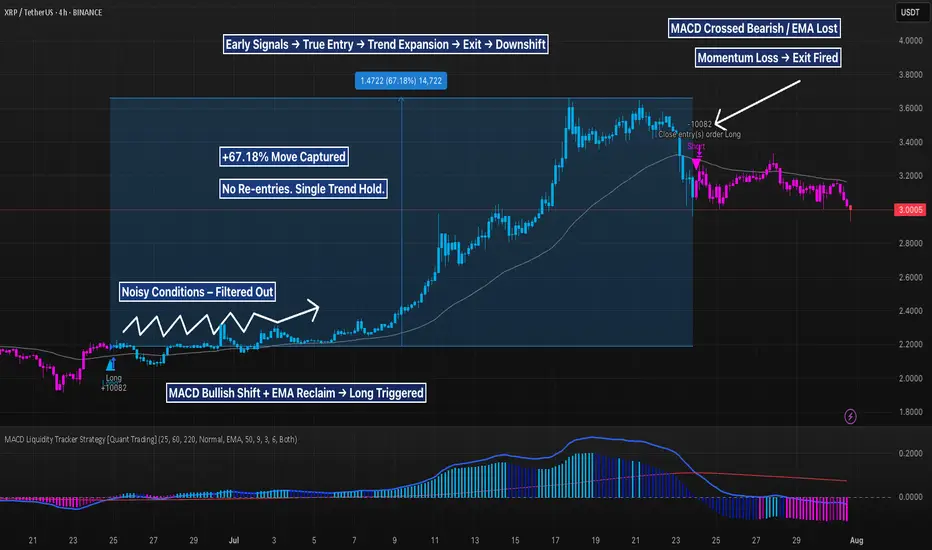
XRP 4H + 67% From MACD Trend Entry, But Is the Pullback Real?This XRP move was a masterclass in filtered momentum trading. The MACD Liquidity Tracker Strategy (Normal Mode) skipped early chop, then fired long once MACD aligned with a reclaim of the 60/220 EMAs — signaling a clean directional shift.
The strategy held through a +67.18% rally, exiting only when MACD flipped bearish and price lost EMA support. From ~$2.12 to ~$3.54, the move was captured in full with zero re-entries or second guessing.
Now price is under pressure, printing pink bars and sitting below both EMAs. The $2.90–$3.00 zone may determine if this is a healthy pullback — or the start of a reversal.
📊 MACD: 25 / 60 / 220
Trend Filter: 60/220 EMA
Mode: Normal | Timeframe: 4H
Educational chart. Drop your take.
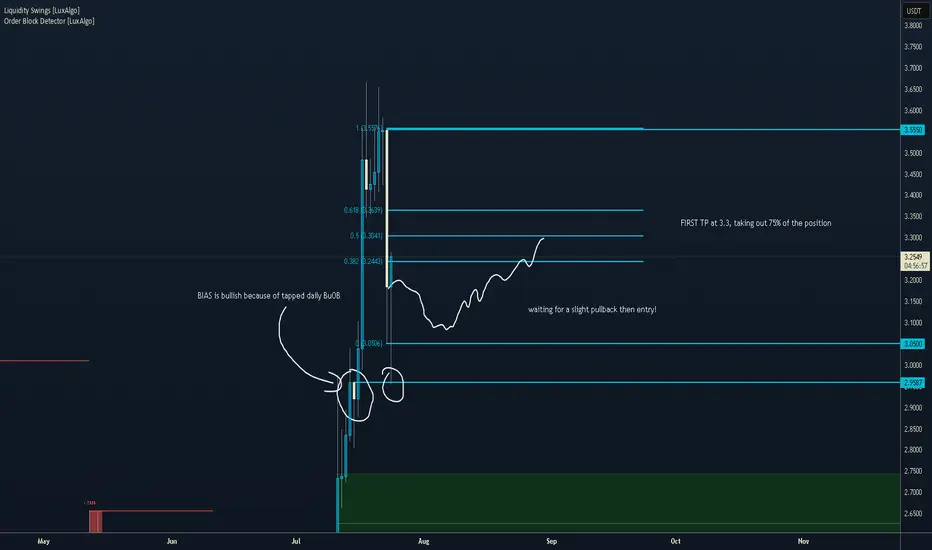
XRP-Liquidity Sweep Incoming on XRP? Bulls May Be Loading Up! XRP 2H chart is shaping up a classic liquidity sweep play:
📉 Price hunting for sell-side liquidity around $2.90
💰 Equal lows = potential magnet for stop hunts
💎 Expectation: liquidity grab → displacement → aggressive reversal toward $3.65+

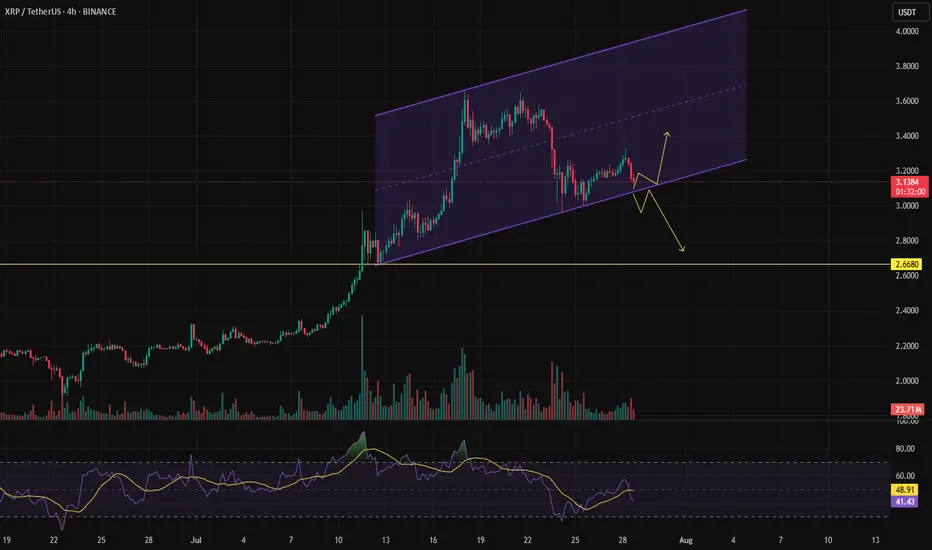
XRP 4H — Resistance Flipped to Support, Will Bulls Step In?XRP is pulling back into a key structure zone — the same area that acted as breakout resistance during the July rally is now being retested as support. With momentum resetting and price consolidating on top of this level, the next move could set the tone for the rest of August.
📊 Technical Breakdown:
Structure Retest:
Price is holding between ~$3.00–$3.15 — a major former resistance zone now acting as support after July’s vertical move. Buyers previously stepped in hard above $3.00, and this is the first proper retest since the breakout.
Stochastic RSI:
Deep in oversold territory on the 4H timeframe. Any bullish crossover from this zone would align with a bounce scenario from support.
Volume Context:
Declining volume on the pullback suggests a lack of aggressive selling — a common characteristic before continuation if the level holds.
🔍 What to Watch:
✅ Bullish Setup:
Hold and bounce from this support zone
Break above local highs at ~$3.45 could trigger fresh upside
❌ Invalidation:
Clean close below $3.00 support would shift structure short-term and suggest a deeper retracement (e.g. $2.75–2.85 zone)
XRP often moves in bursts — and this chart has the same setup vibes as the last big leg. If support holds here, don’t be surprised if it’s the ignition point for another breakout.

XRP : Long term analysisHello friends🙌
🔊Considering the great growth that the price has had and has set a new ceiling, be careful because we are at the ceiling and when we are at the price ceiling, we should always expect a price correction...
⚠Now, given the strong upward trend we have, you can buy with risk and capital management, but our suggestion is lower prices for the possibility of a correction and the possibility of a reversal pattern.
So we have identified important support levels for you and we have also identified price targets.
🔥Follow us for more signals🔥
*Trade safely with us*
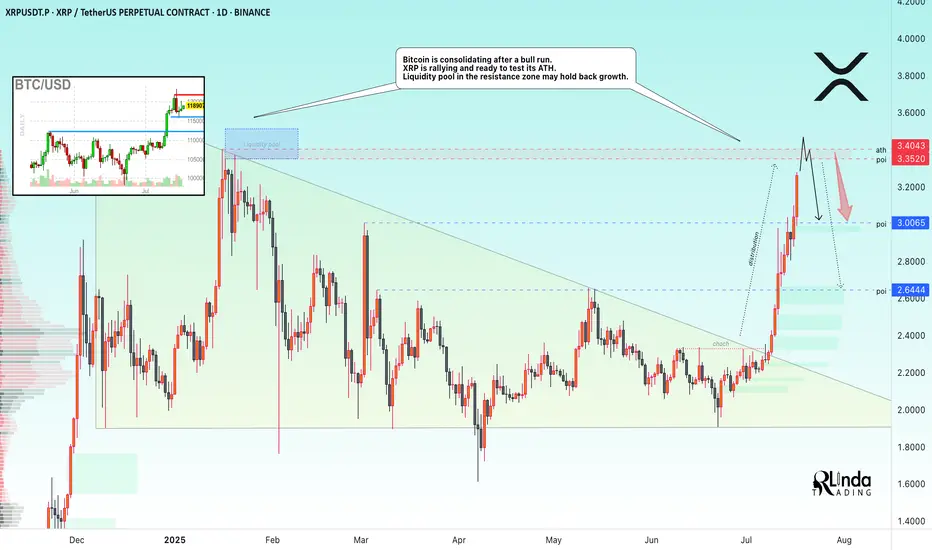
XRP → ATH retest. Reversal or continued growth?BINANCE:XRPUSDT.P is rallying and ready to test the resistance zone - ATH. Against this backdrop, Bitcoin is consolidating after a bull run. The liquidity pool may hold back growth.
Fundamentally, there is excitement across the entire cryptocurrency market. Altcoins are rallying after Bitcoin hit a new high and entered consolidation. The BTC.D index is declining, which generally provides a good opportunity for altcoins to grow. However, the index is approaching technical support, which may affect market sentiment overall...
As for XRP, there is a fairly strong liquidity pool ahead — the ATH resistance zone. The price is in a distribution phase after a change in character and a breakout of the downtrend resistance in the 2.33 zone. The momentum may exhaust its potential to break through the 3.35-3.34 zone, and growth may be halted for correction or reversal (in correlation with Bitcoin's dominance in the market).
Resistance levels: 3.35-3.40
Support levels: 3.0, 2.64
A breakout of resistance without the possibility of further growth, a return of the price below the level (i.e., inside the global flat) will confirm the fact of a false breakout of resistance, which may trigger a correction or even a reversal.
Best regards, R. Linda!
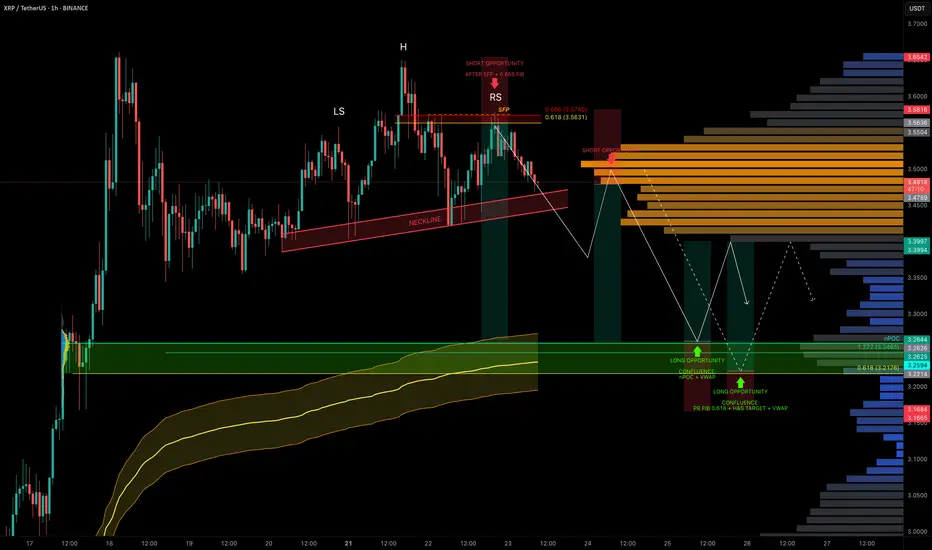
XRP Coiled in Range — Liquidity Below, Trade Setups AheadXRP has been stuck in a trading range around $3.50 for the past 5 days, offering multiple trade opportunities within the chop.
A notable short was triggered after a swing failure pattern (SFP) at the 0.666 fib retracement level near $3.563.
Now, with liquidity building to the downside, we’re watching closely for the next high-conviction setups.
🧩 Current Structure & Short Setup
🔴 Short Opportunity (Triggered):
SFP + 0.666 fib retracement at $3.563 led to rejection.
Market now shows a head & shoulders pattern forming.
Target: $3.2176 (0.618 fib retracement).
Trigger: Watch for a neckline break + retest for short confirmation.
Stop-loss: Above the right shoulder.
🟢 Long Setup:
Watching for a high-probability long around:
$3.26 → nPOC + 1.272 TBFE
$3.23 → anchored VWAP bands
This zone offers strong confluence and could act as the next launchpad.
Long Trade Plan:
Entry Zone: potential entries between $3.26–$3.22, price action needed for confirmation
Stop-loss: Below swing low at $3.1675
Target (TP): ~$3.40
✍️ Plan: Set alerts near the lows and react to price action at the zone — don’t front-run, let structure confirm.
💡 Pro Tip: Trade the Confluence, Not the Emotion
High-probability trades come from confluence, not guessing.
This setup combines nPOC, TBFE, VWAP, fib levels, and classical market structure (H&S) to map precise zones for both longs and shorts.
Let price come to you and wait for confirmation — especially in a rangebound environment where liquidity hunts are frequent.
Final Thoughts
We’re still rangebound, but liquidity is building below.
Keep an eye on the $3.26–$3.22 support zone for long entries and the H&S neckline for short breakdown confirmation.
_________________________________
💬 If you found this helpful, drop a like and comment!
Want breakdowns of other charts? Leave your requests below.
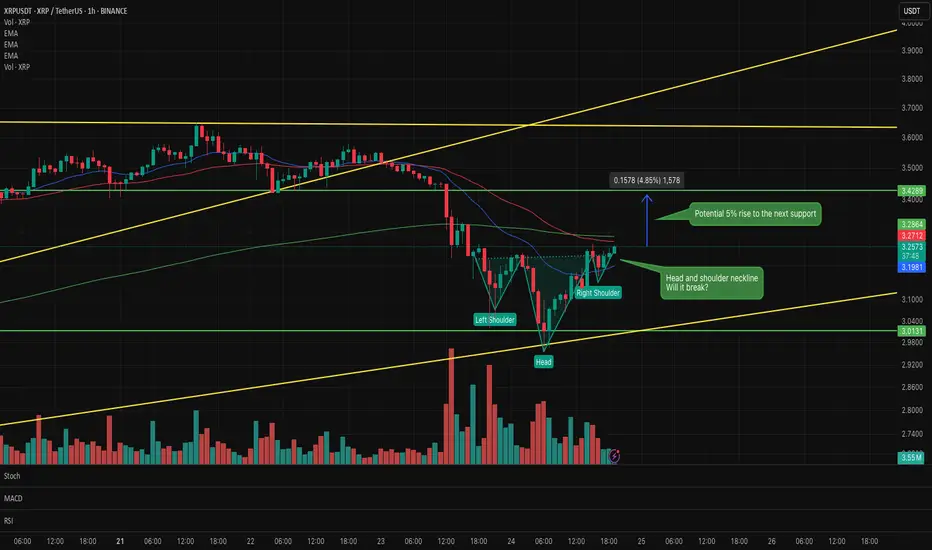
XRP 1hr Inverse head & shoulder formingXRP 1 hr chart inverse head and shoulders forming.
If it breaks the neckline it could break out for a 5% rise to the next resistance.
Watching this closely over the next few hours for confirmation.
XRP held the support line ┆ HolderStatBINANCE:XRPUSDT is holding above $0.685 support after a correction from recent highs. Price is stabilizing inside a horizontal channel, with buyers defending the bottom of the range. A clean push above $0.70 would reopen the path toward $0.75. The market is at a decision point with strong reactions at both ends of the range.
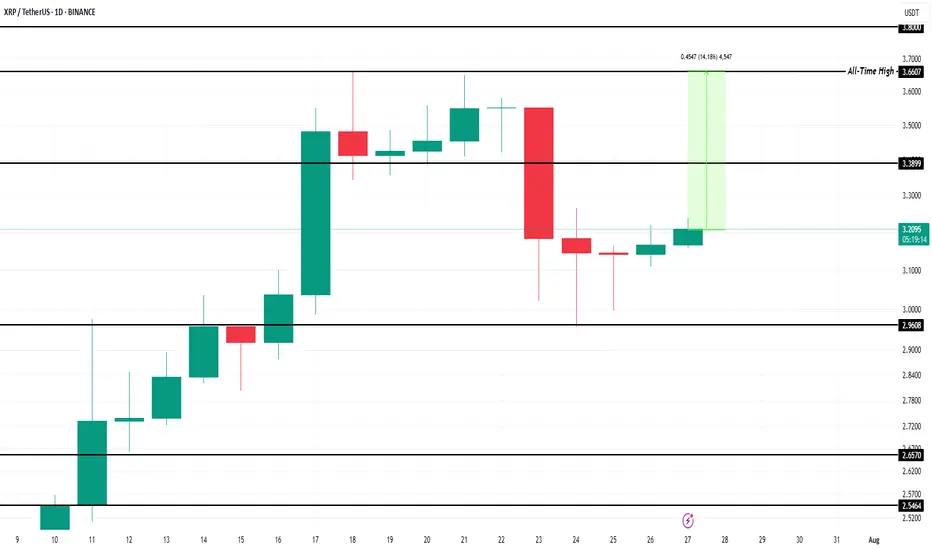
$500 Million XRP Accumulation To Drive 15% Price Rise to ATHBINANCE:XRPUSDT is currently trading at $3.20, which places it 14% away from reaching its ATH of $3.66. The support at $3.38 is crucial, and securing it could lead to further gains.
BINANCE:XRPUSDT has been seeing significant inflows in the past three days. Over 163 million XRP, worth around $519 million , have been accumulated by investors. This buying surge suggests that a wave of optimism is returning to the market, signaling that investors are positioning themselves for a potential price increase.
If BINANCE:XRPUSDT can reclaim support at $3.38 , it will be well-positioned to push past its ATH and reach new highs. This would mark a significant milestone for the altcoin, setting the stage for further price gains.
However, should the investor sentiment shift and selling pressure increase, BINANCE:XRPUSDT could face a decline. If the price falls below $3.00, it could slide to $2.96 or lower , invalidating the bullish thesis.
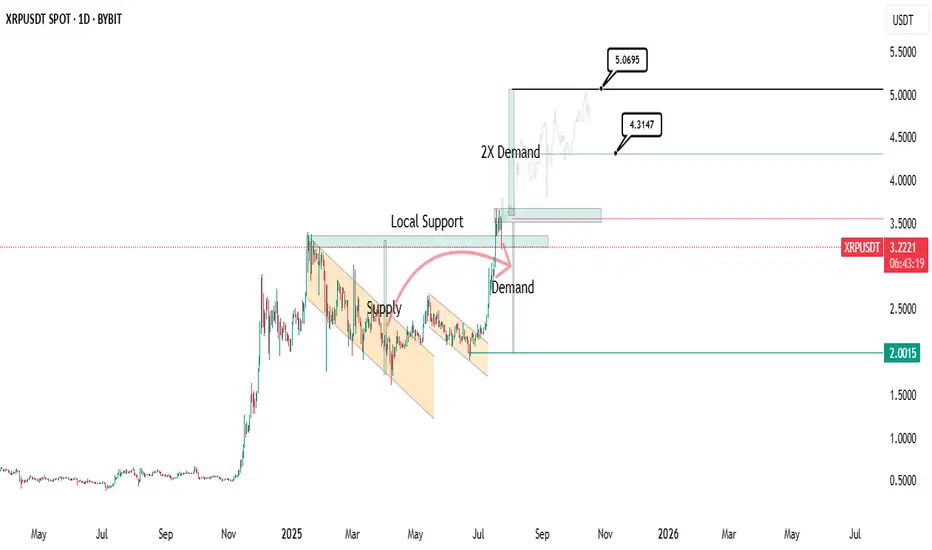
Reversal started?
it can easily 2x its demand and potentially reach $5.5 to $6 within a few weeks.
Read more at: www.cointrust.com
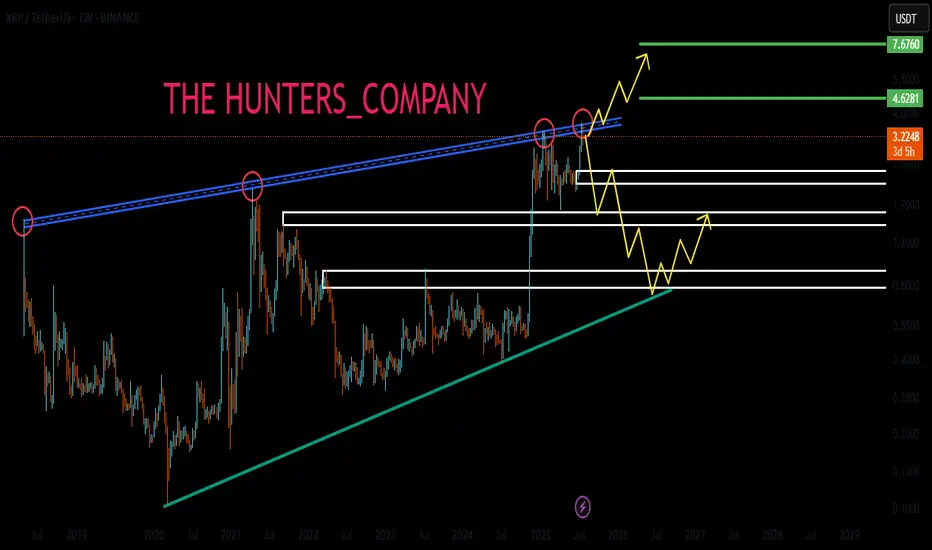
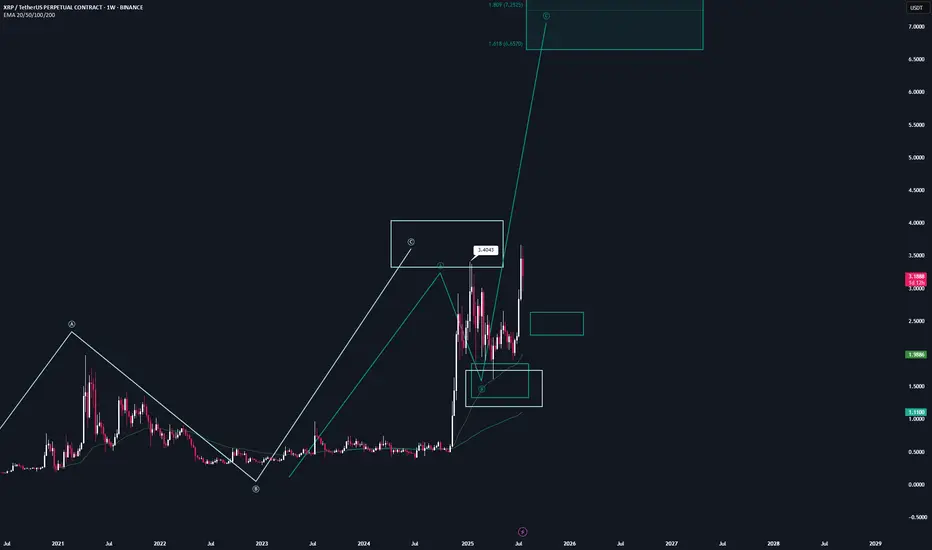
XRP | Full AnalysisHere is the full analysis for CRYPTOCAP:XRP as requested 🫡
Let’s start with the weekly timeframe:
With the recent breakout above the $3.40 high, we’ve activated a new, larger bullish sequence on the weekly chart. This sequence has its target region between $6.57 and $7.84, which I believe we will reach at minimum during this bull run.
From now on, every pullback into the B-C correction area (turquoise) can be considered a legitimate re-entry opportunity.
Daily chart:
We successfully broke the all-time high with another breakout sequence (orange), which has already completed its target region.
Now, we’re trading the overall correction level — this is the same area as the B-C correction area from the weekly timeframe. It’s the Fibonacci retracement drawn from the start of the move to point C.
Local Price Action:
After reaching the target zone (orange), we activated a new bearish sequence in the upper region, which has just completed its target zone.
Now we expect a move back into the overall correction level (blue), and after that, according to the rulebook, the next legitimate U-turn could follow.
It gets really interesting if we enter the overall correction level and then start forming a bearish structure on the lower timeframes — this is where we can apply a multi-timeframe approach, which significantly increases the probability of a successful trade.
-----
Thats the my full Analysis for CRYPTOCAP:XRP , hope it was helpful if you want me to do another analysis for any other pair just comment down below.
Also, if anyone is interested in how my trading system works, let me know and I’ll post some educational content about it.
Thanks for reading❤️
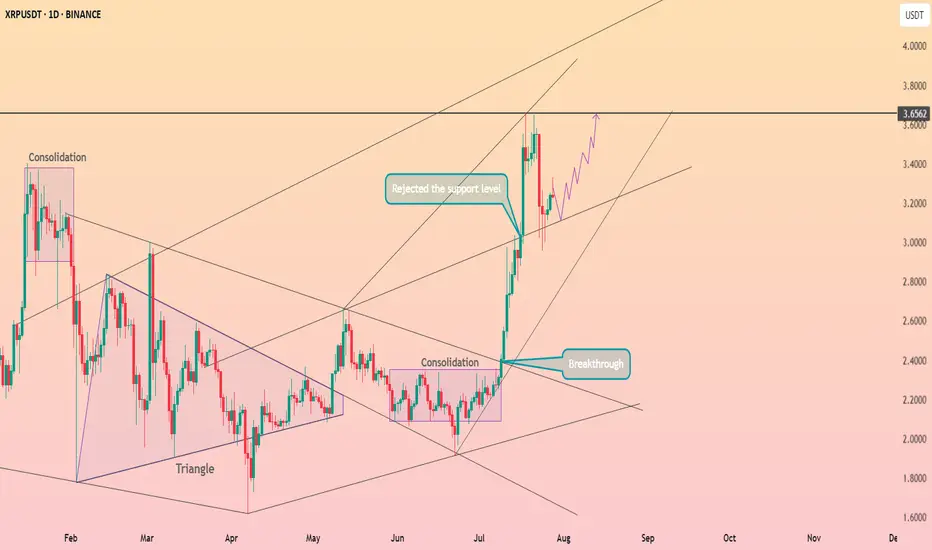
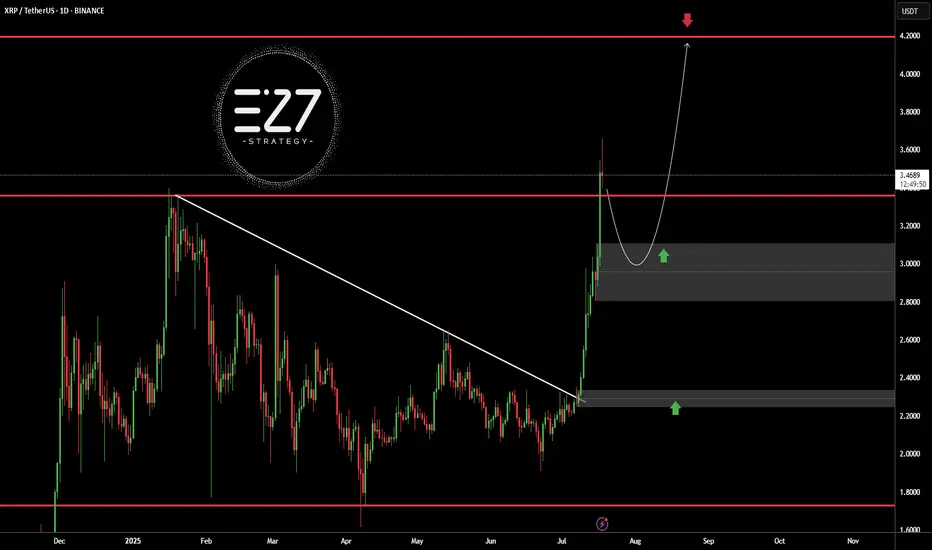
XRPUSDT - Analysis for Immediate Long Entry1. Chart Analysis
First, let's confirm the technical setup on the daily chart.
The chart shows a powerful rally in July, peaking around $3.60. The price then entered a retracement phase, pulling back as expected.
It has now dropped to the $3.15 - $3.20 zone. As we identified, this level is critical. It was the peak of the rally in early March 2025. The price is currently testing this old resistance level, and we are looking for it to act as new support. The most recent daily candle is green and appears to be bouncing right off this level. This is a textbook "support and retracement" setup, making it a prime candidate for an immediate long market entry.
2. Sentiment and Fundamental Analysis
Now, let's see if the news supports our bullish technical outlook.
"Nasdaq Firm Files $50M Plan to Integrate XRP into Core Operations" (13 hours ago) & "Nasdaq-Listed Firm Bets on XRP for Payments, Treasury in SEC Filing" (2 hours ago): This is highly significant and bullish news. A publicly-traded company integrating XRP into its core operations and treasury with a $50M plan is a massive vote of confidence. It signals real-world adoption and institutional interest, which are powerful drivers for price.
"Wellgistics Taps XRP for Payments, Collateral, and Income Plans" (22 hours ago): Another concrete example of real-world utility. A logistics company using XRP for payments and collateral reinforces the core use case for the token. This is fundamentally bullish.
"XRP Golden Cross Confirmed: Could This Be the Spark for a Major Breakout?" (24 hours ago): A "Golden Cross" (when a short-term moving average crosses above a long-term one) is a classic technical buy signal that many traders follow. While it's a lagging indicator, news articles highlighting it can create bullish sentiment and attract more buyers.
"Ripple CEO Exposes DeFi Power Move as 35M XRP Suddenly Changes Hands" (17 hours ago): This headline is slightly ambiguous but points to significant on-chain activity and strategic moves by Ripple's leadership in the DeFi space. Large token movements often precede significant price action and suggest strategic positioning, which in this context, appears bullish.
Overall Sentiment: The sentiment is overwhelmingly bullish. The news is not just hype; it's focused on concrete, fundamental developments like institutional adoption (Nasdaq firm, Wellgistics) and treasury integration. This aligns perfectly with our bullish technical setup.
Decision:
Proceed with the long trade. The technicals and fundamentals are in strong alignment.
The Trade Plan: XRPUSDT (Long)
The plan is set. We're entering a long position with a market entry now, around $3.18.
Entry Reason: Entering a long position as the price retraces to a key historical resistance level ($3.15-$3.20) that is now acting as support. The entry is confirmed by a bounce on the daily chart and overwhelmingly positive news about institutional adoption and real-world utility.
Stop Loss (SL): $2.85
Reason: This level is safely below the current support zone and below the recent swing low of the pullback. A break below $2.90 would invalidate the "resistance-turned-support" thesis. Placing the SL at $2.85 gives the trade room to fluctuate without stopping us out prematurely.
Take Profit 1 (TP1): $3.65 (Moonbag Target)
Reason: This target is just above the most recent high. A move to this level would confirm the uptrend has resumed. It's a logical place to take initial profits as there may be some sellers at the previous peak.
Action: At TP1, we take some profit and move the trailing stop to our entry price (~$3.18) to make the remainder of the trade risk-free.
Take Profit 2 (TP2): $4.20
Reason: This is a key psychological level and corresponds to a standard Fibonacci extension target (1.272 extension) projected from the previous major swing. It represents a logical next stop for the rally.
Action: When TP2 is hit, move the trailing stop up to the TP1 level ($3.65) to lock in profits.
Take Profit 3 (TP3): $4.85
Reason: This level aligns with the 1.618 Fibonacci extension, a very common target in strong trends, and is approaching the major psychological number of $5.00.
Action: When TP3 is hit, move the trailing stop up to the TP2 level ($4.20).
Take Profit 4 (TP4): $5.50 (Final Target)
Reason: This is our optimistic final target. It represents a significant psychological milestone and a potential area for a major trend peak.
Action: Close all remaining positions.
Conclusion:
The XRPUSDT long trade is a high-quality setup where both technical and fundamental factors are aligned. The risk is well-defined, and the profit targets offer a strong reward potential. The plan is now in place.

XRP ~ Is this a best trade to take?XRP ~ This beauty is best to be buys at the red nd aim for the greeens!

Sell From Supply Zone to a demand zoneUsing the S&D indicator, I'm looking to sell from the indicated Point of Interest to a previous lowm

Sell setup if the sell trigger gets activated.Due to a weak trend and a rejection from the all-time high, we’ve seen a strong rejection, suggesting that the price may drop further. If the sell trigger gets activated, it could be a good opportunity to open a sell position.
DeGRAM | XRPUSD rolls back to support📊 Technical Analysis
● After spiking to 3.56 (red dot) price slipped into a shallow bull-flag that is holding on the grey inner trend-line and the broken purple 2-year cap, converting 2.86-3.00 into firm support.
● Volatility compression inside the flag sits midway of the rising channel; a 16 h close back above 3.22 activates a 1:1 continuation toward the median-line cluster at 3.80, with the outer rail still pointing to 4.00.
💡 Fundamental Analysis
● CME’s launch of micro-XRP futures and fresh US exchange relistings lifted open-interest 18 % w/w, while Coinglass shows $12 M shorts liquidated since Monday—evidence of renewed upside pressure.
✨ Summary
Buy 3.05-3.22; breakout over 3.22 aims 3.80 → 4.00. Invalidate on a 16 h close below 2.86.
-------------------
Share your opinion in the comments and support the idea with a like. Thanks for your support!

XRPEarly Pullback Potential:
Given the overbought RSI (76.45-89.52) and recent 3% price swings, a slight pullback early in the day is plausible, especially during lower-volume pre-market hours before the New York open (8:00 AM EDT). Key support levels to watch are $3.05 (immediate support) and $2.95 (20-day EMA). A drop to $2.90-$2.95 is possible if profit-taking intensifies, as suggested by declining volume and bearish MACD signals.
Pump on New York Open : The New York market open often brings increased liquidity and institutional activity, which could trigger a price pump. XRP’s recent correlation with bullish market sentiment (Fear & Greed Index at 74, Greed) and high futures open interest ($9.25B) supports potential upside. A breakout above $3.25 could target $3.30-$3.50
XRPUSDTBINANCE:XRPUSDT broke above its long-term downtrend line and surged to the $3.5000 resistance area, but is now undergoing a correction. The current bullish structure, with a higher high and higher low, suggests the trend remains upward. A pullback toward the $3.0000 demand zone is likely and would be a healthy retracement. Holding this area could trigger a continuation toward the key resistance at $4.2000.
Key Level Price
Main Support $2.2000
Main Resistance $4.2000
Best Buy Range $2.9500 – $3.1500
Best Sell Range $4.1000 – $4.2000
Investment Risk (Buying) Medium
⚠️Please control RISK management
XRP crash or just a pullback?It's at a very critical point, and if the price can't pull itself up, we could see a drop.
XRPUSD : Key levelsIt is possible to short from the red level with arrow, other levels are inactive for now.
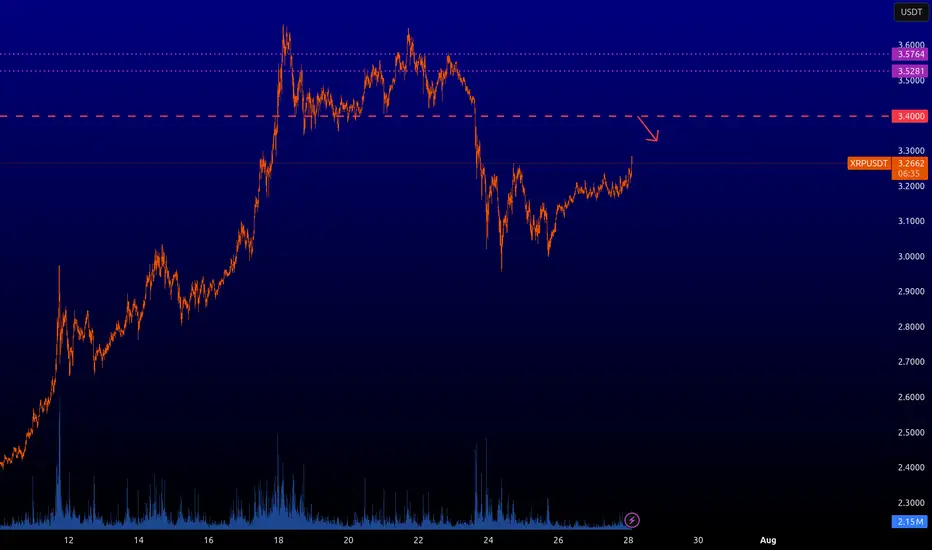
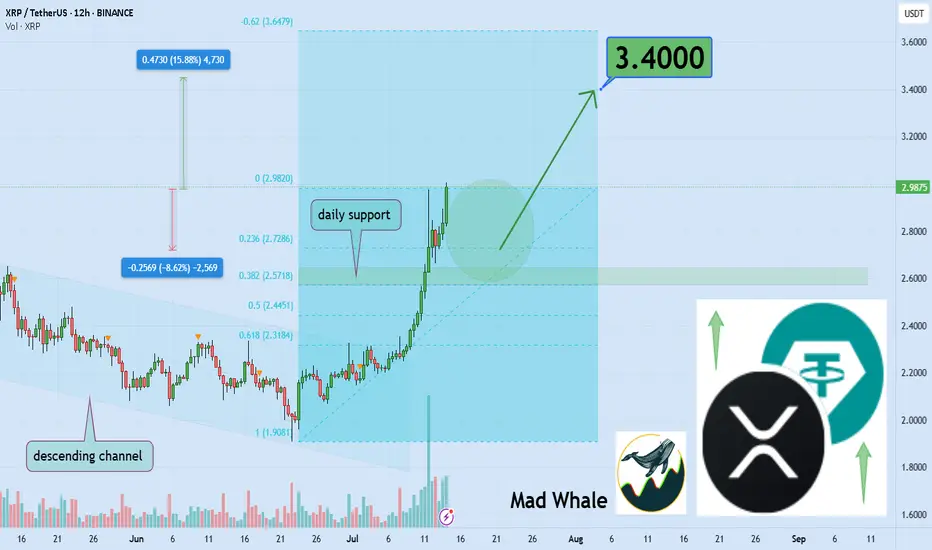
Can Ripple hit $3.40 with 15% upside soon?Hello✌
let’s dive into a full analysis of the upcoming price potential for Ripple📈.
BINANCE:XRPUSDT is poised to challenge the $3.40 level soon, supported by a notable increase in market volume 📊. This price zone also coincides with a key support area aligned with sharp Fibonacci levels, offering a strong base for potential upward movement 🔥.
✨ Need a little love!
We pour love into every post your support keeps us inspired! 💛 Don’t be shy, we’d love to hear from you on comments. Big thanks , Mad Whale 🐋