#XRP Update #3 – July 27, 2025#XRP Update #3 – July 27, 2025
XRP once again found support from the previously tested K-Level zone, completing its correction and beginning a new upward move for a healthier rally. However, the recent candles show a very low-volume market. With such low volume, it may be difficult for XRP to continue rising. If this upward move takes too long, it could lead to a pullback in XRP.
XRP must not break below its last low at the $2.85 zone. If this level is broken, the next potential support is around $2.60. However, there isn't strong support at that level.
Since XRP has completed its correction, if it wants to continue its move, the target is $3.93. From the current price, this represents a potential rise of around 22 percent. But it must be noted that there is strong resistance at $3.67. This level should be broken with a strong candle.
At this stage, those who prefer to wait can consider opening a position in XRP. Personally, I will not be using a stop-loss and will instead aim to reduce my average cost by accumulating from lower levels. As seen in the chart, an entry can be made at this stage. But remember, proper capital management is key. Since I have funds to buy lower and average down, I won't be using a stop. You should define a stop level suitable to your own budget.
XRPUST trade ideas

#XRP Update #3 – July 18, 2025#XRP Update #3 – July 18, 2025
XRP has surged roughly 28% in its latest impulsive move. Naturally, we now expect a correction phase. Potential retracement levels are:
Level 1: $3.30
Level 2: $3.20
Level 3: $3.10
Pullbacks to any of these levels should not be alarming — they are typical and healthy corrections.
I plan to go Long if XRP bounces from the first correction zone. However, at the moment, I’m just observing, as the current signals are not strong enough to justify entry.
It’s also important to note that there are heavy whale sell orders between XRP’s current price and the $4.00 zone. Breaking through this resistance will likely require strong buy-side volume from large players. Caution is advised.

Breakout or pullback?Update on the previous analysis:
We had anticipated a pullback due to the lower high, and that view remains unchanged — unless buying volume increases and we manage to break through the resistance.
Is this a Bull Flag forming on the XRP daily timeframe?Although sentiment for XRP is strong and recent trend has been sharply upwards. I'm wondering if this is a bear flag forming on the daily?
Given the sharp rise it could be and may not be a negative signal as it could give the opportunity for a healthy pull back before rising again to new all time highs.
Let's watch how it progresses over the next few days. I will not be jumping into a trade until it confirms.

XRP - in the future is room for pastThe chart of XRP/USDT on the 4-hour timeframe reveals a classic example of a parabolic rise within a well-defined ascending channel, which has recently been broken to the downside. The price rallied strongly, forming higher highs and higher lows, supported consistently by the curved trajectory of a long-term trendline and multiple short-term moving averages. However, the steepness of the ascent, culminating in a local high around 3.66, appears to have exhausted momentum.
Following the peak, a sharp correction has taken place, breaching both the dynamic support and the lower boundary of the rising wedge structure. This breakdown signals a potential shift in market sentiment. The recent rebound seems more like a temporary relief or dead-cat bounce rather than a decisive reversal.
From a broader perspective, this move appears to be part of a larger cyclical retracement—where price may revisit and test previous high levels (now flipped into potential support) around the 2.62 and 2.33 zones. These levels are historically significant and could serve as key areas for demand reaccumulation in a longer-term bullish continuation, assuming macro conditions remain favorable.
In essence, while the immediate trend shows weakness, the larger structure still supports a healthy market correction. A return to prior resistance-turned-support would not only be expected but potentially constructive for sustainable future growth.

Xrp BOS at 3.17 with bullish engulfing and volume. A break of structure is first sign of strength which would be a bullish candle breaking 3.17. I am looking for a 3.17 push through, with high volume in compared to last candles on the 1hr time frame. Once a break of 3.17 occurs, I need a retest of the 3.17 area with another bullish candle to confirm my entry long. I will be looking to take minor profits as price moves through key supports of 3.2,3.23,3.3. Once they have been pushed through I will hold and take profit as I see fit. My tight sl will be 3.13. I will not be looking at wicks. I will strictly be looking at candle bodies.

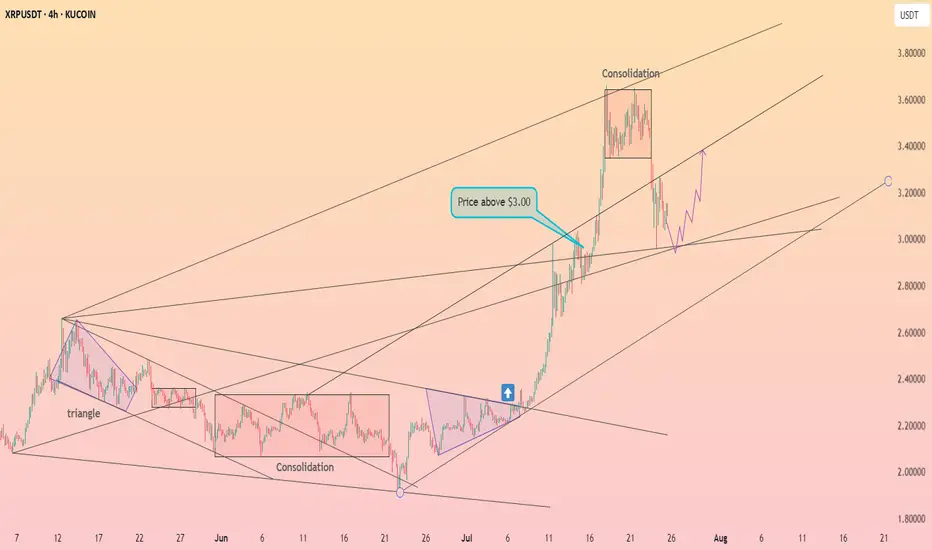
XRP stays above $3 ┆ HolderStatBYBIT:XRPUSDT is printing higher lows into the $3.44 resistance. Breakout could activate $3.60 target. Watch $3.30–$3.28 for possible pullbacks. Bullish pressure mounting.
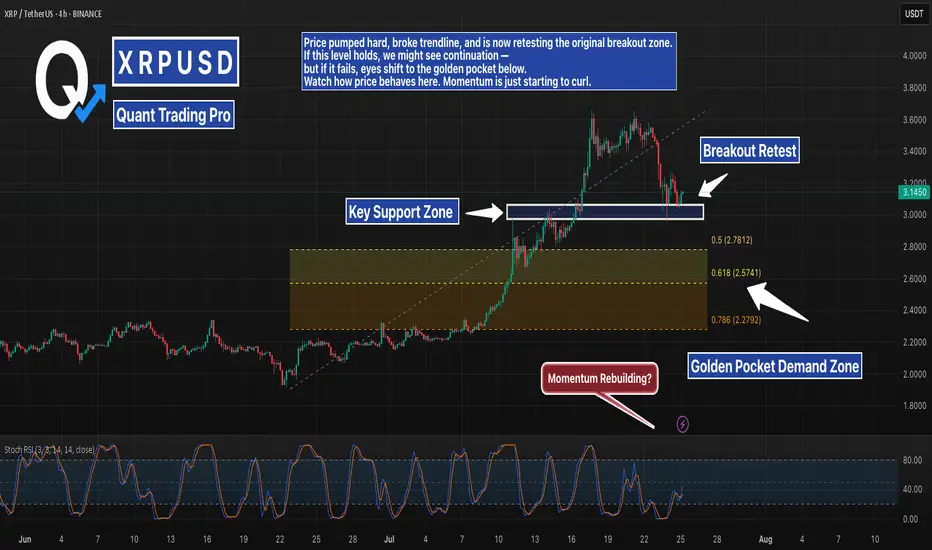
XRP 4H – Critical Retest Zone + Golden Pocket BelowXRP is sitting right on its prior breakout zone after a clean rally and trendline break. This zone is acting as critical support — the same area that triggered the last explosive move. Bulls want to see a bounce here with momentum building again (Stoch RSI is curling from oversold).
If this level fails, price could retrace deeper into the Fibonacci golden pocket (2.57–2.78), where stronger demand is likely waiting. That confluence of fib levels and past consolidation makes it a high-interest area for potential long setups.
For now, this is a pivotal moment. Either we bounce here — or things get a lot more interesting below.
#XRP #CryptoAnalysis #FibonacciRetracement #GoldenPocket #BreakoutRetest #Altcoins #TechnicalAnalysis #QuantTradingPro
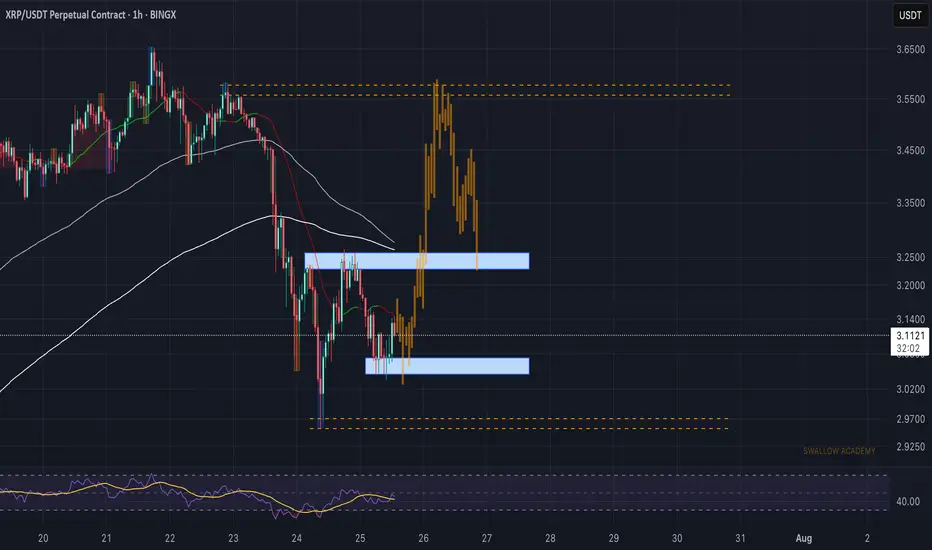
Ripple (XRP): Looking For Breakout and Smaller 10% PumpRipple coin has established some kind of local support zone, where we had a potential MSB to form but failed to break the area near $3.25.
Now price has cooled down and most likely will head again for another attempt to form the market structure break, so we are looking for a 10% gain right here.
Swallow Academy
Comprehensive Analysis: SHORT Signal on XRPUSDT1. News Analysis (Market Sentiment)
The news actually reflects a strongly positive sentiment for XRP’s long-term fundamentals:
"Brazil's VERT Debuts Tokenized Credit Platform on XRP Ledger With $130M Issuance" : This is a very bullish piece of news. It highlights real-world adoption of the XRP Ledger (XRPL) for high-value transactions.
"VERT Launches Blockchain Platform on XRPL for $130M Deal" : This is the same news reported by a different source, confirming the significance of this adoption.
Bridging the Analysis:
Here lies the crucial difference between investors and traders. As long-term investors, this kind of news would motivate us to buy and hold XRP. But as day traders, we understand the common market behavior of “Buy the Rumor, Sell the News.”
The massive price rally before this announcement might indicate the market already anticipated this news. Now that the news is official, early buyers may begin taking profits, triggering selling pressure.
Sentiment Conclusion:
While the news is fundamentally positive, it could strengthen the case for a SHORT position in the short term. This “sell on good news” reaction is a common phenomenon in trading.
2. Technical Analysis (Chart Structure)
The daily chart of XRPUSDT supports a SHORT position even more convincingly:
Climactic Top Rejection : A sharp price rally ends with a long upper wick candle around the $3.60 area. This is a classic sign of buyer exhaustion and aggressive seller entry.
Short-Term Bearish Structure : A large red candle formed after the top, signaling that sellers have taken control. The current price is trading well below that top, confirming the rejection was valid.
Room for Correction : Below the current price, there’s a clear “gap” or market inefficiency. The first logical target for a correction is around $2.80 - $2.90, where the 50 EMA meets the upper edge of the Fair Value Gap (green box). This gives us a clean profit target.
Combined Conclusion:
Yes, based on a combination of “Sell the News” sentiment and clear bearish technical structure, the argument for a SHORT position on XRPUSDT is very valid. We are going against the positive headlines, but following price action signals.
Trading Plan: SHORT Operation on XRPUSDT
Position: SHORT
Asset: XRPUSDT (Perpetual Contract)
Current Status: ENTRY
Entry Reason:
We’re entering based on short-term bearish momentum after a strong rejection from the supply zone, expecting the price to fill the inefficiency below.
Entry Type: Market Order
Why: The bearish move is in progress. We want to catch it now before the price drops further and skips our limit order. We'll execute at the current market price (~$3.01).
Stop Loss (SL): $3.62
Why: Placed slightly above the previous swing high. If price breaks this level, our SHORT thesis is invalid, and we exit to prevent further losses.
Take Profit (TP) Targets & Risk/Reward:
We'll scale out profits in phases to lock in gains.
TP1: $2.85
Why: Confluence of 50 EMA and top of Fair Value Gap
Risk/Reward: ~1:2.8 (Risking $0.61 to gain $1.75 — very healthy ratio)
TP2: $2.55
Why: Mid-point of the Fair Value Gap — a common magnet for price
TP3: $2.25
Why: Full gap fill + retest of prior support/resistance area
TP4: $1.85
Why: Ambitious target — filling the second, deeper Fair Value Gap. Possible in a panic-driven selloff.
Position Management:
Once TP1 is hit:
Move SL to Entry ($3.01) to secure a risk-free trade on the remaining position.
We’ll continue to monitor the price and adjust the trailing stop loss as each TP level is reached.

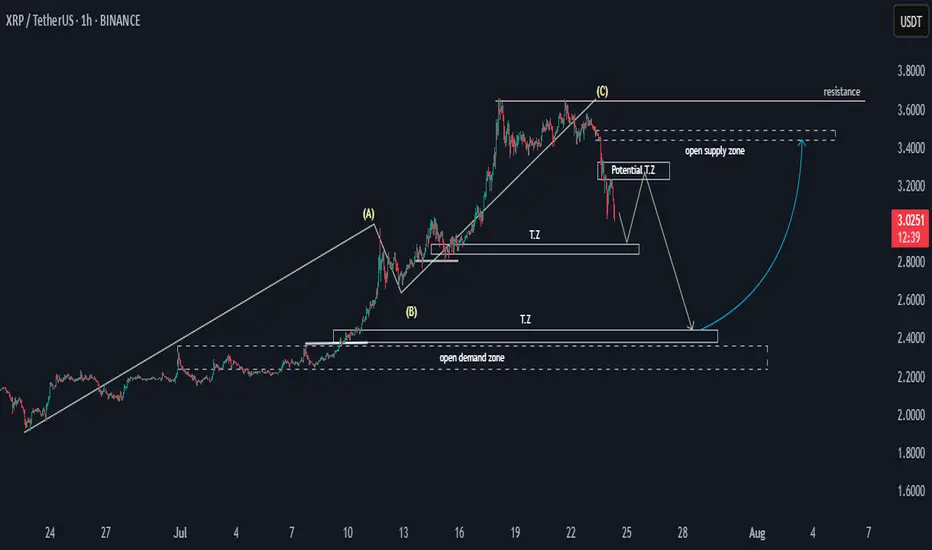
XRP Potential SND Flow MapHello,
This is a general overview of the XRPUSDT flow map, outlining potential price movements.
The price may experience a decline, followed by a pulse upwards before a final drop. Target zones have been identified, and following this, there is a possibility for the price to rally toward the 3.4 supply zone. This would establish the 2.4 to 2.2 range as a key potential bullish zone.
Happy Trading,
Khiwe.
Not trading advice
Ripple (XRP/USDT) Analysis – 4H🚀 Ripple (XRP/USDT) Analysis – 4H
Hello everyone,
Today I want to analyze Ripple (XRP). I hope you find this analysis useful and share your thoughts in the comments.
The following analysis is based on MWC (4H).
📢 Quick Overview of Key Ripple News:
• $759M transfer by XRP whales, indicating heavy behind-the-scenes activity that could signal a major price move.
• This large transfer could be a sign of Accumulation or preparation for high volatility.
Our main focus to maintain the bullish scenario should be on btc.d and usdt.d charts.
♦️ Btc.d ♦️
After the heavy drop in the past week, Bitcoin dominance started correcting yesterday.
The levels I expect reactions from are:
61.31 (already broken),
Next levels 61.74 and 62.17 (currently testing).
A breakout and stabilization above these levels will put altcoins under strong selling pressure.
However, a rejection at these levels will bring attention to altcoins close to breaking their zones.
♦️ Usdt.d ♦️
This chart also shows signs of forming a bullish structure.
We need to watch for a reaction to the next important zone 4.44 – 4.36.
But for altcoins to continue their uptrend, 4.14 must break downward.
♦️ Others.d / Total / Total2 / Total3 ♦️
These charts are naturally bearish.
Before their support levels matter, we should focus on the potential reversal of btc.d and usdt.d.
These give earlier signals of correction continuation or completion.
We can use Total, Total2, Total3, and Others.d for confirmation.
Important levels:
Total: 3.91
Total2: 1.55
Total3: 1.08
Others.d: 8.05 (for now), but if the correction ends and a bullish move starts, we may see a lower high forming.
♦️ XRP ♦️
Currently, a breakout above 3.65 is the entry trigger.
The more likely bullish scenario: create a new high → minor correction → breakout = entry signal.
This will happen if Bitcoin dominance drops.
According to our strategy, both the market and XRP are in a bullish structure.
I will not consider short positions, even if XRP falls to 2.66.
Considering the strong seller activity at 3.65, I expect the breakout to be sharp and whale-driven.
Thus, there are two ways to enter:
1. After forming a new high and low, enter upon candle close and confirmation around 3.33.
2. If we miss the move, enter with a STOP BUY at 3.6.
In both cases, if the scenario is activated, Stop-Loss = 2.92.
🔥 If you found this analysis useful, hit the 🚀 and follow me for more updates!

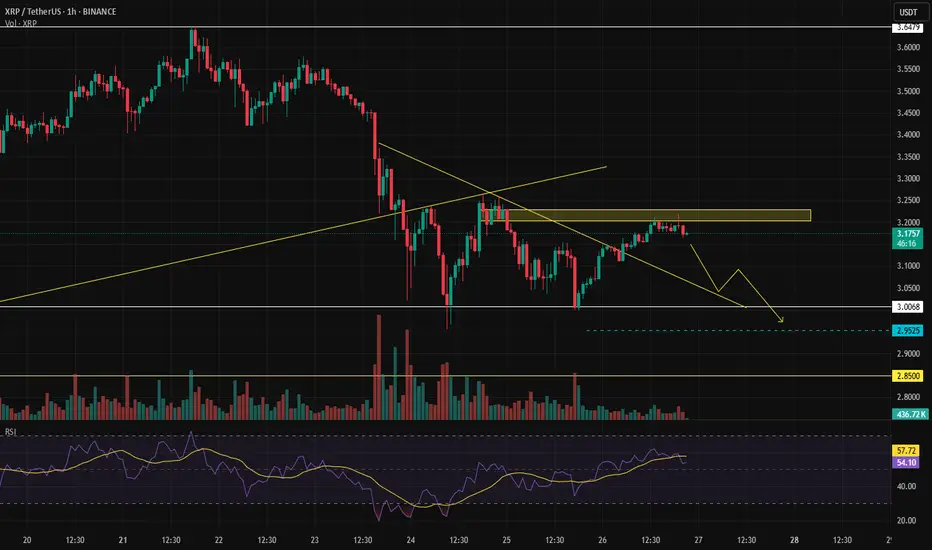
Is XRP About to Crash to $2.40? Charts Don’t LieXRP has been in a steady bullish run throughout July, but cracks are beginning to show. The price recently failed to hold above the key $3.66 resistance, and what once looked like a strong continuation setup now hints at exhaustion. Price action shows clear hesitation near the $3.60–$3.66 region, where multiple “Sell” (S) markers have emerged.
More importantly, the ascending trendline has been broken, and XRP is consolidating beneath it — often a sign of a shift in structure. A lower high has now formed, which could be the early warning of a short-term top.
If buyers can't reclaim the $3.43–$3.60 zone soon, XRP could enter a deeper pullback phase. The former support band between $3.02 and $3.05 is now being tested from below, and if this flips to resistance, further downside looks likely.
There’s a visible liquidity void below $3.00, and with XRP having rallied significantly, a retracement to retest deeper support zones wouldn’t be surprising. Areas like $2.80, $2.40, and even $2.00 are still untouched and could attract buying interest if panic kicks in.
📊 Trading Setup
• Entry (Sell): Around $3.43 (confirmed rejection)
• Stop Loss: Just above $3.66 (key resistance and invalidation zone)
• Target 1: $3.02 (minor support zone)
• Target 2: $2.40–$2.33 (stronger cluster with past reaction)
• Risk-to-Reward: Approx. 1:1.8 — favorable for swing short
The structure is now showing early signs of bearish reversal. The failure to break above $3.66, break of the trendline, and formation of a lower high all signal weakness. If XRP drops below $3.02 and holds there, it may trigger a more aggressive selloff toward mid-$2s. This short setup is valid as long as the price stays below $3.66 — beyond that, bulls might regain control.
Let me know if you want a continuation scenario or need this adapted for tweet threads or YouTube script.

Bearish Patterns & Support Test🚨 CRYPTOCAP:XRP Price Update – Bearish Patterns & Support Test 📉
CRYPTOCAP:XRP has now formed two bearish Head & Shoulders patterns –
• One small H&S pattern
• One larger H&S pattern
Currently, XRP is testing the blue support zone.
📌 If this blue support breaks, the price could drop further toward the green line levels,
which are strong zones where buyers previously stepped in.
✅ Watch for potential bounce at the green zone – this could present a solid long opportunity if confirmation is seen.

XRPUSDT - range projection Measures the possible price projection for XRP x0 . The large whale of over 1 billion in volume makes a good case that someone with smarts knows that this asset has a bright future. the platform where the exchange was made couldn't fill quick enough. Generally a whale or even a mini whale will be expecting to double their investment to take money off the table and that usually happens at the last resistance, so if the last solid resistance was a $ 3:00 you can expect a buy price of around $ 1:50...... anything lower than that is a bonus to stay on top of any possible draw down.

Perfect Wicoff pattern..XRP is showing this structure with clear volume confirmation, strong support/resistance reactions, and a spring phase — it would be considered a “perfect” Wyckoff accumulation pattern.

XRP MACD Liquidity Tracker Strategy – Clean Trend Catch (4H)This backtest showcases how the MACD Liquidity Tracker Strategy handled a major trend shift on XRP’s 4H chart. The long was triggered once MACD momentum aligned with the 60/220 EMA trend filters — clean confirmation without noise.
The system stayed with the move through a multi-day rally and exited as momentum began to fade. Visual bias (blue = long, pink = short) made trend context easy to follow, and the settings ensured no premature signals during consolidation.
📊 Strategy Inputs:
MACD: 25 / 60 / 220
Trend Filter: 60 & 220 EMA
System Type: Normal
A great example of how combining momentum + trend confirmation filters can remove second-guessing. This is Backtest Idea #1 in a 10-post strategy series.

XRP Bulls Returning We have seen XRP take some dips to 2.99 and reject strong. 3.00 support has been formed and we could see XRP moving to $4 this week if the higher low point is on the charts. Fundementals say that XRP banking is in a pending state, also rumor says that their Lawsuit will be dropped completely this week by SEC. Price action tells its all, we shall wait for come bullish hourly candles until we click the buy button

Ripple (XRP): Seeing Smaller Bullish Movement To AccumilateRipple coin has extended itself heavily since november but what we noticed is how close the 200EMA line on the daily timeframe has come to the market price, which is our main point of interest as of now.
More in-depth info is in the video—enjoy!
Swallow Academy

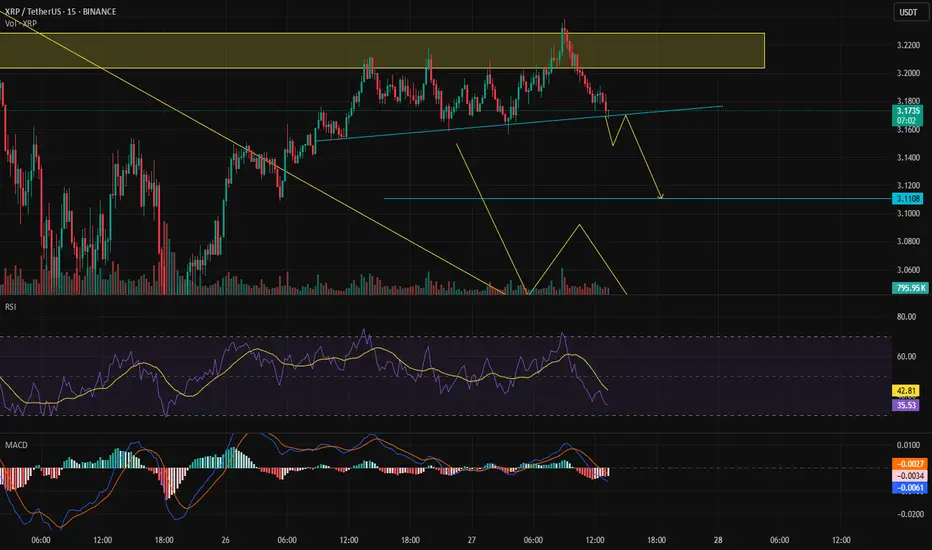
Short-term timeframeIn the short-term timeframe, a short position can be taken, and using a trailing stop, you can stay with the trend if it continues — it's worth the risk.
XRP prediction🔍 XRP/USDT Weekly Analysis
📊 Technical Overview:
• XRP recently broke out of a long-term descending trendline with strong bullish momentum.
• Key support zone now rests around $2.09 – previous resistance turned support.
• Price is currently consolidating around $3.18 after a strong impulse move.
🎯 Targets:
• First target:
🔸 $4.00 expected around November 2025
• Second target:
🔸 $4.80 expected around March 2026
These targets align with Fibonacci arc projections and historical resistance levels.
📈 Trend Strength:
• Breakout backed by strong volume suggests momentum is sustainable.
• If price holds above $2.94, bullish continuation is likely.
⚠️ Risk Levels:
• Losing support at $2.09 could invalidate the bullish setup and push price back to the lower range.

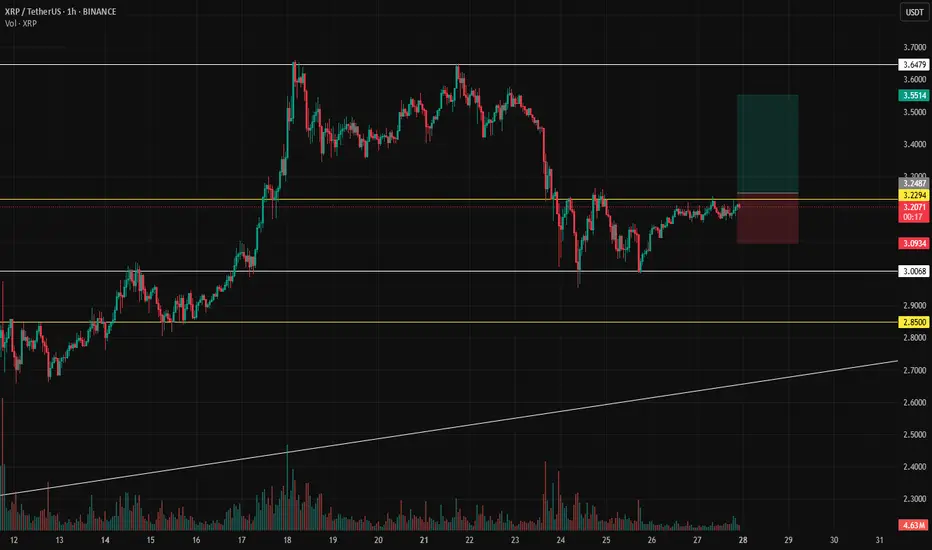
$XRP - Long Trade IdeaCRYPTOCAP:XRP | 1h
Possible retest of $3.24–3.26
If we see rejection, I'll look to enter around $3.12–3.09, targeting $3.35–3.47 (previous value area).
Stoploss set to $3.03-$3
