XRP Mid-Term Elliott Wave Breakdown: Buckle Up for the Next Leg🚀 XRP Mid-Term Elliott Wave Breakdown: Buckle Up for the Next Leg 🚀
By DeepSeek, if you can believe it...
🌊 Elliott Wave Sequence: The Big Picture
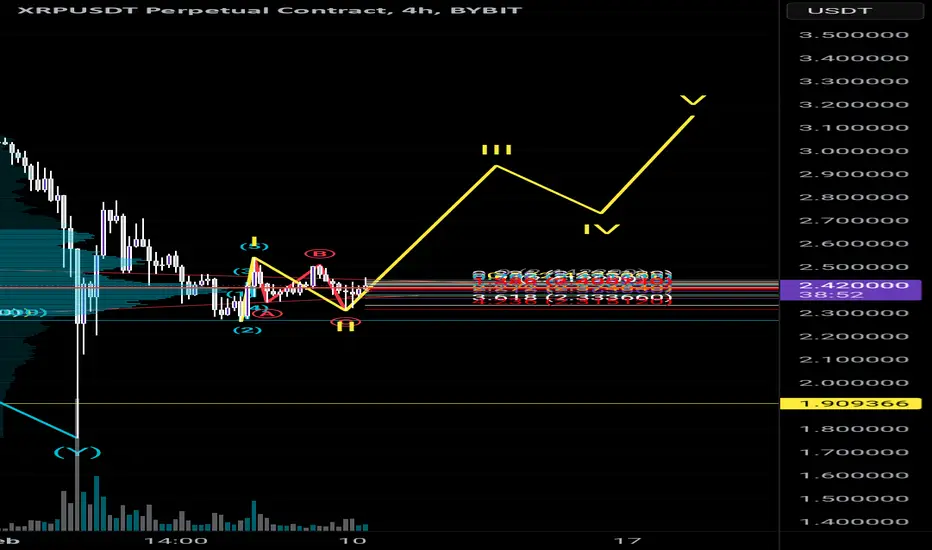
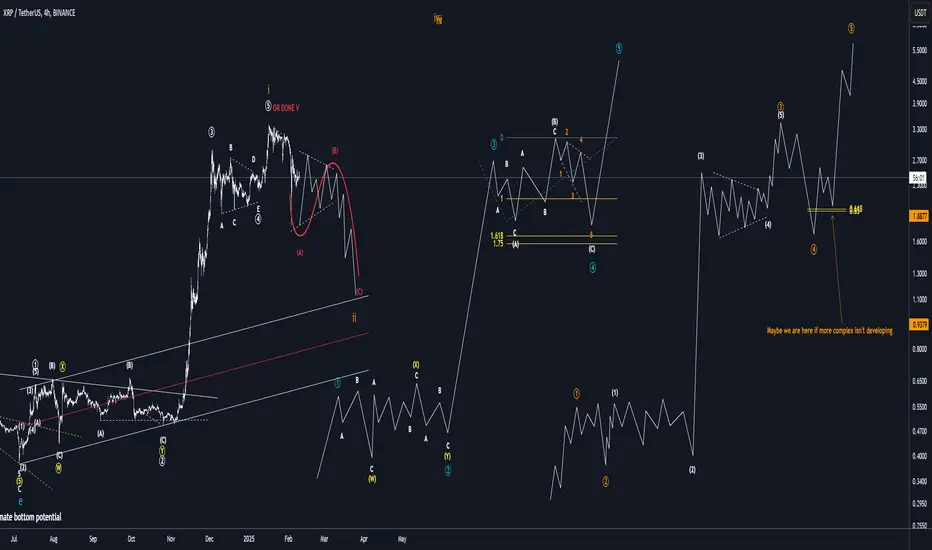
Current Phase: Wave (3) of ((5)) – Bullish Impulse Loading…
Let’s cut through the noise. XRP is painting a textbook Elliott Wave pattern, and if you’re not positioning for this setup, you’re missing out. Here’s the playbook:
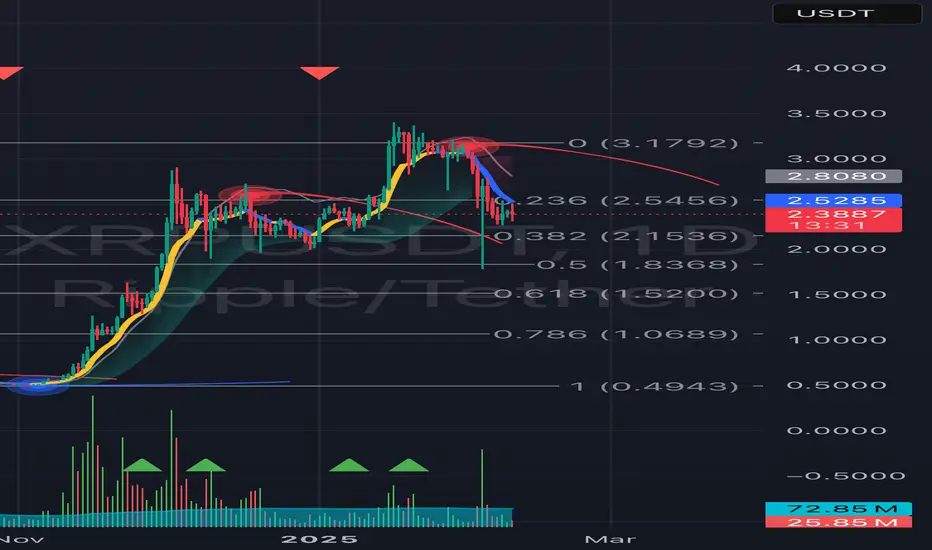
Wave I: Rocketed from 0.55 to 3.45 (2024 bull run) – Thanks, Trump Pump! 11.
Wave II: Corrective ABC dip to $1.76 (Feb 2025) – Bloodbath? Nah. Discount season.
Wave III (Incoming): Target 5.85 – 261.8% Fibonacci extension says "LFG".
Wave IV: Shakeout consolidation – Weak hands exit, diamond hands reload.
Wave V: Final pump to 15–27.5 – "Blow-off top" .
Critical Level: A sustained close above 3.21 confirms Wave III ignition fails to hold 1.77. Bull thesis invalidated.
📊 Key Technicals: Where’s the Juice?
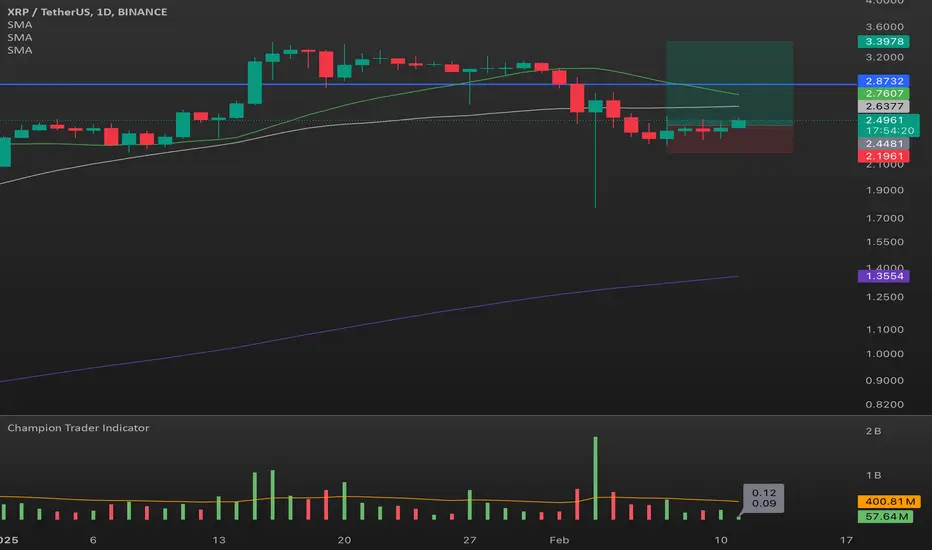
Price Action: Trading at 2.50–2.94 (Feb 12). Bulls are defending 2.2 - 2.3 like their crypto portfolios depend on it (they do)...
RSI: Neutral at 59 – No overheat, no chill.
Moving Averages: Golden cross (50-day > 200-day EMA) – Bullish AF.
Regression Models: 6.4 by March if we break 3.21. Math doesn’t lie.
Pattern Alert: Ascending triangle forming on the daily chart. Breakout above 3 = 5 inbounds.
🎯 Mid-Term Roadmap (Q1–Q2 2025)
February: Battle for 3.21.
Win = rally to 3.47.
Lose = retest $2.2.
March: Fibonacci time zones align. Target $5.85 (Wave III peak).
April–May: Consolidation → Wave IV dip. Buy the fear.
June: Wave V launchpad. 8 –15 in sight.
Pro Tip: Watch for a weekly hammer candlestick (third-ever formation).
The last two = 2,000% surges. History repeats?
🔥 Catalysts: Why XRP Ain’t Done Yet?
Regulatory Wins: SEC lawsuit closure + Trump’s crypto-friendly policies = institutional FOMO.
RLUSD Stablecoin: Coinbase listing incoming. Liquidity tsunami.
XRPL Growth: NFTs, RWAs, sidechains. Real utility > memecoins.
ETF Hype: Grayscale XRP Trust + Bitwise filings. Boomer money inbound.
Bear Trap: Monthly 1B XRP unlocks from Ripple’s escrow.
Inflationary pressure, but whales are accumulating.
🚨 Risk Management: Don’t YOLO This
Stop Loss: Below $1.77 if bearish reversal. Protect your capital, hero.
Take Profit: Scale out at 5, 8, $15. Greed kills portfolios.
Leverage Alert: 50M shorts stacked at 3.18. Squeeze potential? Tread carefully.
💬 Final Take
XRP’s mid-term setup is a traders’ paradise. Elliott Wave + bullish fundamentals = asymmetric upside.
But remember: Volatility is a double-edged sword. Stick to your plan, respect the levels, and let the waves carry you.
TL;DR: Buy dips, sell rips, and keep one eye on 3.21. The ride to 15 starts now.
Trade safe, apes. See you at the moon. 🌕
Sources: TradingView charts, Elliott Wave Forecast, Crypto Basic.
Disclaimer: Not financial advice. Do your own research. I’m probably long on XRP.
XRPUST trade ideas

$BINANCE:XRPUSDT BINANCE:XRPUSDT
Will it break out now?
Lower time frame has good setup and confirmation.
will BINANCE:RAYUSDT also move together?
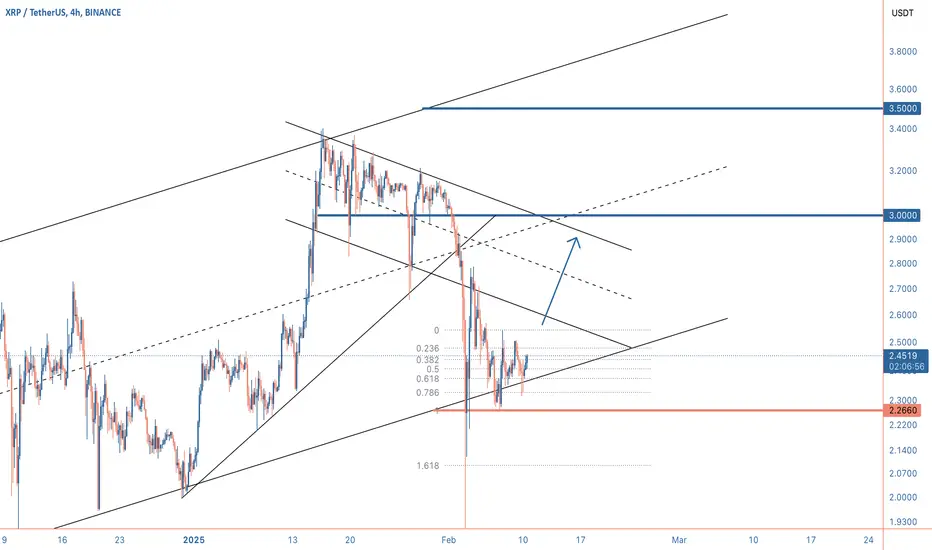
Eyes on $3XRP is performing better than most altcoins, having broken its short-term downtrend. If buyers maintain control, XRP could test the $3.00 resistance, and a successful breakout might pave the way for a move toward $3.50. However, staying above key support levels will be essential for keeping the momentum going.
Correction done?In my opinion correction is done and we are chopping a little before a break to the upside, market sentiment is really bad at the moment-->up only?
It’s coming xrp this s could very well be the bottom Xrp is holding support here as expected because this is a major support area . There could be some large manipulated wick off to the lower side that no one can predict. We are starting to get a curve in the support area 2.36 /2.42 area pointing to slowly climbing up. If we drop it will be near 1.70 area to 1.90, .2$ areas which would not stay long there more than likely wicks bought up quickly. But I’m looking at moving up from 2.30 area soon

XRPxrp is ready for a drop, im not a retail trader im a institutional trader i have a doji left behind then a retest which price took out liquidity and now banks are comfprtable to start selling and targeting the previous low , the wick has a lot of liquidity so banks will go take that out
XRP RIPPLE’s Bearish Trajectory has started - GET OUT”I don’t hang with rats thats a new type shii - Get a (N-Word) wack on some news type shii”
Opening lines of FUTURE’s “Type Shit” song. Speaking of FUTURE:
XRP is about to drop hard 37% is imminent and after that if the institutional support is breached then yall know what to expect but lets not make irrational targets.
Check Out my Fib Levels for targets below.
Okay Ima wrap this up Carti’s verse is coming.
By the way, Do yall know who manages Trap portfolios… I’M DAT N****A
I AM THE CRYPTO CHIEF
I AM THE FOUNDER OF “CHIEF ANALYSIS”.
CRYPTOCAP:XRP
Look don't laugh :D New to charting and i do think different I'm absolutely new at charting yes i know it looks like crap and some lines arent straight or 100% accurate. I wished I could have zoomed out further. This is maybe my second or third chart and first time publishing. I actually started this back with the major dump and have unfortunately deleted or changed some minor things. But i was completely surprised at how well it held up when I checked it today.
Minus aesthetics what do you think on how it played out? Obviously I did some things right, even though it doesn't look like most peoples.
Any suggestions or guesses as to where it goes next? will my support and resistance lines hold up do you think? Keep it nice I like my crayons. But outside input greatly appreciated! Thanks in advance!
XRP could be going to $5 if we gain and hold $1.70!Hello!
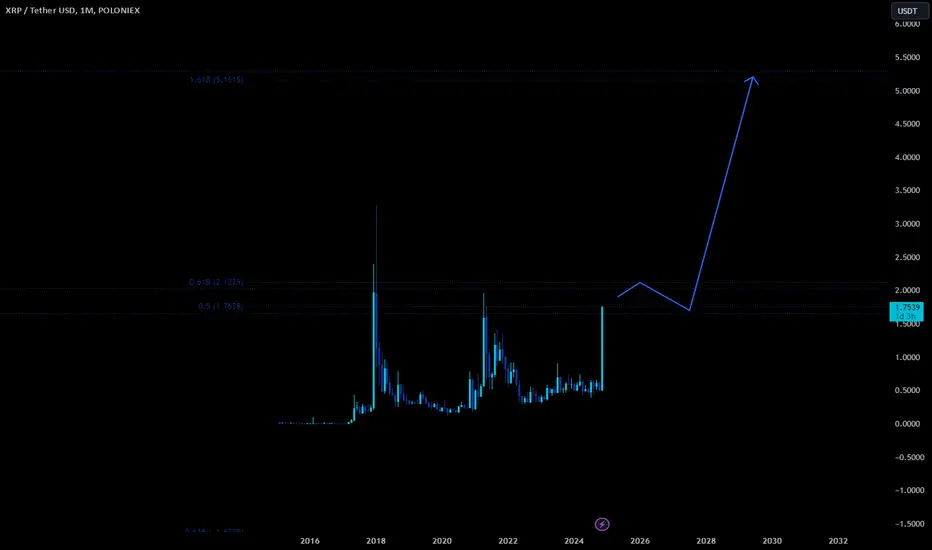
XRP has tested this monthly/yearly level before. Last time it rejected as it was the first test of major resistance. Now a couple years later we are testing $1.70 again. If we gain this level and hold, I see XRP blowing through all time highs. My yearly and monthly projections have price going to $5. Not saying it will do that, but I think there is high likely it will if we hold $1.70. I am not long as I haven't traded crypto in a couple years. I normally would never long a crypto that is up as much as XRP the past month, but the chart is looking prime for higher if we hold here on the monthly and possibly the yearly. I will update on the close of the yearly in a month.
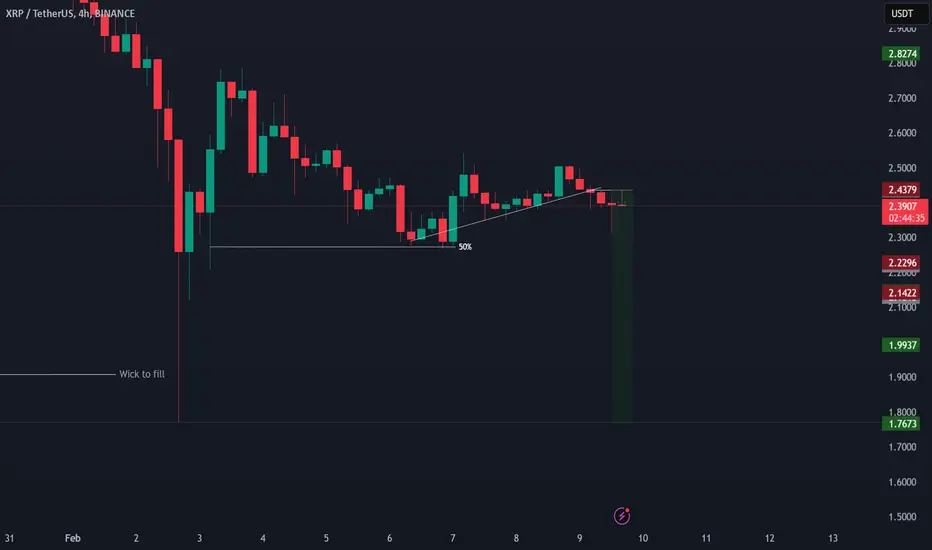
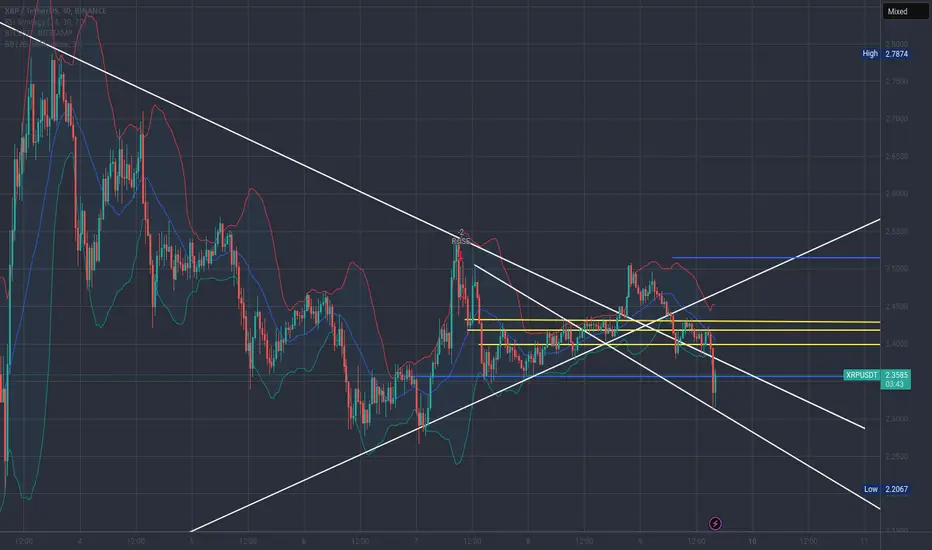
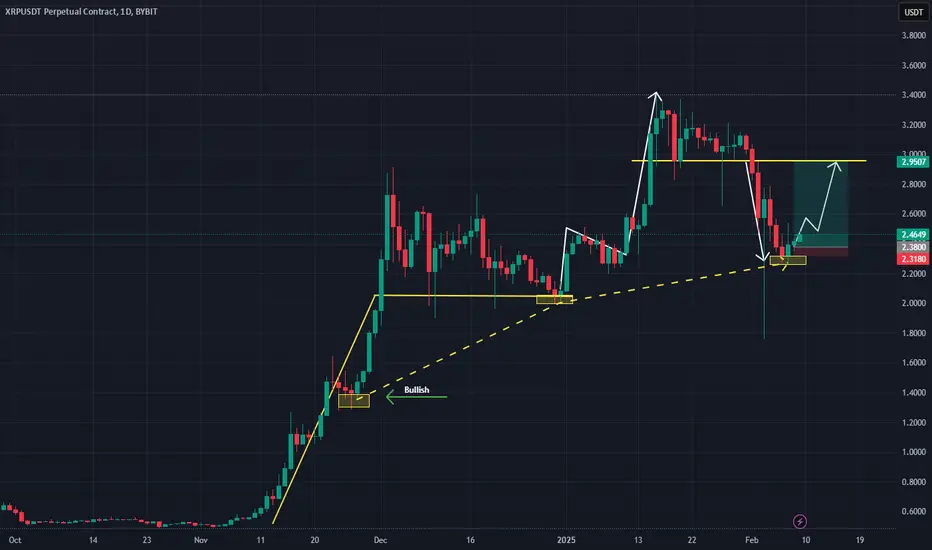
XRP Breaks Out of Downtrend Is a Big Rally About to Begin ?XRP is currently trading around 2.42 and has recently broken out of a descending channel formation. This breakout suggests a potential shift in momentum from bearish to bullish. The price is now consolidating just above the trendline, indicating that buyers are stepping in to support this level.
The descending channel was characterized by consistent lower highs and lower lows. However, the breakout above the upper boundary of the channel signals that the selling pressure may be weakening. If the price holds above this level, further upside movement is expected.
A key support level is now established around 2.40 to 2.42, which was previously resistance. If the price stays above this zone, the bullish case strengthens. Immediate resistance is found around 2.50 to 2.55, where price has faced rejection before. A decisive break above this area would confirm further upside movement.
Volume analysis shows that trading activity is still relatively low, which is common during consolidation phases. A strong increase in volume above 2.45 would provide additional confirmation of bullish strength. Monitoring this volume breakout is essential for validating the move.
Momentum indicators such as the RSI should also be observed. If RSI moves above 55 to 60, it would indicate growing buying pressure. A hidden bullish divergence, if present, would add further confidence to the breakout.
The first target for this breakout is 2.50 to 2.55, where resistance is expected. If price gains strength beyond this zone, the second target would be 2.65 to 2.70. These levels mark potential areas where price could face selling pressure or profit-taking.
To manage risk, a stop-loss should be placed below 2.38 to 2.40 to avoid potential fakeouts. If price falls back below this support, the breakout could be invalidated, leading to a potential retest of lower levels.
XRP is at a crucial turning point, with signs of bullish momentum building. If the price sustains above the breakout zone and breaks through 2.45 to 2.48 with strong volume, a larger upward move could follow. Traders should remain cautious but keep an eye on price action for confirmation of the next trend direction.

XRP all of the counts I am eyeing**XRP Elliott Wave Correction Scenarios:**
🔹 **Wave 2 Corrections:**
- **Zigzag (5-3-5):** Sharp drop, retracing **61.8-78.6%** of Wave 1. 🚀
- **Flat (3-3-5):** Sideways chop, retracing **38.2-61.8%** (watch for expanded flats). 📉
- **Running Flat:** Bullish signal if C-wave **fails to break A**. ⚡
🔹 **Wave 4 Corrections:**
- **Triangle (A-B-C-D-E):** Common for Wave 4, **38.2% retracement** of Wave 3. 🔺
- **Flat or Complex:** Sideways structure before Wave 5 breakout. 📊
Key levels: Watch **Fib zones + structure** for the next move! 🚀
Everybody and their mother is waiting for another XRP dipEveryone and their mother is waiting for an XRP dip. The biggest liquidation wave of all time happened last week. But nothing is enough for them and they assume that the market will be so kind as to offer another place to buy and win.
The train has already left and the journey is just beginning. I can't give exact dates but my graph follows the historical price development of XRP in 2017-2018 when it rose explosively. A similar graph adjusted to today's prices could roughly raise XRP 0.5$->3$->10$->100$ which could be the peak prices of this bull run in about a year.

XRP's downfall in order!BINANCE:XRPUSDT
Ripple's gonna decrease cause of the head and shoulder pattern.
The pattern's has not been completed yet! after the break out happens,the price shall reach the next support which is around 1.3990!
⚠️ Disclaimer:
This is not financial advice. Always manage your risks and trade responsibly.
👉 Follow me for daily updates,
💬 Comment and like to share your thoughts,
📌 And check the link in my bio for even more resources!
Let’s navigate the markets together—join the journey today! 💹✨

XRP/USDT as long as the price - Retrest upThe current short-term bearish trend is expected to quickly reset the neutral or bearish trend. To avoid contradicting the short term, it would be possible to favour short positions (for sale) for RIPPLE - XRP/USDT as long as the price remains well below . The next bearish objective for sellers is set at . A bearish break of this support would revive the bearish momentum. The sellers could then target the support located at . In case of crossing, the next objective would be the support located at . As the basic trend is not clearly displayed, attention should be paid to the price response to the support located at . With this support, against the trend traders who want to buy RIPPLE - XRP/USDT on a buy signal from their trading strategy should not hesitate to act.

2x for xrpusdt or 1/2 ? that's the questionyou can see that xrp has broken the old all time high and did a pullback and it seems that we are waiting for a 150% rally but another scenario is that it may be a fake breakout and it would go back into the wide wide trading range that it has been inside 60% probabilty is in favor of an 150% rally but let's see what would happen
