XRP is still waiting for a longI think that XRP - and looking at the Total Market Cap chart - has taken a downward trend. Although the RSI is well above 70 on the daily timeframe, the faster leg is already approaching 50. Looking at the 4-hour RSI, as long as it is below 50, I do not expect an upward movement. I see a chance for further upward movement if the chart is currently above $3.2971. It is worth watching the 4-hour 50 EMA for possible long position opening, but only if the price crosses the 4-hour 50 EMA upwards. There could be a danger if it breaks the 50 EMA on the daily, which will be around $2.7. I should add that the 4-hour 200 EMA is around $2.8, so there will be a band between 2.7-2.8 where the chart can dance before deciding which direction to take. As long as the RSI MA is above 50 on the day, long-term positions - which were started around 2023 - should not be negatively affected by this "small" sell off. I think it is worth waiting for now for longs, not to enter an upward trade into the declining chart. Attention should be focused on the 4-hour 50 ema/chart cross, and the 4-hour rsi MA 50 cross. Until these are met, starting a long is life-threatening. I am curious how you see it.
XRPUST trade ideas

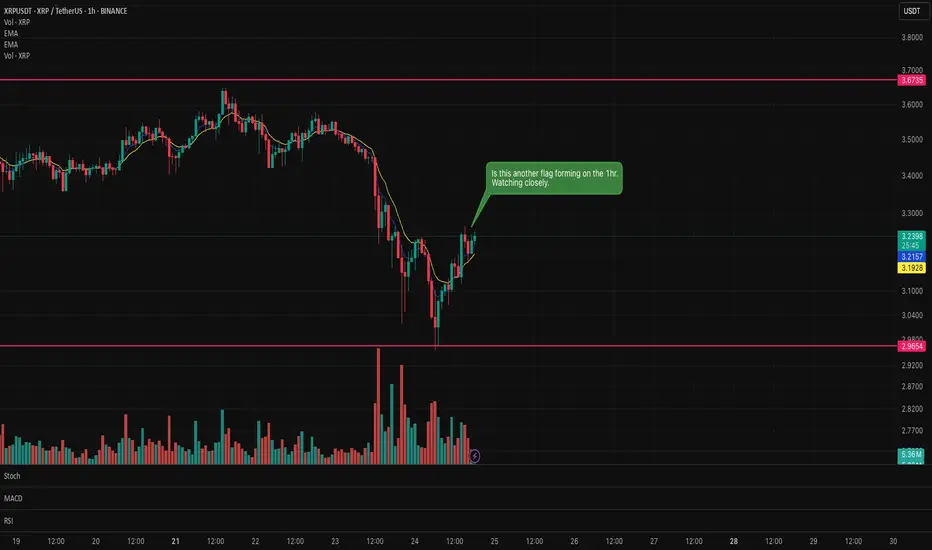
Is there another XRP flag forming on the hourly chart?Could be another flag forming on XRP. Waiting for the formation to prove confirmation as to whether it will be a bull or bear flag.
News of large amounts of XRP entering the exchanges from the CEO could mean a bear flag?
It's only appearing on the hourly so it could be a false flag.
Let's what and see what forms on the hourly candle.
XRP is heading toward $4 ┆ HolderStatBYBIT:XRPUSDT is testing $3.40 for the third time. A breakout targets $3.60, but rejection risks $3.10 fallback.
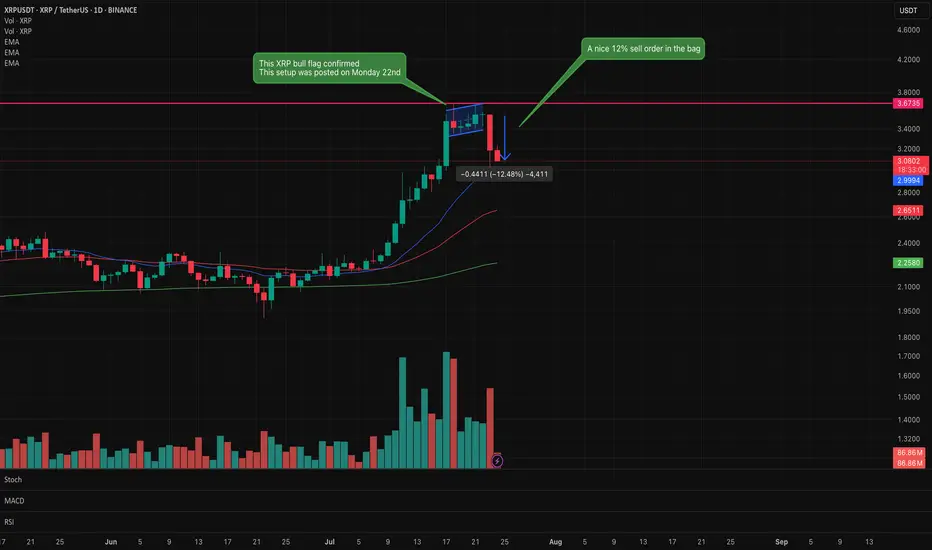
XRP Bear flag confirmed. Looking for support in the decline.XRP bear flag identified on Monday 22nd has now confirmed with a nice 12% short sell.
This signals do not always confirm but when they do it is satisfying that the analysis and patience has paid off.
Trading is all about controlling emotions and being patient. Wait for the confirmation before executing.
XRP Hello friends, Ripple will probably rest a little on the middle line of the channel. Any lower is a buying opportunity, in my opinion 4.

Weekly trading plan for XRP BINANCE:XRPUSDT Last week played out perfectly - price followed our green scenario, broke through resistance, and hit all targets. Now we're clearly in a correction phase. Here's what I'm watching:
$3.16 level - Waiting for this to break before expecting consolidation in that former resistance zone
$3.30 pivot - This week's key reversal level
$3.45 resistance - If we break $3.30 but can't push past $3.45, we'll likely see the correction extend down to $3
Not making predictions here - just setting the levels that'll tell us what's next.

XRP Breakdown – Trend Break & Liquidity Zone Retest In ProgressXRP just gave us a clean breakdown below a well-formed ascending structure, violating both its dynamic trendline and horizontal support.
Let’s break down the setup:
🔹 Trend Context: Price was holding cleanly above the MA and respecting a dotted trendline, bouncing off prior breakout zones multiple times. This uptrend was sustained for days, with momentum supported by both MACD histogram expansion and Stoch RSI resets.
🔹 Structure Shift: After a minor consolidation, price rejected from the upper range and aggressively broke below support. The last long was closed during this transition — confirming the momentum was fading.
🔹 Liquidity Zones: The prior resistance-turned-support zone failed, with price wicking below and potentially sweeping stop orders before stabilizing.
🔹 Momentum Flip: MACD histogram has flipped red, and Stoch RSI is deeply oversold. This signals possible short-term exhaustion, but trend structure is clearly damaged.
Traders now face two scenarios:
1️⃣ Bearish case → Breakdown holds, and price trends lower into deeper liquidity (~3.00 or even 2.71).
2️⃣ Bullish case → Price reclaims structure with strength, invalidating the breakdown and trapping early shorts.
Key levels are in play. Wait for confirmation — especially on the retest.
#XRP #Breakdown #CryptoAnalysis #MACDStrategy #SupportResistance #LiquidityZones #TrendBreak #TechnicalAnalysis #AlgoTrading #QuantStrategy

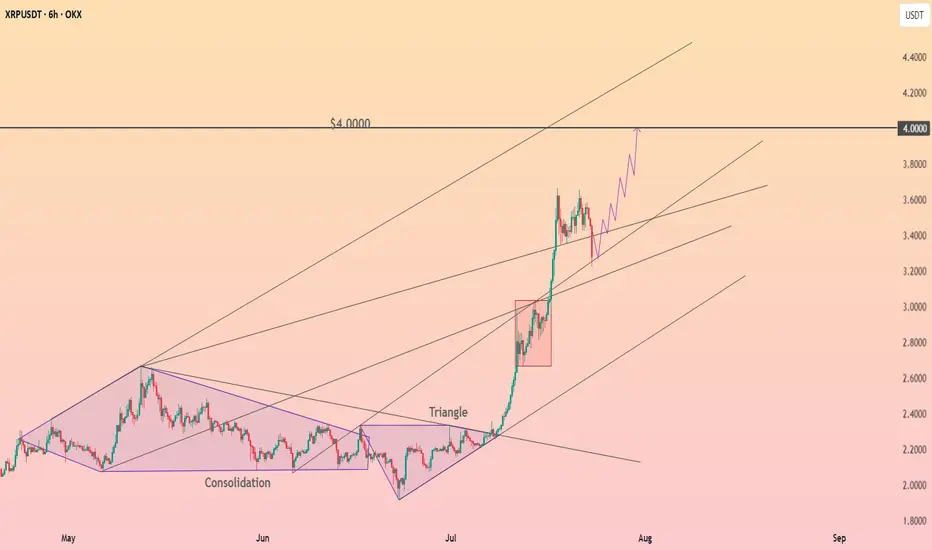
$XRP Breakout Loading, Watch That Triangle! XRP is forming a bullish ascending triangle
The price is holding higher lows while facing resistance around $3.60. This is a typical sign of buyers stepping in. If XRP breaks above this resistance with strong volume, a sharp move toward $4.30–$4.40 could follow. Until then, it’s building pressure inside the triangle. Breakout confirmation is key for the next leg up.

XRP TRENDXRP is following the same pattern.
Following Trend as well.
Final Target 6-8 USD maybe 10-12 USD
XRP - take LONG after range SL huntXRP - take LONG after range SL hunt
trend is up
price is above previous HIGH
big chance for trend to go on

Double Top = liquidity trap?XRP formed a clear double top, tapping into external liquidity.
Price swept the highs, triggering stop hunts above resistance.
A Break of Structure (BOS) confirms bearish intent.
Expecting a sell-off toward the $$ liquidity zone below. 📉

HolderStat┆XRPUSD seeks to the $4BYBIT:XRPUSDT remains steady above $3.10 after the recent breakout. Resistance at $3.40 is being tested. A move above it may unlock $3.55+.

$XRP SHORT POSITIONING 🚨 XRP Market Update – July 22, 2025
📉 Current Price: ~$3.49 USD
24H Range: $3.43 – $3.64
24H Volume: Over $10 Billion
Market Sentiment: Slight correction amid broader crypto market pullback.

XRP Price Reversal Likely After $2.81 Billion Selling In 7 DaysBINANCE:XRPUSDT is currently trading at $3.48, only 4% away from its all-time high . Over the past week, exchange wallets saw an influx of nearly 450 million XRP, valued at more than $2.81 billion . This spike in supply indicates that holders are moving their assets to sell, usually a bearish indicator in market cycles.
Despite the proximity, BINANCE:XRPUSDT price is showing signs of weakness and is clinging to the $3.38 support level . Without renewed buying interest, this support may not hold much longer.
If investor selling continues, BINANCE:XRPUSDT could fall through $3.38 and test the $3.00 support . A drop to this level would erase the recent gains and confirm a near-term bearish reversal. The loss of $3.00 could signal a longer consolidation phase or deeper correction.
However, if market participants absorb the sold supply and restore demand, BINANCE:XRPUSDT could rebound quickly . In this scenario, the altcoin might surpass $3.66, breach $3.80, and aim for $4.00 . Such a move would invalidate the bearish outlook and set a new all-time high.

The More You Believe You Know The More You LoseThe moment you see your first green position something changes Suddenly your brain convinces you you’ve got this But the market doesn’t punish bad traders it punishes the ones who think they’re too good to lose
You don’t lose because you’re unskilled
You lose because you believe you’ve mastered the game
Hello✌️
Spend 3 minutes ⏰ reading this educational material.
🎯 Analytical Insight on Ripple:
BINANCE:XRPUSDT remains undervalued at current levels, showing strong volume near a key daily support zone that aligns closely with a major Fibonacci retracement. This confluence suggests a potential shift in momentum. If buyers hold this level, a move toward the $4 area is on the table, representing an estimated 15% upside. 📈 Watch for confirmation through sustained volume and price reaction at support. ⚡
Now , let's dive into the educational section,
🎯 The Confidence Trap
One of the most dangerous mental states for a trader is early victory That moment after a couple of green trades when you start feeling like you’ve figured the market out That’s when the market does to you what you used to do to clueless beginners
From that point forward your decisions aren’t based on analysis they’re based on this thought
I already know how this works.
🧠 How Your Mind Tricks You
You win once Your brain says “Told you you’re good”
You win again It says “Go heavier now”
You lose It says “Fix it now You’ve done it before”
This cycle leads to overtrading and emotional revenge You’re no longer trading the market you’re defending the version of yourself you believe you’ve become
🔄 The Market Doesn’t Send Signals It Sends Lessons
When the market moves against you it’s doing the right thing It’s breaking down your ego so you can finally start seeing the chart for what it is not what your confidence wants it to be
🧱 Experience Can Kill Learning
Many failed traders are not beginners they’re the ones with years of bias built up At some point they stop learning Every chart starts looking the same That’s when their final trade shows up
🕳 The Ego Pitfall
If your mind tells you “I know this” it’s time to be extra cautious That means you’re trading with a rigid mindset And in crypto markets the rigid get destroyed
📉 High Leverage = High Confidence = High Risk
Nobody gets reckless on 2x leverage But once you start feeling pro you go 20x 50x or more And when the market flips the same ego that won you your first big gain is the one that wipes out your entire account.
📊 How TradingView Tools Can Save You
In this mental trap three tools from TradingView can seriously help
Replay Bar Tool
Go back in time and relive previous market conditions This tool shows you exactly where your bias failed and where your overconfidence blinded you It helps kill that false feeling of mastery
OBV (On Balance Volume)
A simple yet powerful volume indicator If price rises but OBV is falling the uptrend is fake If price drops but OBV is climbing sellers are weak and a reversal might be near This gives volume context beyond candles
Volume Spike
Watch out for sudden surges in volume If volume explodes but price barely moves someone big is moving in silence It’s often the prelude to fakeouts traps or major directional shifts These spikes scream pay attention
Risk-to-Reward Tool
Don’t let your “confidence” make you forget basic math This tool gives you the true ratio of what you’re risking versus what you’re chasing It doesn’t care how good you feel it shows you if the trade makes sense
🧊 Humility Is the Only Edge That Lasts
Humility means accepting you might always be wrong It means checking yourself with objective tools It means saying “maybe” instead of “definitely”
It means lasting longer than the rest
🔚 Final Words
If you’re sure you’ve mastered the market pause The best traders second-guess themselves often not because they’re weak but because they know confidence fades but risk never does
✨ Need a little love!
We pour love into every post your support keeps us inspired! 💛 Don’t be shy, we’d love to hear from you on comments. Big thanks , Mad Whale 🐋
📜Please make sure to do your own research before investing, and review the disclaimer provided at the end of each post.

xrpusdt 1hr time frame bullish iH&S patternactivated bullish patter on top of prev. ATh level. targets are 3.60, 3.65 and 3.73
invalidation: a close below 3.40

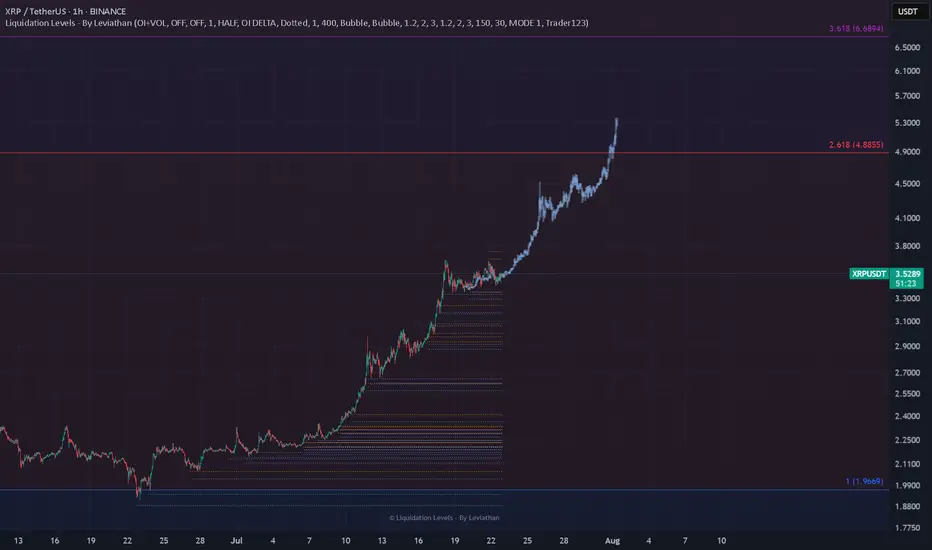
XRP: Whales Exit Pressure Plummets 94%! New ATH Incoming?CRYPTOCAP:XRP is consolidating near its recent highs, but don't let that fool you! Fresh on-chain data suggests a major move is brewing.
Latest analysis shows: BINANCE:XRPUSDT
🔹 Whale-to-Exchange Flow has plummeted by a staggering 94%, indicating large holders are strongly reducing their selling intent. This massive drop in supply pressure is a HUGE bullish signal!
🔹 New holders are entering and showing strong conviction, absorbing any remaining selling.
🔹 Key resistance sits at $3.59, with a potential push towards $4.64 based on Fibonacci extensions. Crucial support at $2.95 defends the bullish outlook.

XRP – Intraday Breakout in MotionCRYPTOCAP:XRP is showing signs of strength on the 1-hour chart, breaking out of a symmetrical triangle 📈. This classic pattern often signals continuation when confirmed properly.
A clean retest of the breakout zone could open the door for another bullish leg up 🔄.
Short-term traders should stay cautious though—lower timeframes can lead to quick traps or fakeouts ⚠️.
For now, momentum is leaning bullish. Keep your eyes on how price behaves from here! 👀

XRP To $5-$5.25Typical XRP breakout pattern. Expect cup and handle consolidation to keep forming this week before a quick move to $5 before th end of the month. From there i expect a broader market correction but final pt's around $6-7

#XRPUSDT – Massive Breakout from Bullish Pennant | Eyeing $4.80+XRP has exploded out of a multi-month bullish pennant formation on the weekly timeframe, confirming a strong continuation pattern after a period of consolidation.
🔹 Key Technical Insights:
✅ Bullish pennant structure formed after a parabolic run
✅ Strong breakout candle with volume confirmation
🔼 Price now testing $3.60+ area
🎯 Target zone next: $4.80–$5.00, aligned with previous price inefficiencies and psychological resistance
📌 Why This Matters:
XRP is showing one of the cleanest technical breakouts among large-cap altcoins
Weekly breakout from consolidation = high probability continuation
Ideal for swing traders looking for momentum plays
As long as the breakout structure holds, XRP could continue its rally toward the upper target range.

XRP Update | Long-Term Breakout In PlayCRYPTOCAP:XRP has successfully broken out of the descending channel and is currently approaching the key resistance zone at $4.29 — the first major long-term target shared earlier.
What’s next?
It’s now trading at a critical resistance, and a retest is highly likely. A clean pullback to the $3.51–$3.57 zone will offer the ideal entry opportunity for long-term positional traders.
Updated Trade Setup:
Entry: $3.51–$3.57 (wait for retest)
Stop Loss: Below $3.38
Support Zones: $2.53 / $3.51
Resistance Zones: $4.29 / $7.53 / $11.98 / $18.00
Targets:
TP1: $4.29 (nearly hit)
TP2: $7.53
TP3: $11.98
TP4: $18.00
This breakout structure remains highly bullish. Let price come to you — avoid chasing the move. A retest entry could offer better RR for the next leg.
DYOR | Not Financial Advice

XRP - ContinueRipple's price movement in the main channel and its decline or decrease to the lowest price level has been completed, and we can expect an increase in the price of this currency in the crypto market. Ripple's analysis has recorded a 200% increase so far, which you can see the results of in past analyses.
Sasha Charkhchian

Bullish XRP Setup: $7, $9, and $13 Main Price TargetsHello✌
Let’s analyze Ripple’s upcoming price potential 📈.
BINANCE:XRPUSDT , I expect a long-term upward bullish trend.
There are three main targets in this analysis: $7, $9, and a final target of $13, which could be reached within 2 to 6 years.
The price may form parallel channels at times, which are shown on the chart. I also expect the current bullish channel to remain valid and continue upward. Additionally, there is a strong trendline guiding the movement.
✨We put love into every post!
Your support inspires us 💛 Drop a comment we’d love to hear from you! Thanks , Mad Whale🐋
🐋Many of the points and levels shown on the chart are based on personal experience, feeling, and over 7 years of research and daily study of crypto charts.
Some of the lines, channels, and price zones are drawn to make the chart easier to understand and to help imagine possible future price movements.
I’ve also included one very big drop in price even bigger than the others because in the crypto market, it’s common for prices to suddenly fall hard and push out small investors and traders with positions.
The targets on the chart are not guaranteed; they might be reached, or they might not.📚
📜Please make sure to do your own research before investing, and review the disclaimer provided at the end of each post.
