XRP intra?
Hi
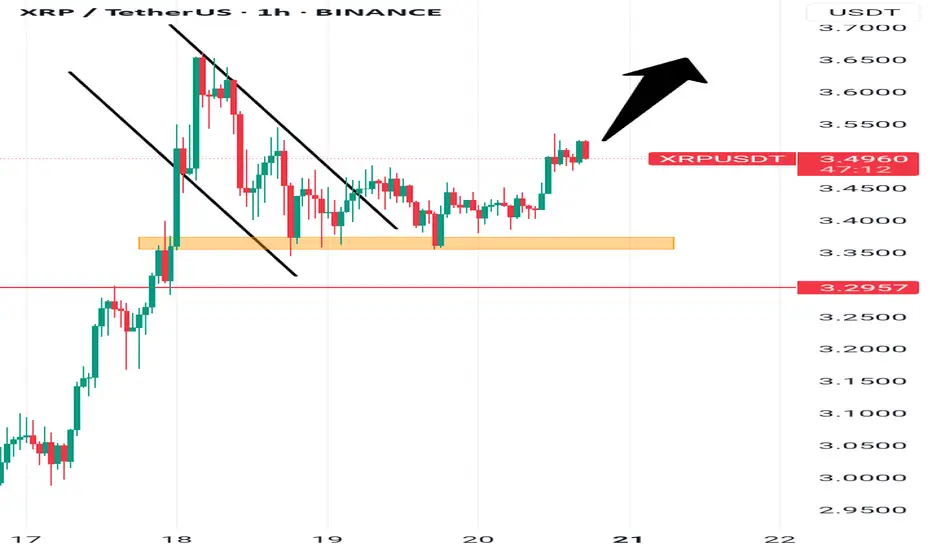
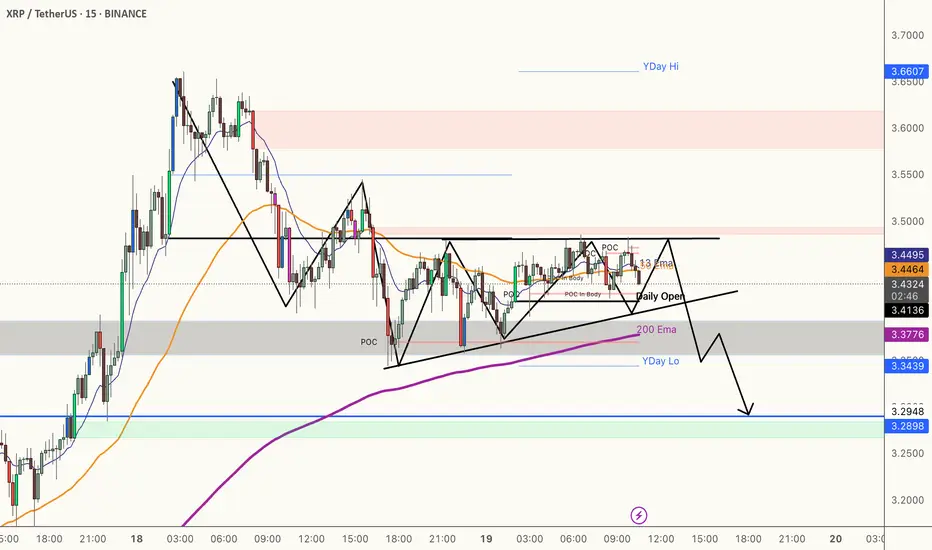
We have a mini break @ 3.55 ( 2 times this high )
Mini becoz we have a higher price to break 3.65
This is a good indication= printing higher prices
30m formed a triangle
Will it break this bullish triangle and make new high/ test 3.65
Void= if triangle break lower.. (then will be looking another setup)
Trading, stop loss ready.. if printing less than 3.55 range to 3.50.
All the best
Not a guru
This not a signal.. coz u 'll need to think before entry
XRPUST trade ideas

XRP - Probable Trade!!! Very Yet!This trade is very probable and very to your extend beyond your imagination! Wait and watch!

$PEPE chartCRYPTOCAP:PEPE cup and handle. Cup in the making? CRYPTOCAP:PEPE has one of the highest beta as a meme coin and is a high beta proxy for Ethereum. ETH is on its way to $4000 now

XRP- Caught The Move. Then Got Chopped. How Backtesting Fixed ItXRP printed a strong trend — and the strategy caught it early. But partway through the move, price stalled in a tight range and the position was exited early.
That’s where backtesting and tuning come in.
In the first test, the strategy used default settings with Signal MA = 220. It entered cleanly, but exited mid-chop.
After adjusting the Signal MA to over 800, the strategy started holding through the noise and stayed in the move — with higher PNL and a slightly increased drawdown. Ended on 900.
This is the power of understanding how your system behaves in different conditions.
By adjusting signal sensitivity, you can reduce premature exits without chasing every move. The goal isn’t perfection — it’s better retention of valid trends without overfitting.
This example shows how simple tweaks, backed by clear test results, can make a measurable difference.
—
#XRPUSD #Backtesting #MACDStrategy #LiquidityTracker #CryptoTrading #TradingView #QuantTradingPro #StrategyOptimization #TradingSystems

Bullish movemmentXrp passed its previous highest high denoted with a red line(resistance level), continued moving upward and created a pull back.
On the H1, there is a clear w formation as the bigger structure and a small range followed by a continuous move upwards.
The move will continue complete the W formation.
XRP | Great TP Zone is HERE for HODLERSXRP has seen a 62% increase since breaking out above the moving averages in the daily timeframe.
The previous time XRP broke out above the moving averages in the daily, the price increased around 440%:
However, with XRP being the ultimate pumper and dumper, I'll take my chances at 62%! Because this bull run has been anything but ordinary and it's best to avoid being too greedy. The price of XRP falls extremely quick, just as quick as it rises.. ( Maybe not overnight but you know, it has happened before ).
If you're one of few who bought around $1, or heck even later at $2, this is a solid increase and it should not be taken for granted. XRP has gone LONG periods without increases and often stayed behind making new ATH's when other cycles have come and gone (twice), as other alts make new ATH's. Over the years, I've made extensive posts on XRP; documented its use case, followed the SEC case closely and yet, XRP still remains one of the strangest and most unpredictable alts I have ever tried to analyze. Long term followers will remember that a I was bullish in 2018/2019 and then slowly became uninterested up until the point of negative towards XRP for probably the past 3-4 years.
This is not only because of the lagging price compared to other older alts that soared like ETH and even Litecoin. Sure we did not see the growth and the taco stand ( who remembers ) just kept dumping on the market... But the entire "scandal" of the actors marketing/pimping, the dumping behind the scenes by executives to fund Ripple in early days, the lawsuit etc. was just such a colossal mess that I even wonder how XRP is still alive and kicking today.
All I'm saying is that this is truly a spectacular moment - it's hard to even imagine cripple crossed $3 after years and years of waiting on XRP when other alts x1000% and beyond. Point being - Don't miss it! Trading only works when you take profits.
________________________
BINANCE:XRPUSDT
XRP - Long termIt should be noted that any asset may experience a sudden decrease in value, but XRP has had a slight decrease in price after a 150% increase from the price of $0.50. Although this currency will definitely increase in the future, it is necessary to pay attention to the decreases and make purchases within the price support areas because these support areas are highly regarded by the general public. In this analysis, two limits have been identified that are used to enter the market in the event of a price drop.
Sasha Charkhchian

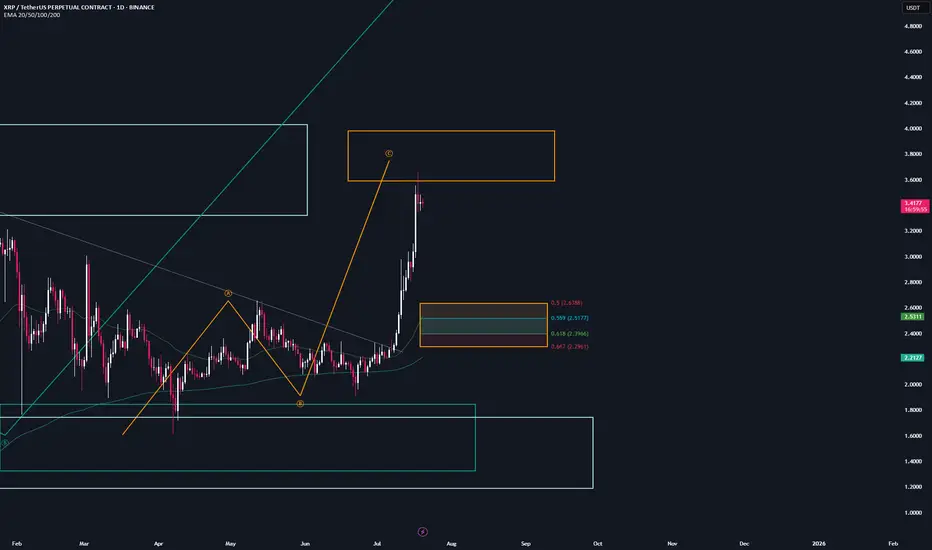
XRP | Trade-setup📌 Now that the target region has been reached, XRP is now allowed to approach its full correction level.
Trademanagement:
- I'm placing long orders at each level and SL right before the next level. (If the price continues climbing, I’ll adjust the trend reversal level (orange) accordingly and update my limit orders.)
- Once the trade reaches a 2 R/R, I’ll move the stop-loss to break-even.
- From a 3 R/R onward, I’ll start locking in profits.
✅ I welcome every correction from here on —
but I won’t enter any new positions at these top levels.
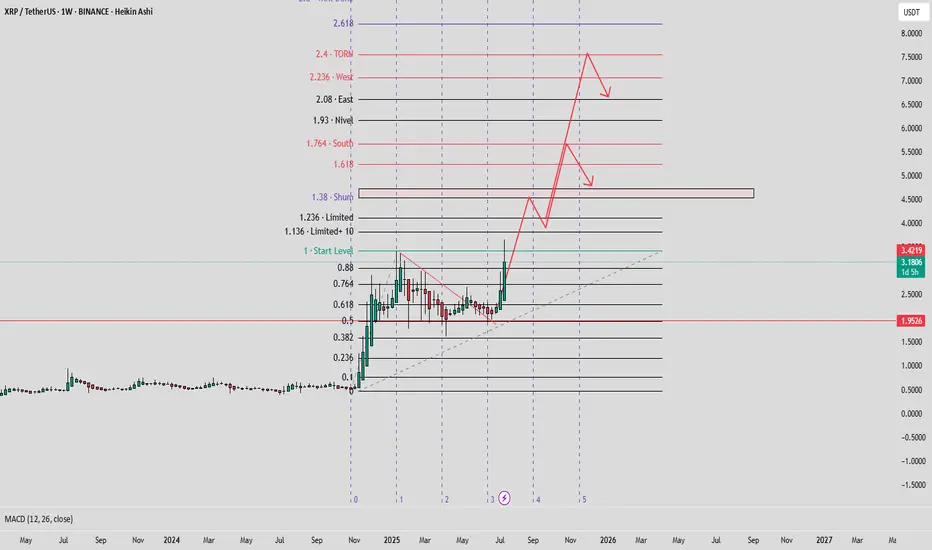
#XRP ALMAZOV PROJECTION#XRPUSD ALMAZOV PROJECTION WEEKLY
Price projection according to Almazov's theory, Bitcoin should at least touch $1.3, before pulling back or continuing to go long if its dimensionality decreases.
XRPUSDT SELLConsidering the divergence and price patterns and price support, expect a drop to the price of the opinion model.

Ripple Update: Is XRP Ready for Another 500% Growth?Hey friends, it’s Skeptic 🩵 . In this video, I’m giving an update on Ripple’s conditions , reviewing past triggers, and what to do with your long positions in futures if you’re still holding. For spot, what’s the move? I dove into XRP/BTC analysis and, at the end, broke down BTC.D , which just had a major event you need to pay close attention to. Don’t forget money management, and stay clear of FOMO. Drop your thoughts on XRP in the comments so we can chat about it!

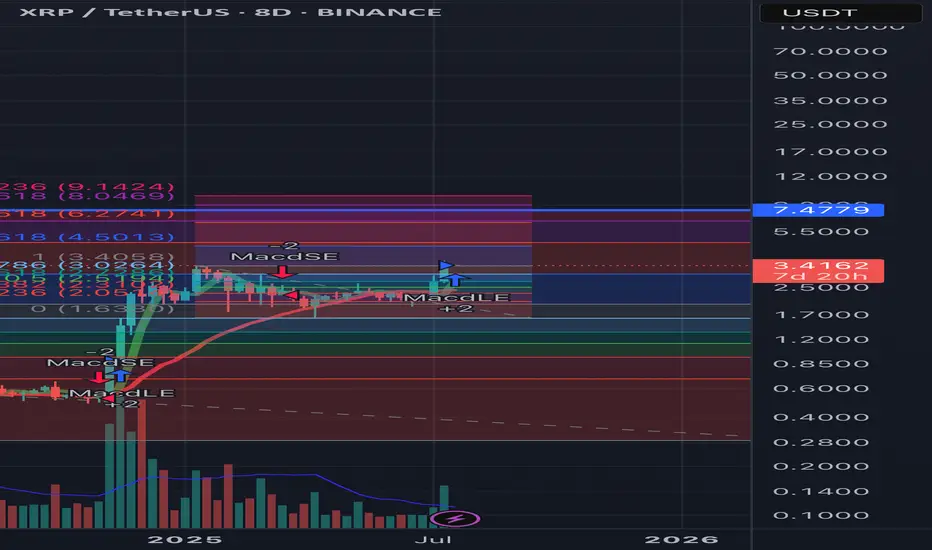
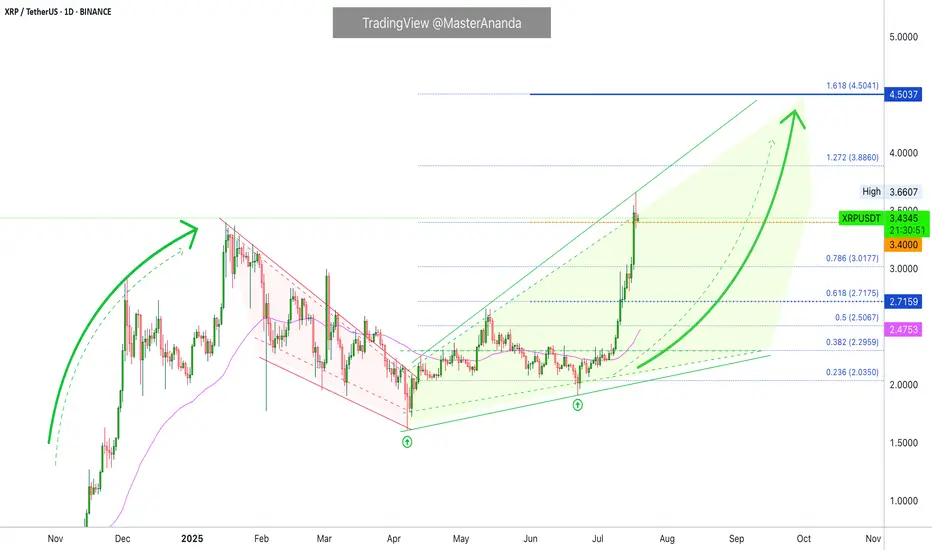
18$ XRP Mapped Out Projection – HOLD🚀 Just sharing some insights to help you explore what XRP might be capable of.
The chart you see here is a projection inspired by the path of XRP’s first major bull run. Surprisingly, I was able to map out around 95% of the key support and resistance levels using the Fibonacci extension tool.
📚 A little history lesson — while history doesn’t repeat itself exactly, it often rhymes in patterns.
Let’s see if XRP has another surprise in store for us this cycle. 🔄✨
#XRP #Crypto #FibLevels #Bullrun #ChartAnalysis

XRP : ETF...Hello dears
Considering the good growth we had, you can see that the price is stuck in a long-term range and has not managed to break it yet...
We must be prepared for any scenario, so the best thing to do is to buy stepwise, of course with capital and risk management.
Note that this analysis is on a daily time frame and may take a while, so if you are not patient, do not enter.
*Trade safely with us*
XRP needs a short and fast correction!After a long ride with HL triangles and pomps, it looks like an LH triangle and correction is on demand as TOTAL2 hit its big resistance.
Be wealthy and follow your strategy❤️

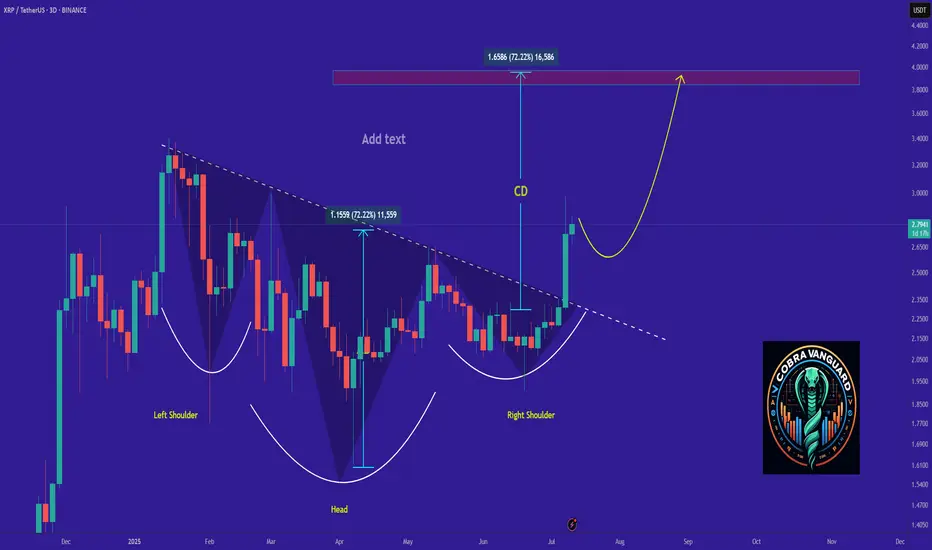
XRP - Time to buy again!The price has shown strong growth after breaking the head and shoulders pattern, and this upward trend may not end here. It could reach around $4 after a slight correction.
Best regards CobraVanguard.💚
XRPUSD ShortI expect XRP to make another move to the downside for a larger correction before we see further bullish momentum. On the 15-minute timeframe, a triangle pattern is currently forming, suggesting that a break below the 200 EMA is likely
XRP Update · What To Expect Short-Term (Now!)XRP just hit a new all-time high and this is truly awesome if you hold this pair, if you were bullish before the breakout, if you bought LONG, etc. It is also good if you are an analyst looking for clues that will tell you what will happen to the Cryptocurrency market in the near future.
Remember that XRP moved early to start this cycle and it moved strongly. Right now, it is moving early and strongly again in comparison to many other pairs. This tells us that the rest of the market will follow.
I saw very strong bullish action across many pairs but I also saw many pairs staying behind; below their April's high. Now, what happens next?
XRPUSDT made a stop after moving beyond its 16-January 2025 high. This is pretty normal behavior. After a strong rise, there is always a stop, retrace or correction. We do not expect a correction to develop now because the consolidation period was very long, strong and prolonged. So we don't have to worry about that one.
A retrace is possible but having one would be small and short-lived. Finally, a pause is the most likely scenario. A pause can range between 3-9 days. That is, that amount of time before additional growth.
The final possibility is the market moving straight up. Since we have a 126% rise since the 7-April low, we don't give much credit to this scenario. The top choice is a small pause before additional growth. The important part is "additional growth." This is what will happen. This is what comes next. XRP will continue growing. Boost if you agree.
Namaste.
XRP/USD LOOOOONGS🔀 Varied risks vs rewards
Break of downward trend ⤴️
🐃 Bullish overall bias
XRP army aren't stopping here 🌙
1️⃣ Tightest is - 1% (3.29) / 3% (3.69)
2️⃣ Mid - 1% (3.18) / 5% (4.18)
3️⃣ Large - 1.5% (3.10) / 6% (4.8)
Lets see how we goes!!

XRP Support Holds After Being Tested 12 Times...Everything below $2 is quickly bought. No crash is good news. Not having bearish action and bearish follow up on sellers pressure is bullish. XRP is bullish and has been consolidating for months. The longer XRP trades above $2, the stronger will be the bullish wave that follows. We are getting very close.
Good evening (morning) my fellow Cryptocurrency trader, I hope you are having a nice day.
The same level has been tested over and over and over since December 2024 and it continues to hold. XRP managed to wick below $2 more than twelve times, this support continues to hold. When prices move lower, buyers quickly show up.
Look at this, before 7-April XRP was moving below $2 very often. After 7-April, only twice. Big difference. This reveals a bullish bias. When the market was bearish, this support was tested more often than not. As soon as XRP turned bullish, it was tested only once recently and once after the 7-April bottom.
This little dynamic here shows that the bulls have the upper-hand and this is all we need to know. Knowing that the bulls have the advantage, when the market breaks it is going to break up. A bullish continuation. It is confirmed and it is only a matter of time.
How long? Only the market knows but it is not far away. The longer it takes, the stronger the bullish wave that follows. Strong growth is likely to develop within days.
Namaste.
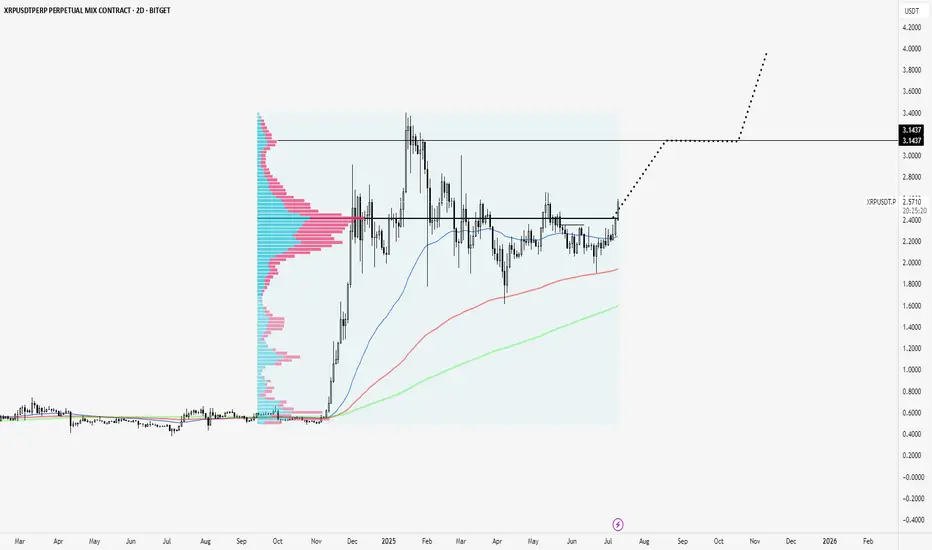
XRP clears Point of Control to test highs.XRP is breaking out of a consolidation zone and above a volume point of control that has been massive since its November rally onward.
Looks like next node is to $3.14
Super strong coin.
Ripple testimony in banking committee yesterday was bullish. Ripple partnering with BNY Melon yesterday was bullish. Ripple leading regulation standards with their XRP case is bullish. Ripple winning the status of XRP as one of a kind is bullish. Ripple getting a bank charter and fed master account is bullish.
Not much is close to XRP fundamentally.
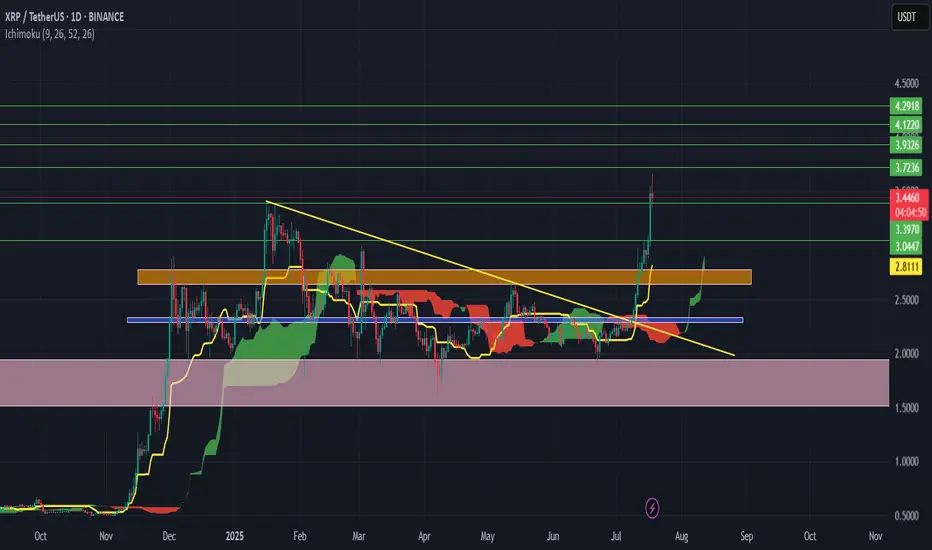
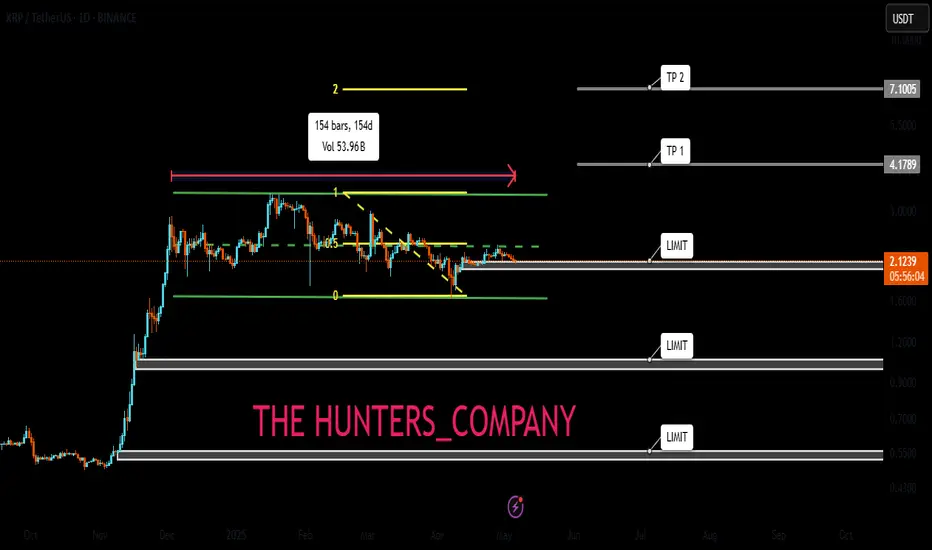
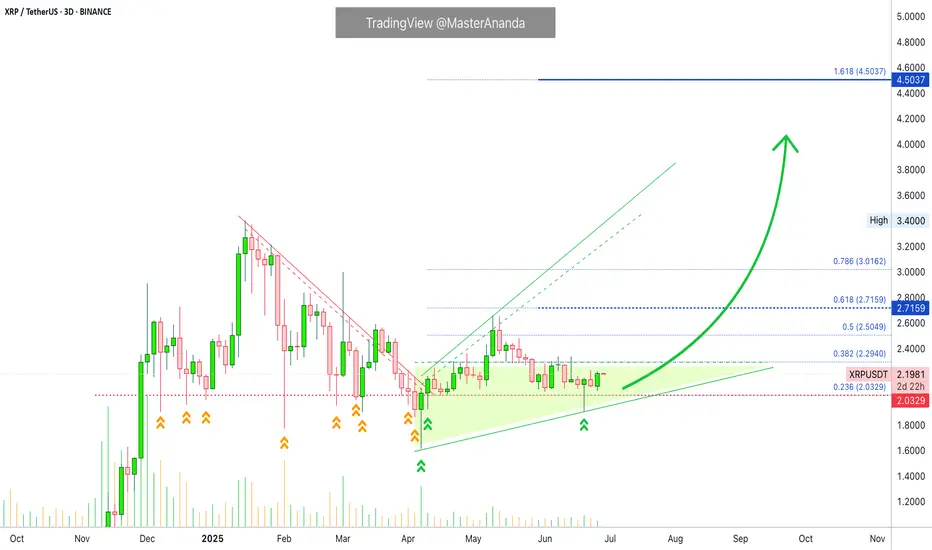
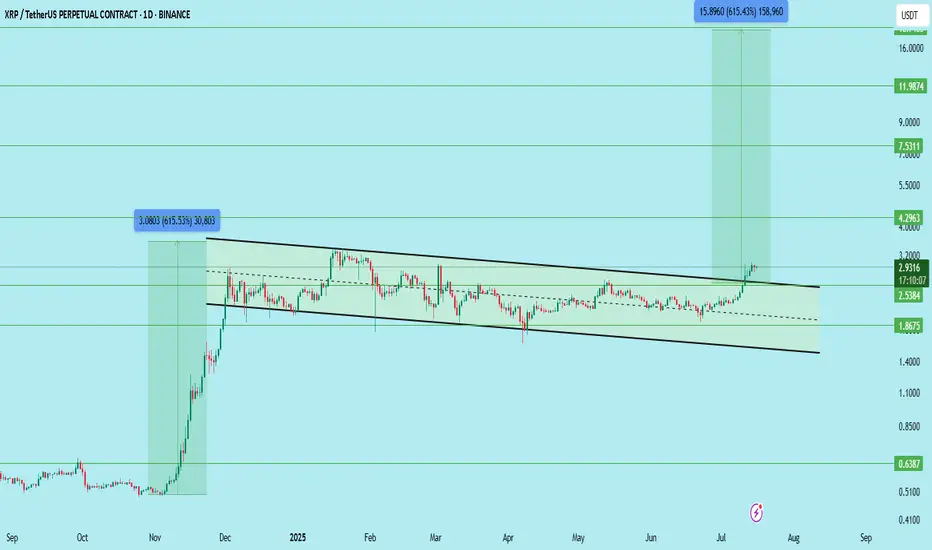
$XRPUSDT LONG TERM SETUP for SPOT !!CRYPTOCAP:XRP has officially broken out of its long-standing descending channel on the daily timeframe.
This is a major structure breakout and opens the door for a big move, but patience is key. Wait for a clean retest before entering the trade.
Trade Setup:
Entry (Ideal Retest Zone): $2.53 – $2.75
Stop Loss: Below $2.38
Resistance/Support Zones:
Immediate Support: $2.53
Resistance Levels: $4.29 / $7.53 / $11.98 / $18.00
Targets (Long-Term):
TP1: $4.29
TP2: $7.53
TP3: $11.98
TP4: $18.00
Potential Profit: Over 500%+ if it plays out fully
This is a long-term breakout structure — don’t rush. Wait for confirmation on the pullback.
DYOR | Not Financial Advice
Up to New HighsDO NOT FORGET USING A STOP LOSS
Warning:
This is just a suggestion and we do not guarantee profits. We advise you analyze the chart before opening any position.
I hope you are always profitable