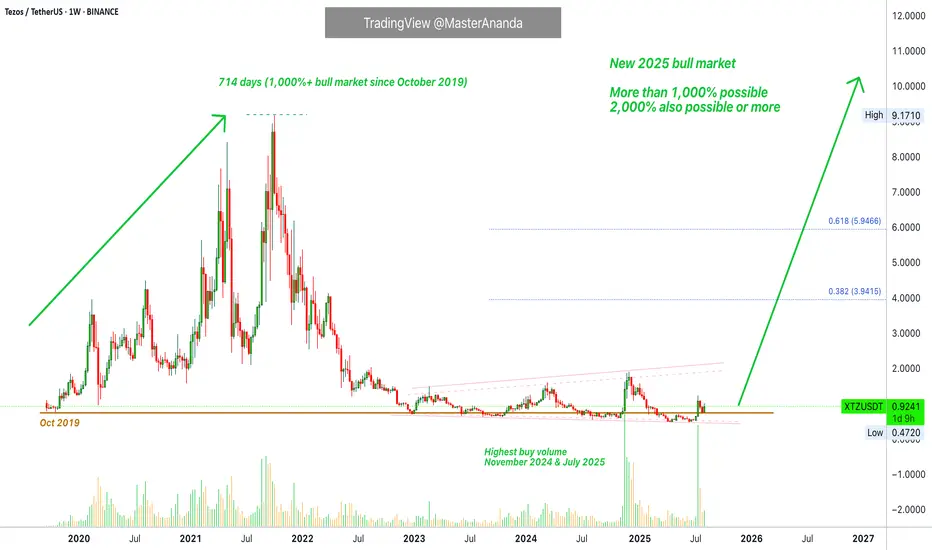
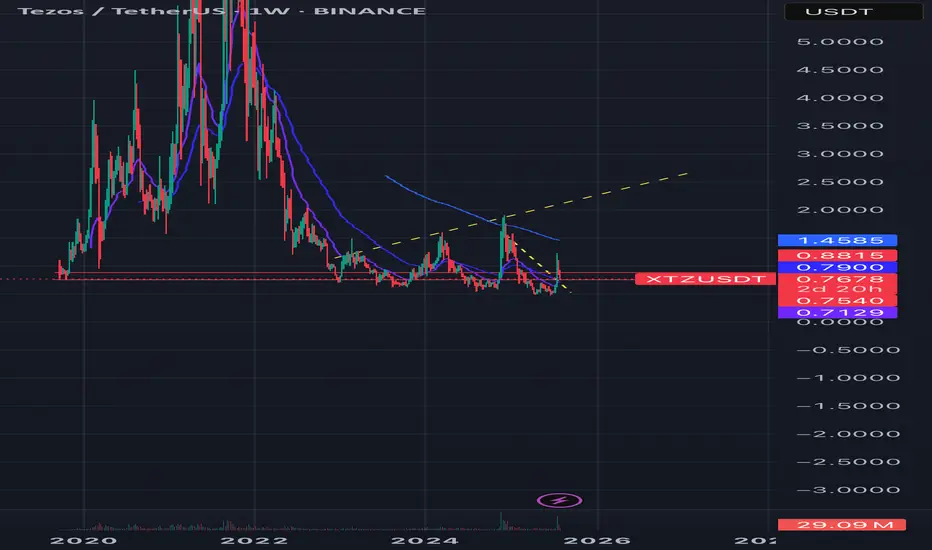
Linear Tezos · 2,000% 2025 Bull MarketThe same support zone from 2019, pre-massive 2021 bull market, is being activated ultra long-term, since November 2022. That is, XTZUSDT (Tezos) has been trading at bottom prices for almost three years.
Just a month within the current price range managed to support a 1,111%+ bull market, one that lasted 714 days. Who is to say that the next bull market will only last 2 months? I saw one of the top authors here saying that everything would end after just 1-2 months. Why not 2-3 years?
So Tezos grew for 714 days, higher highs and higher lows, a classic uptrend. Then it entered a bear market and went down for more than a year. So years going up and more than a year going down. And then the market went sideways for almost three years. Notice how everything last years. One year or more.
This chart and much more I've been seeing is letting me believe that we are set to experience an ultra, unusual, splendid, unique and long lasting bull market. It will be different. It will be the same in the sense that it happens every 4 years and we have massive marketwide growth. It will be different because some pairs will grow for months while others will continue to grow non-stop for a decade or more. Some pairs will grow for 2 years and then crash while others will grow 3 or 4. It is a mixed bag. It is a big market and it continues to evolve. This is awesome news, don't get it confused. This is the best possible news ever. We are used to fast and this gives little time for adaptation. Market conditions are different now. You will have all the time you need to become rich. The bull market is being turned on and it will never be turned off again, at least not for our generation.
Thank you for reading.
Tezos is going up long-term. Massive growth.
Namaste.
XTZUSDT trade ideas
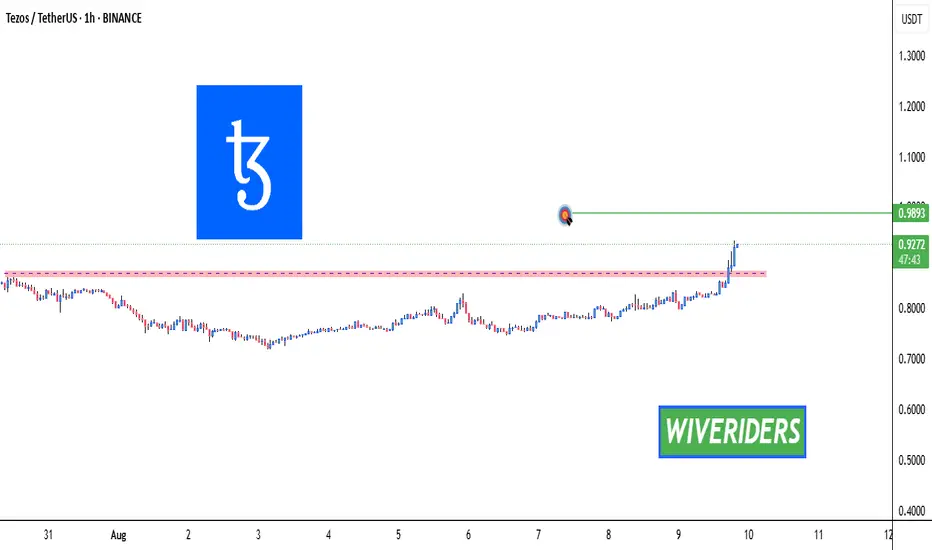
XTZ Breakout Alert – Red Resistance Cleared!🚨 SEED_DONKEYDAN_MARKET_CAP:XTZ Breakout Alert – Red Resistance Cleared! 🔴✅
SEED_DONKEYDAN_MARKET_CAP:XTZ has broken out of the red resistance zone.
📊 Breakout signals bullish momentum — next move could target the green line level.
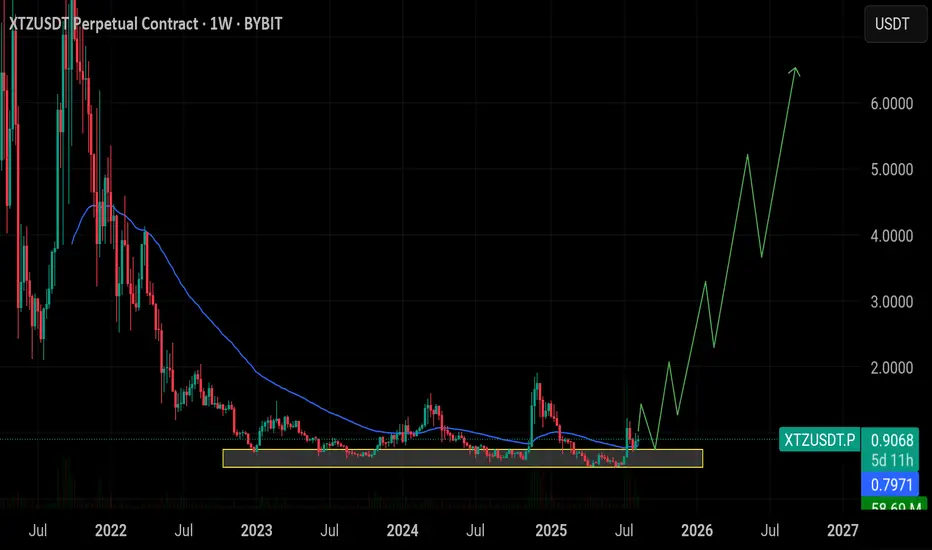
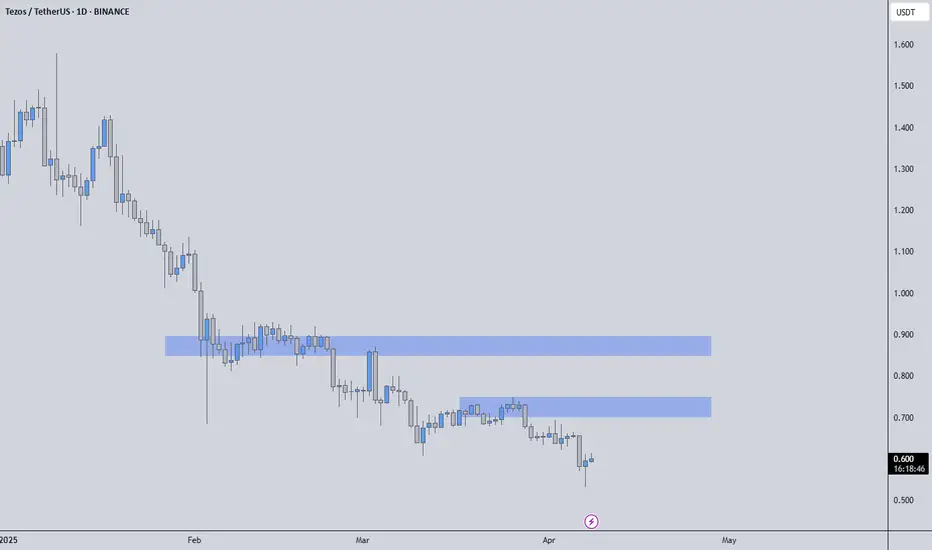
$XTZ Long-Term Accumulation AnalysisSEED_DONKEYDAN_MARKET_CAP:XTZ Long-Term Accumulation Analysis
🔸XTZ has been consolidating in a major accumulation zone between $0.50 – $0.76 for a long period, showing strong demand at lower levels. Current price is above this range, suggesting patience is needed for the bulk of entries — but partial exposure can be taken now to avoid missing upside.
🔸 Smart Entry Zone:
Primary accumulation entries remain between $0.50 – $0.76. Wait for a pullback into this range to add larger positions, but consider adding a small position at the current price to catch any early moves.
🔸 Upside Target: $6.00+
Once accumulation resolves, historical patterns point toward a potential rally to $3.00, $4.20, and eventually $6.00+.
🔸 Risk Level at $0.48:
A sustained break below $0.48 would invalidate the accumulation structure.
🔸 Outlook:
Add a light position now at 0.90 and , then wait for price to revisit the $0.50 – $0.76 zone before building the core position. Hold for long-term upside.
TezosXTZ usdt daily analysis
Time frame 4hourls
Risk rewards ratio >4
Target 1.124$
LS is very tight
If my analysis failed l will lost a few but if it reaches my target good benefit
Xtz historic supportXTZ is at a historic support level here where it has consistently respected as support or resistance after recently busting over it and on higher volume seen in a long time. I’m optimistic.
Most tied up in staking it seems ~77%, so moves could happen quickly, as seen previously.
Is #XTZ Ready For a Major Breakout or Another Trap Ahead?Yello Paradisers! Are you prepared for what might be one of the sneakiest reversals brewing quietly on #XTZUSDT? Let's see the current setup of #Tezos:
💎#XTZ is trying to break out of a descending broadening wedge formation, a setup that typically signals the end of a corrective structure and the potential beginning of a major impulsive move. We’re likely witnessing the very first wave of this new impulse, and what happens next will depend entirely on how the price reacts to the overhead dynamic resistance.
💎The 1st impulsive wave appears to be nearing completion, and based on structure and current momentum, a minor pullback is both expected and healthy. This retracement will likely serve as a reset before the next leg higher begins, offering a potential entry for those who missed the breakout. However, we do not expect this correction to break below the origin of the first wave — doing so would undermine the integrity of the new trend.
💎Currently, the #XTZUSD is facing strong resistance from the EMA, which it must convincingly break and reclaim. This EMA level has repeatedly acted as a lid on price action, and until it’s cleared, any upside move remains tentative. However, if buyers step in with real volume, we could see a rapid acceleration toward the mid-term resistance at $0.916. That level has historically marked a shift in market control. And beyond it, the next major resistance lies at $1.134, a key supply zone that could trigger heavy distribution.
💎On the downside, the structure remains clean. The $0.491 – $0.516 zone is now our major support, and it must hold. If the price falls below this support and closes with weakness, it will invalidate the current bullish thesis and likely lead to a deeper correction.
Play it safe, respect the structure, and let the market come to you!
MyCryptoParadise
iFeel the success🌴

XTZ Motive Wave
After breaking the black descending channel price made waves 1/2 and pumped to the upside for wave 3, where it was held by the blue resistance zone.
We are now in wave 4 correction, and I am waiting for reversals in smaller timeframes for long trades.

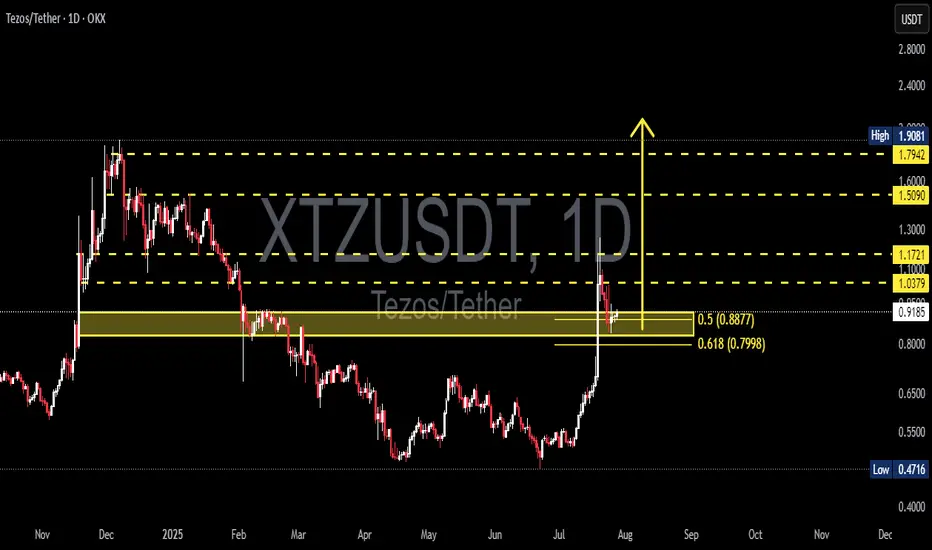
XTZUSDT Fibonacci Retest and Rebound Potential: Is Tezos Ready?Detailed Analysis of XTZ/USDT Chart (Daily Timeframe):
The XTZUSDT pair (Tezos vs USDT) has shown strong momentum following a breakout above previous support zones, with a sharp rally toward $1.17 before retracing.
Currently, the price is testing the Fibonacci Retracement levels, specifically the 0.5 ($0.8877) and 0.618 ($0.7998) zones — which also align with a key previous demand zone. This zone is critical for determining the next directional move.
---
🟢 Bullish Scenario:
If the price holds above the $0.80–$0.88 zone (Fibonacci support area), this could confirm a valid breakout retest.
Potential upside targets include:
$1.0379 (minor resistance)
$1.1721 (recent local high)
Further targets: $1.5090 – $1.7942, and potentially the major high at $1.9081.
This structure may form a bullish continuation pattern, especially if supported by volume.
---
🔴 Bearish Scenario:
A breakdown below $0.7998 may trigger further selling pressure toward $0.70 – $0.65.
A deeper retracement could take price back into the previous accumulation zone between $0.55 – $0.50.
Failure to hold the Fibonacci levels may confirm a bull trap, invalidating the recent breakout.
---
📌 Pattern Insights:
The current price action resembles a Bullish Flag / Retest Structure.
The 0.5–0.618 Fibonacci levels serve as a key confluence area for potential trend continuation.
This is a common setup before a major upside move — if the support holds.
---
Conclusion: XTZ is at a decisive moment. As long as the price stays above $0.80, the bullish trend remains intact. However, a drop below could shift momentum back to the bears. Traders should watch this zone closely for confirmation.
#XTZUSDT #Tezos #CryptoAnalysis #AltcoinSeason #FibonacciRetracement #BreakoutRetest #TechnicalAnalysis #CryptoTrading #BullishScenario #BearishScenario
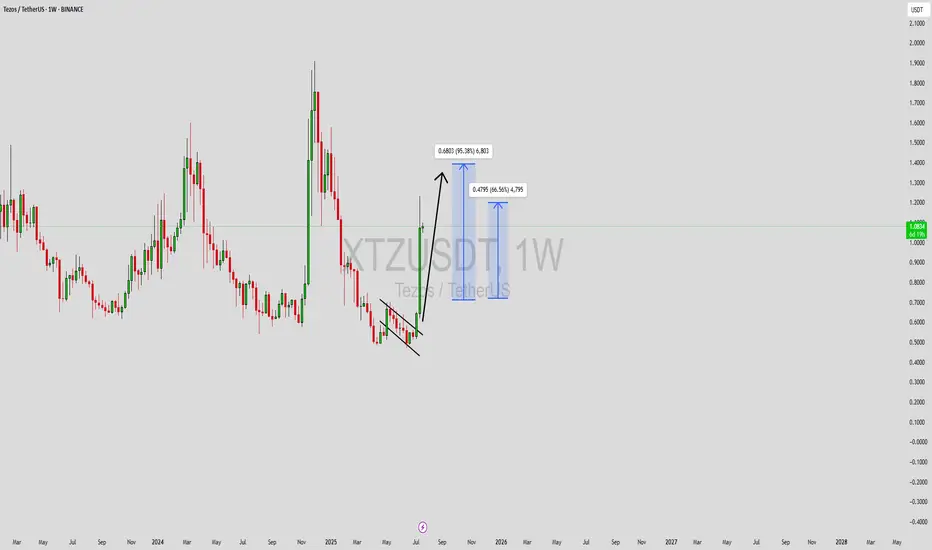
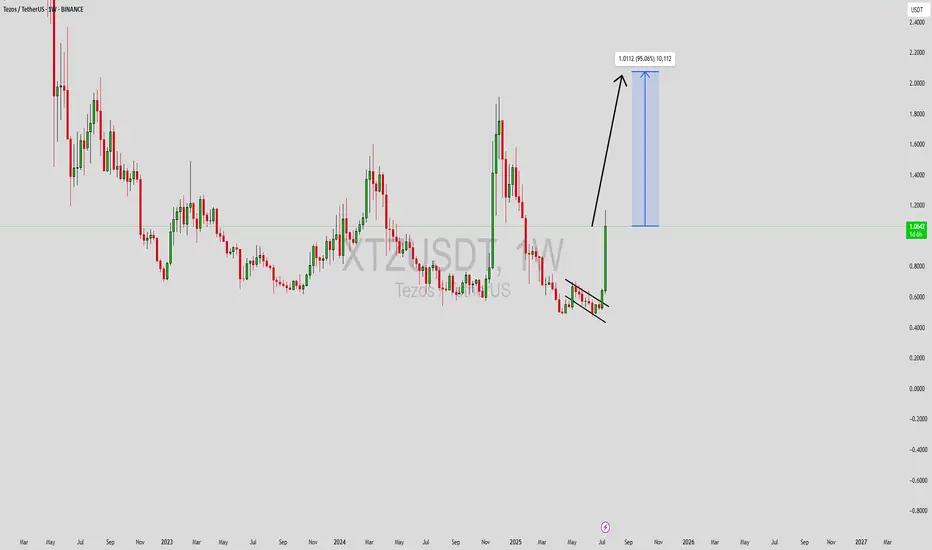
XTZUSDT Forming Falling WedgeXTZUSDT (Tezos/USDT) has recently broken out of a classic falling wedge pattern on the weekly chart, a bullish structure that often signals a strong upward reversal. After a prolonged period of consolidation and accumulation, the breakout is now supported by increasing volume, indicating renewed investor interest and possible institutional attention. Technically, the pattern breakout confirms the end of the downtrend and suggests a strong bullish impulse may follow.
The current market structure indicates a potential price rally of around 80% to 90% from the breakout level, with clear upside targets shown in the chart. The bullish candle formation following the wedge breakout is backed by a volume surge, adding further confirmation that buyers are stepping in. If this momentum continues, XTZ could challenge previous resistance levels and attract additional buyers along the way, especially swing traders looking for mid-term breakout plays.
With Tezos’ underlying technology being focused on scalable smart contracts and self-upgrading blockchain architecture, the project continues to attract attention in the decentralized finance (DeFi) and NFT sectors. As interest in fundamentally strong Layer 1 blockchains returns during market recovery phases, XTZ becomes a favorable candidate for both technical and fundamental investors alike.
✅ Show your support by hitting the like button and
✅ Leaving a comment below! (What is You opinion about this Coin)
Your feedback and engagement keep me inspired to share more insightful market analysis with you!
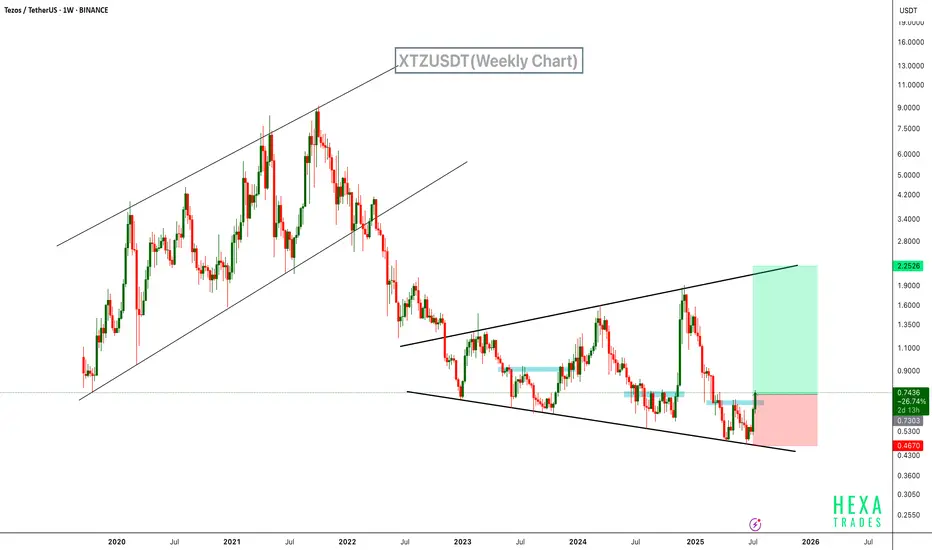
XTZ Is Waking Up – Next Stop $2.25?SEED_DONKEYDAN_MARKET_CAP:XTZ is currently bouncing from the lower boundary of a broadening wedge pattern on the weekly chart, signaling a potential trend reversal. This structure, characterized by widening price swings, has been developing since mid-2022.
The recent bullish move has pushed the price above a key resistance zone, with rising volume supporting the momentum. The upper boundary of the wedge aligns with the next major target zone near $2.25.
Resistance 1: $1.00
Resistance 2: $1.45
Resistance 3: $2.25
Cheers
Hexa
BINANCE:XTZUSDT
XTZUSDT Forming Falling WedgeXTZUSDT has recently formed a classic falling wedge pattern on the daily timeframe, a setup often associated with bullish reversals. This technical formation, marked by converging downward sloping trendlines, is showing early signs of a breakout. With volume steadily building, a breakout confirmation above resistance could signal the beginning of a major bullish rally. Historically, falling wedge breakouts result in strong upside moves, and in this case, we are looking at a potential gain of 80% to 90% in the coming weeks.
Tezos (XTZ) has consistently positioned itself as a strong contender in the smart contract and decentralized applications (dApp) sector. With its self-amending blockchain and focus on governance, it continues to attract attention from developers and institutional players alike. As the broader crypto market shows signs of recovery, coins like XTZ that offer real-world utility and technical strength tend to lead the charge.
From a market sentiment perspective, interest in XTZ has been rising across social platforms and trading communities. The combination of technical alignment and positive fundamentals suggests that bulls are preparing for a strong move. Traders should keep an eye on breakout levels and monitor volume spikes as confirmation of momentum. A successful wedge breakout could bring XTZUSDT back to previous highs or even beyond.
✅ Show your support by hitting the like button and
✅ Leaving a comment below! (What is You opinion about this Coin)
Your feedback and engagement keep me inspired to share more insightful market analysis with you!
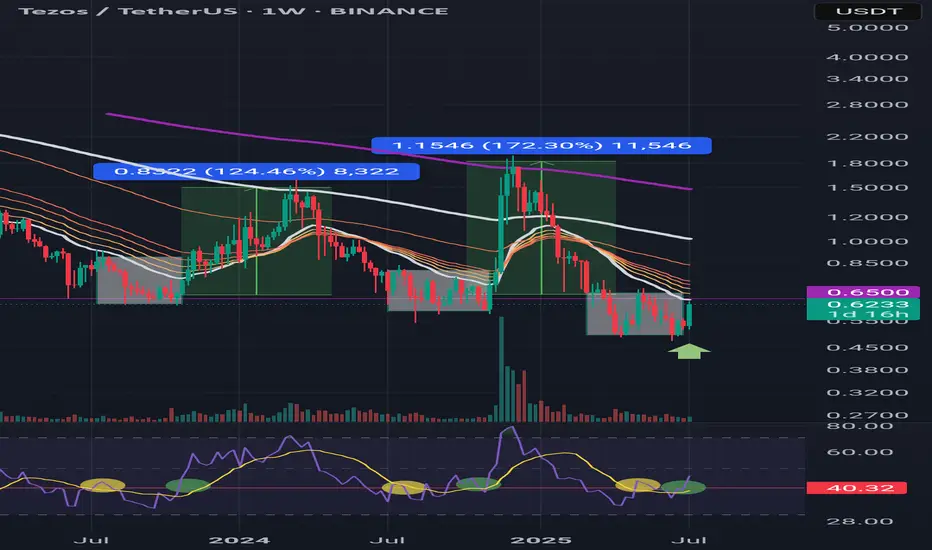
XTZ Coiling UpWeekly rsi40 claiming seems inevitable.
If pricr can brake 65 I expect a nice weeks of a rally
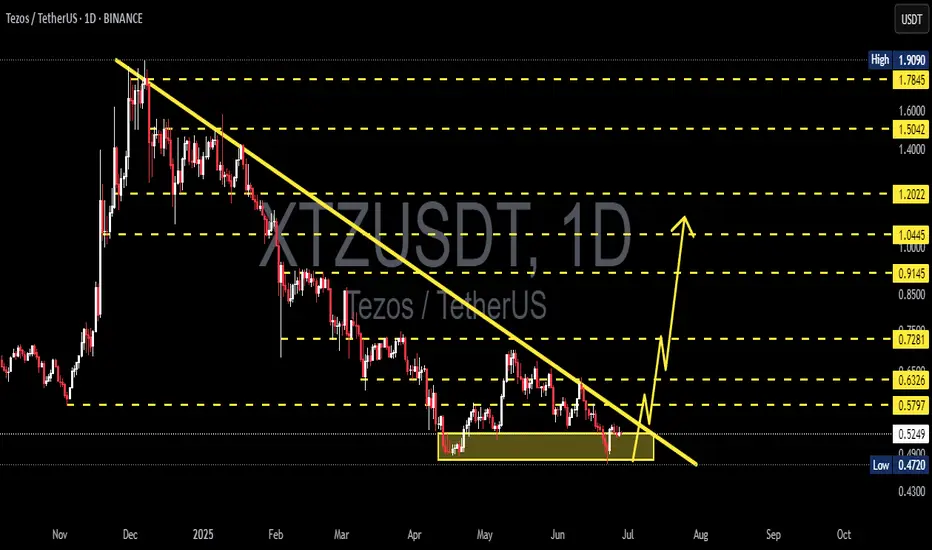
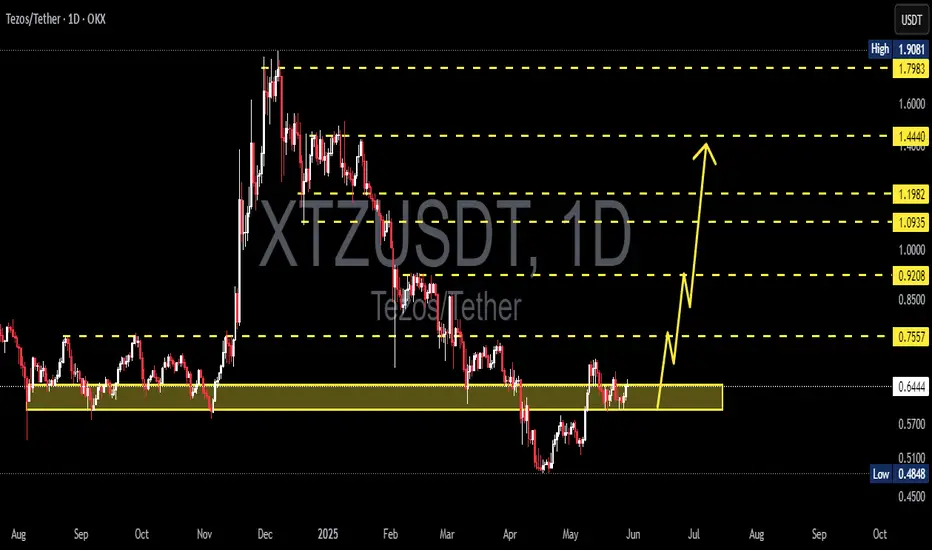
XTZ/USDT Ready for a Massive Breakout After Prolonged Downtrend!Technical Analysis (1D Timeframe):
The XTZ/USDT pair is forming a well-defined descending triangle pattern, with sustained selling pressure since late 2024. However, the price action is now signaling a potential breakout as it approaches the apex of the triangle, supported by a strong accumulation zone around $0.4720–$0.5247.
🔍 Analysis Details:
Descending Trendline Resistance: Price has repeatedly failed to break above the descending resistance line since December 2024. It is now testing the edge of the triangle, which typically precedes a significant breakout.
Strong Support Zone: The consolidation zone between $0.4720 and $0.5247 has acted as a key accumulation area, successfully holding off bearish momentum.
Potential Breakout: A breakout above the triangle resistance, especially with confirmation above $0.5797, could trigger a strong bullish rally toward the next resistance levels.
🎯 Target Resistances (Upon Confirmed Breakout):
1. $0.5797 – Initial breakout confirmation
2. $0.6326 – Minor resistance
3. $0.7281 – Significant resistance from previous structure
4. $0.9145 – Medium-term bullish target
5. $1.0445 – Strong resistance zone
6. $1.2022 – Final breakout target
⚠️ Note:
A valid breakout requires a daily candle close above the descending trendline, ideally supported by volume confirmation. A pullback to the breakout zone may occur and could offer a second entry opportunity.
#XTZ #Tezos #XTZUSDT #CryptoBreakout #DescendingTriangle #AltcoinAnalysis #TechnicalAnalysis #CryptoSignals #TrendReversal #BullishSetup
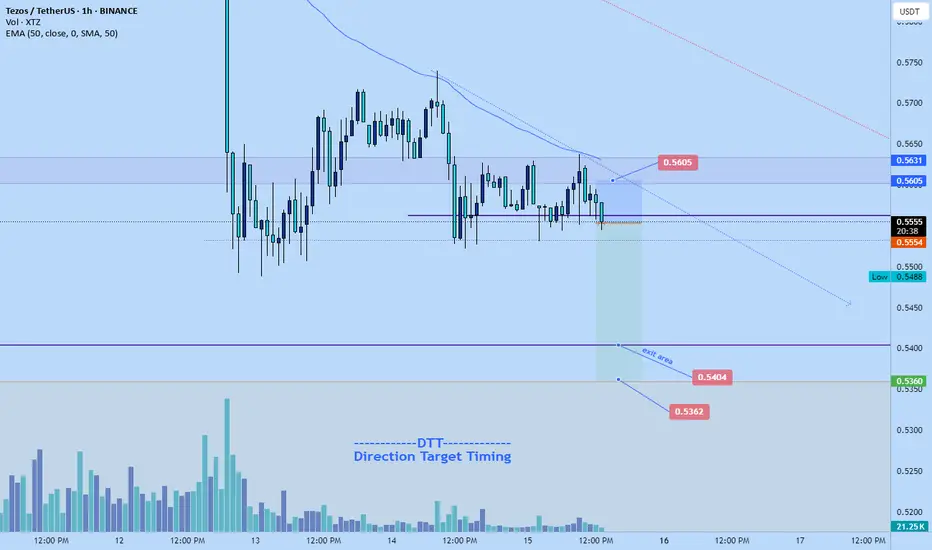
Tezos short to $0.5362Stop: $0.5605
Tp: $0.54-0.5362
3.8RR
DTT setup
Market looks likely to fall lower before continuation back to the upside
XTZ/USDT A Pattern of Strength in Market Weakness📍 The chart is forming a Livermore-style expanding wedge —
a structure where each price swing grows wider, and volatility increases.
📌 The current zone may be a key turning point for the trend.

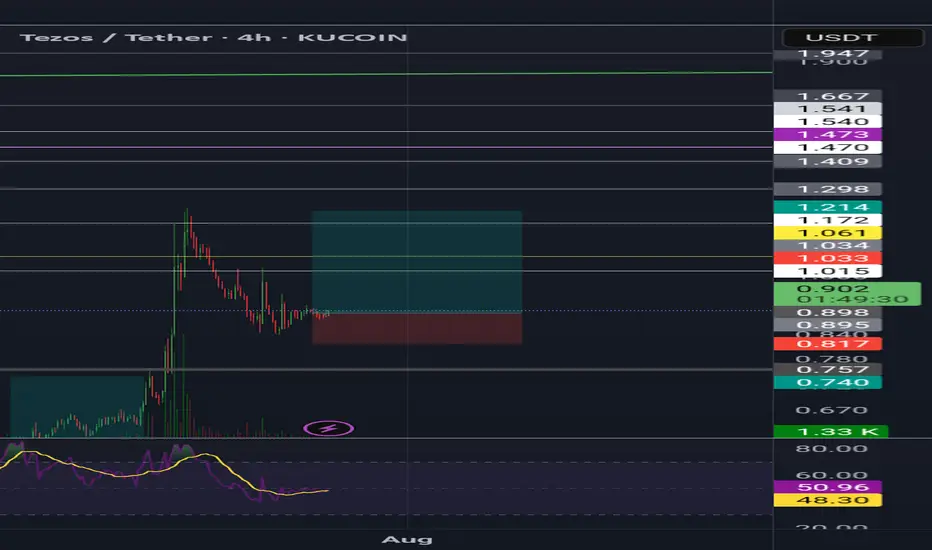
XTZUSDT | Key Resistance Zones IdentifiedXTZUSDT is currently testing critical resistance areas—specifically, the blue boxes are proving to be strong resistance levels. This isn’t happenstance; these zones have been carefully identified and have historically served as barriers where sellers dominate.
Key Observations
• Strong Resistance: The blue boxes are acting as a robust resistance area where price has repeatedly struggled to break through.
• Confirmation is Critical: I always wait for clear lower time frame breakdowns and supporting CDV signals before taking any action. In trading, no move is taken based solely on potential—it must be proven by the market's behavior.
How to Approach the Trade
• Short Setup: Should price be rejected at these blue box levels with corresponding signs of downward pressure on the lower time frames, I will target short entries. Remember, my approach is never impulsive—confirmation is paramount.
• Long Setup Adaptation: Conversely, if price unexpectedly breaks above these strong resistance levels accompanied by significant volume and retests as support, I will reassess and potentially switch my bias to long. I never insist on a short idea; I trade based on market validation.
Why Follow My Analysis?
I operate with an extremely high success rate because I rely on data-driven methods and a disciplined strategy. Every level I mark has been carefully selected through advanced market analysis techniques that most traders overlook. My professional approach has been honed over years of experience, and my track record speaks for itself. If you want to trade smarter and avoid costly mistakes, it’s vital to follow these proven strategies closely.
Stay disciplined, wait for the right confirmations, and let the market’s true signals guide your trades. Follow my analysis—real, professional insights that consistently deliver results.
📌I keep my charts clean and simple because I believe clarity leads to better decisions.
📌My approach is built on years of experience and a solid track record. I don’t claim to know it all but I’m confident in my ability to spot high-probability setups.
📌If you would like to learn how to use the heatmap, cumulative volume delta and volume footprint techniques that I use below to determine very accurate demand regions, you can send me a private message. I help anyone who wants it completely free of charge.
🔑I have a long list of my proven technique below:
🎯 ZENUSDT.P: Patience & Profitability | %230 Reaction from the Sniper Entry
🐶 DOGEUSDT.P: Next Move
🎨 RENDERUSDT.P: Opportunity of the Month
💎 ETHUSDT.P: Where to Retrace
🟢 BNBUSDT.P: Potential Surge
📊 BTC Dominance: Reaction Zone
🌊 WAVESUSDT.P: Demand Zone Potential
🟣 UNIUSDT.P: Long-Term Trade
🔵 XRPUSDT.P: Entry Zones
🔗 LINKUSDT.P: Follow The River
📈 BTCUSDT.P: Two Key Demand Zones
🟩 POLUSDT: Bullish Momentum
🌟 PENDLEUSDT.P: Where Opportunity Meets Precision
🔥 BTCUSDT.P: Liquidation of Highly Leveraged Longs
🌊 SOLUSDT.P: SOL's Dip - Your Opportunity
🐸 1000PEPEUSDT.P: Prime Bounce Zone Unlocked
🚀 ETHUSDT.P: Set to Explode - Don't Miss This Game Changer
🤖 IQUSDT: Smart Plan
⚡️ PONDUSDT: A Trade Not Taken Is Better Than a Losing One
💼 STMXUSDT: 2 Buying Areas
🐢 TURBOUSDT: Buy Zones and Buyer Presence
🌍 ICPUSDT.P: Massive Upside Potential | Check the Trade Update For Seeing Results
🟠 IDEXUSDT: Spot Buy Area | %26 Profit if You Trade with MSB
📌 USUALUSDT: Buyers Are Active + %70 Profit in Total
🌟 FORTHUSDT: Sniper Entry +%26 Reaction
🐳 QKCUSDT: Sniper Entry +%57 Reaction
📊 BTC.D: Retest of Key Area Highly Likely
📊 XNOUSDT %80 Reaction with a Simple Blue Box!
📊 BELUSDT Amazing %120 Reaction!
I stopped adding to the list because it's kinda tiring to add 5-10 charts in every move but you can check my profile and see that it goes on..
XTZUSDT 1D AnalysisXTZ ~ 1D Analysis
#XTZ Buy gradually from here if you still have confidence in this coin with a short term target of at least 10%+ and long term $2+
tezos short to $0.5859Just now opened a short trade on tezos. Targeting $0.5859
Anticipating a big sell off soon . If am correct the potential bottom should be around prior weekly resistance at $0.586 area.
Stop: $0.6384 or higher
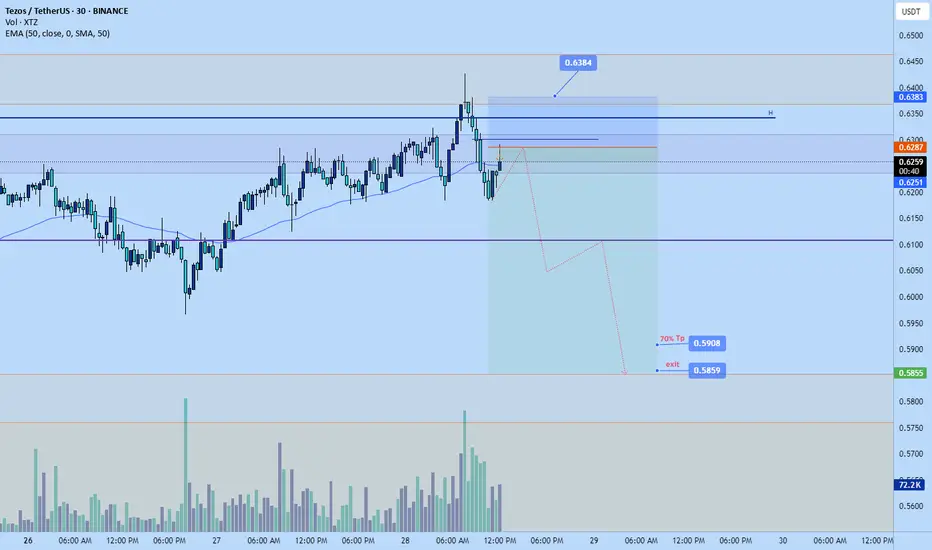
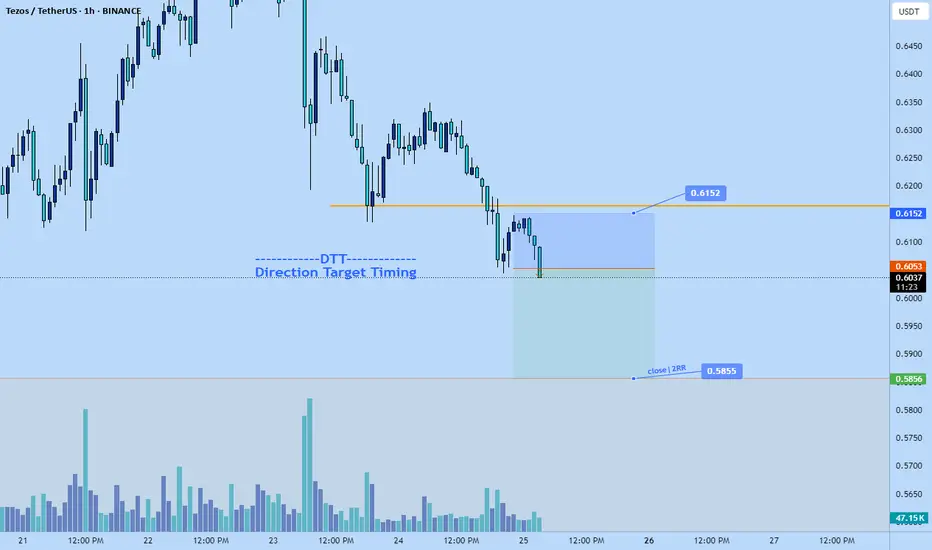
Tezos short to $0.5855Just now opened a short position on tezos. The market looks likely to continue its downtrend. Likely towards $0.5855 potential demand zone.
Stop: $0.6152
target: $0.5855
Roughly 2RR
Time sensitive
Be careful with XTZ !!!So if you pay attention to the XTZ chart you can see that the price has formed a Ascending FLAG or wedge which means it is expected to price move as equal as the measured price movement.( AB=CD )
NOTE: wait for break of the FLAG .
Give me some energy !!
✨We spend hours finding potential opportunities and writing useful ideas, we would be happy if you support us.
Best regards CobraVanguard.💚
_ _ _ _ __ _ _ _ _ _ _ _ _ _ _ _ _ _ _ _ _ _ _ _ _ _ _ _ _ _ _ _
✅Thank you, and for more ideas, hit ❤️Like❤️ and 🌟Follow🌟!
⚠️Things can change...
The markets are always changing and even with all these signals, the market changes tend to be strong and fast!!

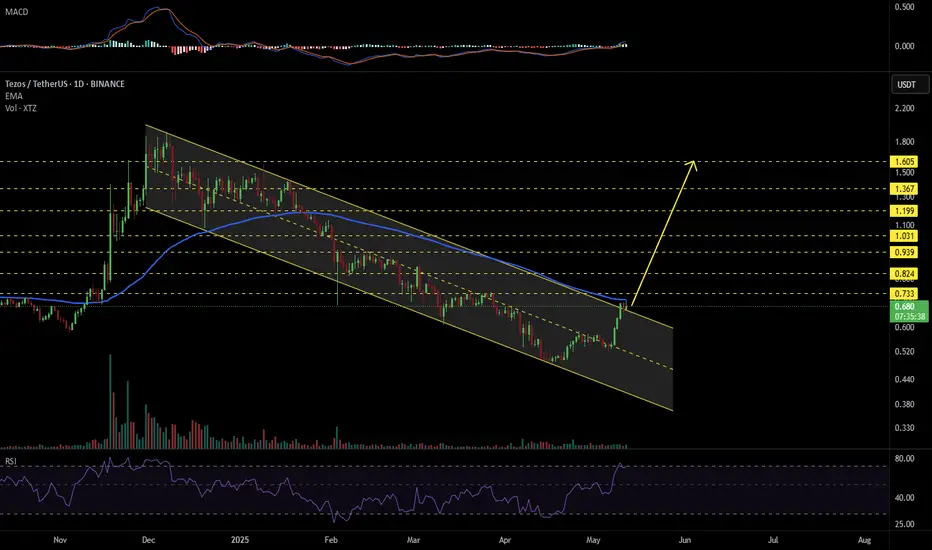
XTZUSDT 1D#XTZ has broken above the descending channel on the daily chart but was rejected at the daily EMA100. In case of a successful retest of the channel and a breakout above the EMA100, the targets are:
🎯 $0.733
🎯 $0.824
🎯 $0.939
🎯 $1.031
🎯 $1.199
🎯 $1.367
🎯 $1.605
⚠️ Use a tight stop-loss.
XTZ/USD Main trend. Downward channelLogarithm. Time frame 1 week. Main trend.
Idea for understanding the local work zone for traders in the main trend. It will also be useful for investors to understand the cheap/expensive zones for investing.
Linear price chart.
Secondary trend. Downward channel. Area to work. Time frame 3 days.
XTZ/USD Secondary trend. Downward channel.
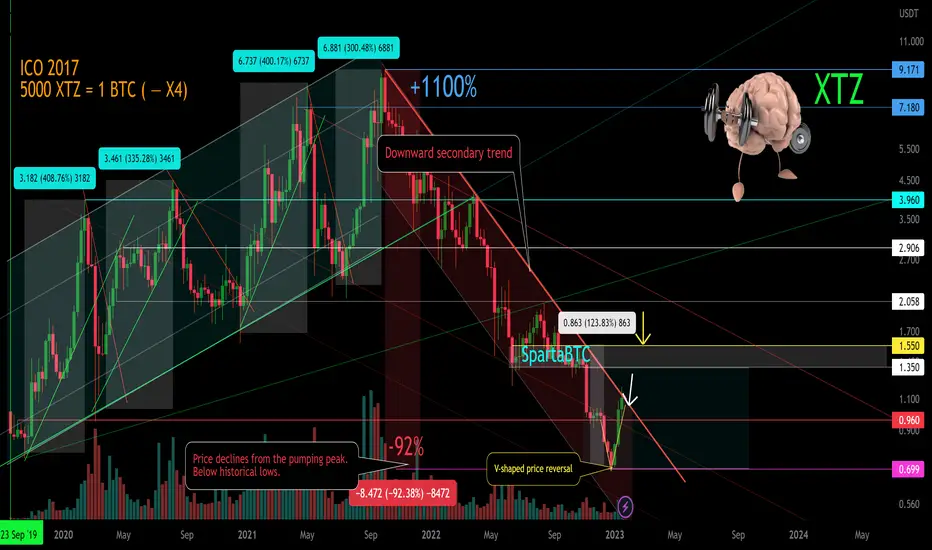
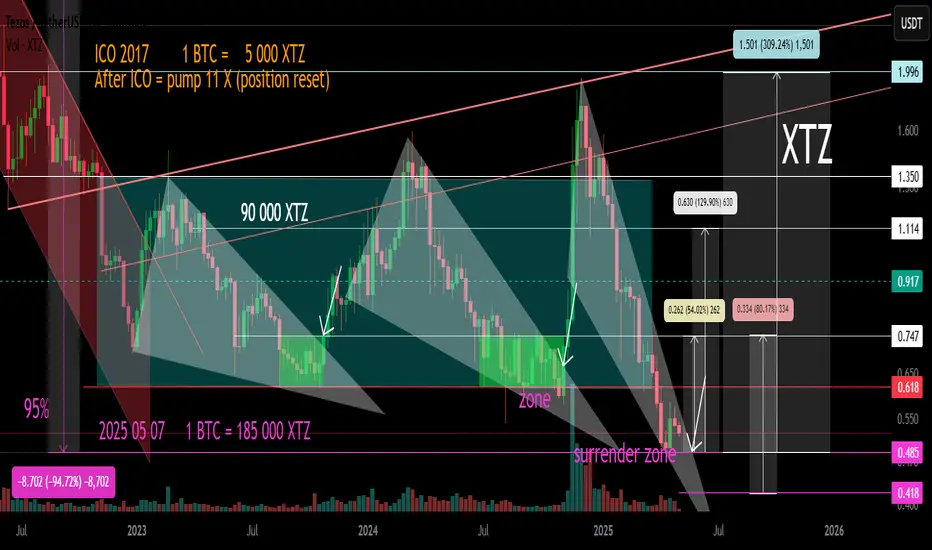
XTZ Secondary Trend. Channel. Wedge. Capitulation Zone. 07 05 20Logarithm. Time frame 1 week (less is not necessary).
The secondary trend has formed a horizontal channel for several years, with repeating wedge-shaped formations, the third time we entered under the support of this channel not by squeezes to collect long stop-loss, but by full candles and the structure of a descending wedge. It looks more vertical. The corrective movement to this semi-vertical wedge, quite possibly, will similarly have an aggressive character. The wedge is almost in the final phase of its formation. I showed percentages for clarity to the key reversal zones, for orientation for your money management and setting the first medium-term, and possibly local targets.
The main trend of this previously hyped cryptocurrency since 2017
XTZ/USD Main Trend. Descending Channel 01 2023