XVG Bullish Momentum Alert: Buy for Maximum GainsXVG Coin: Short Fundamentals, Recent News, and Disclaimer
Fundamentals:
Name: Verge (XVG)
Launch Date: January 2014
Purpose: Aims to be a privacy-focused cryptocurrency with faster transaction times.
Technology: Uses a combination of public and private blockchains for anonymity.
Recent News:
Limited mainstream adoption: While XVG gained some traction in early 2018, it hasn't seen significant growth or adoption in recent years.
Development activity appears slow: There's a lack of recent news or updates regarding project development.
Disclaimer:
Lower liquidity: XVG may have lower trading volume compared to more established coins, making it potentially more volatile.
Uncertainty about future: The lack of recent development activity creates uncertainty about XVG's future potential.
Do your own research: Carefully evaluate XVG's purpose, technology, and development team before investing.
Additional Notes:
Privacy focus: Privacy-focused cryptocurrencies face increasing regulatory scrutiny. Consider the potential impact of regulations on XVG's future.
Alternatives available: Several other privacy-focused cryptocurrencies with larger communities and active development exist.
Recommendations:
If you're interested in XVG, research its whitepaper and roadmap to understand its goals and development plans.
Compare XVG to other privacy-focused cryptocurrencies before making an investment decision.
Consider investing in more established cryptocurrencies with a proven track record if you're new to the market.
Disclaimer:
This information is for educational purposes only and should not be considered financial advice.
Cryptocurrency investments are highly volatile and carry significant risks.
Do your own research before making any investment decisions.
XVGUSDT trade ideas
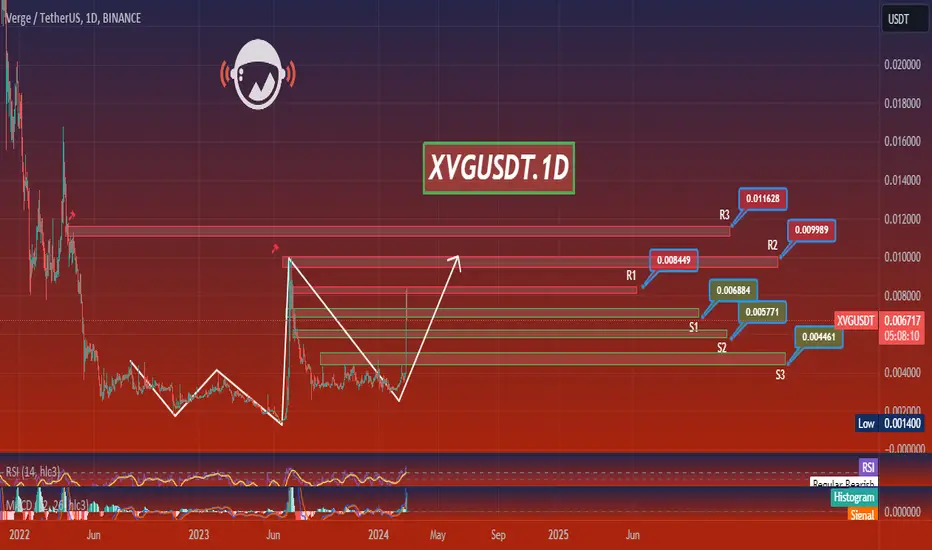
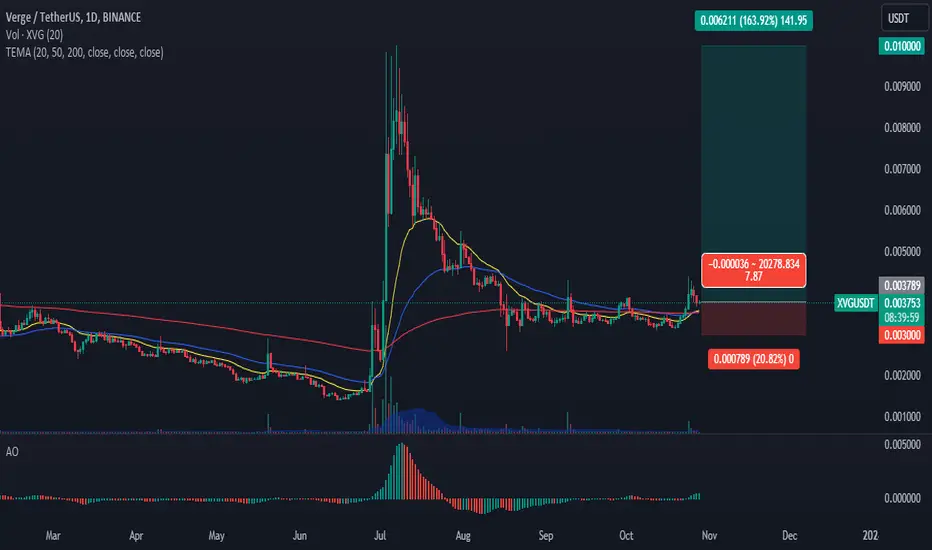
XVGUSDT.1DBased on the provided market data, the XVG is currently trading at 0.0069 USDT. The 4-hour indicators suggest a bullish trend, with the Relative Strength Index (RSI) at 75.33, which is above the typically overbought level of 70. This could indicate that the market is currently overbought, and a price correction might be imminent. The Moving Average Convergence Divergence (MACD) is also positive, suggesting a bullish momentum.
The daily indicators show a similar trend, with an RSI of 91.92, which is significantly overbought, and a positive MACD. The 7-day indicators, however, show a slightly less bullish trend, with an RSI of 76.31 and a smaller MACD.
The current price is below the 4-hour, daily, and 7-day Bollinger Bands upper limit, indicating that the market is not overextended. The fact that the current price is closer to the resistance levels than the support levels suggests a bullish sentiment in the market.
However, it's important to note that the RSI is significantly overbought on both 4-hour and daily timeframes, and near the overbought level on a 7-day timeframe. This could suggest that the market is due for a correction, and the price may fall to closer to the support levels in the near future.
In conclusion, while the market is showing a strong bullish trend, the overbought RSI levels suggest that a price correction may be imminent. It's important to watch the market closely for any signs of a reversal. As always, it's crucial to use this analysis alongside your own research and consider other factors such as news events and market sentiment before making any trading decisions.
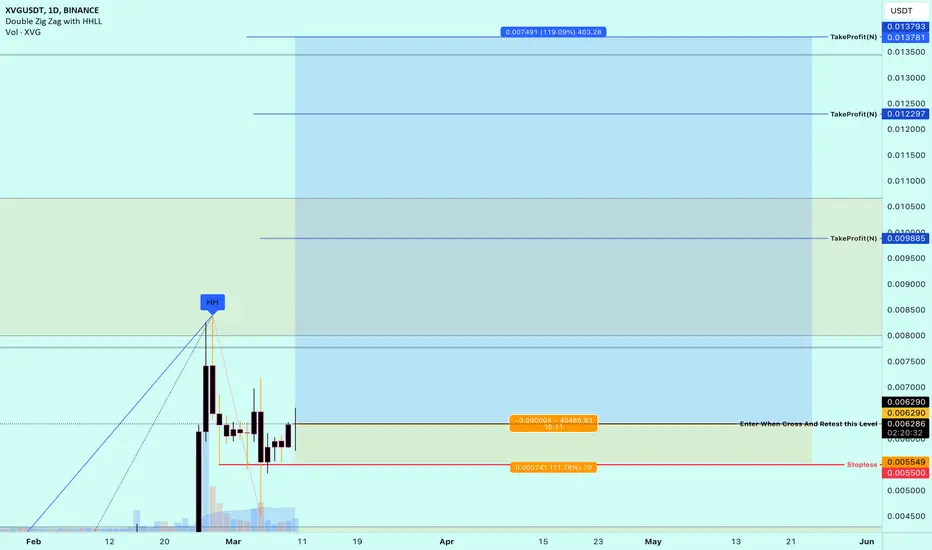
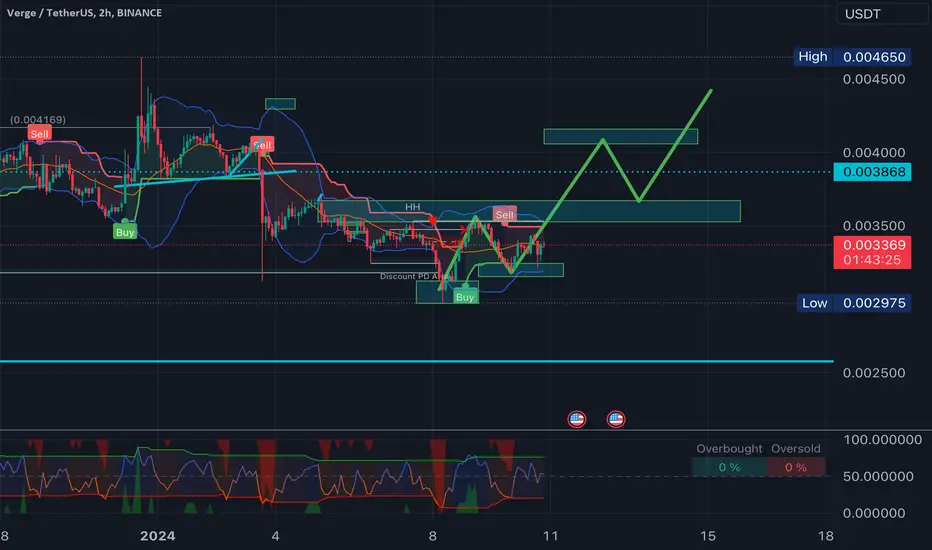
#XVGAfter suffering for a while in the specified range, now, if the 38 pullback range hits, a bullish pump can continue to the specified area, otherwise it will break the trading floor of the range.

xvgusdtOne of the crypto-currencies in which a terrible energy has accumulated seems to be this
If the behind-the-scenes team shows more transparency, it will attract capital
We will be in it a lot
Only God knows when the price will be released, but you will see the positive evidence yourself during this time
With capital management, it is definitely one of the currencies that is worth keeping
I am sharing my mid-term road map with you
XVG / XVGUSDTGood Luck >>
• Warning •
Any deal I share does not mean that I am forcing you to enter into it, you enter in with your full risk, because I'll not gain any profits with you in the end.
The risk management of the position must comply with the stop loss.
(I am not sharing financial or investment advice, you should do your own research for your money.)
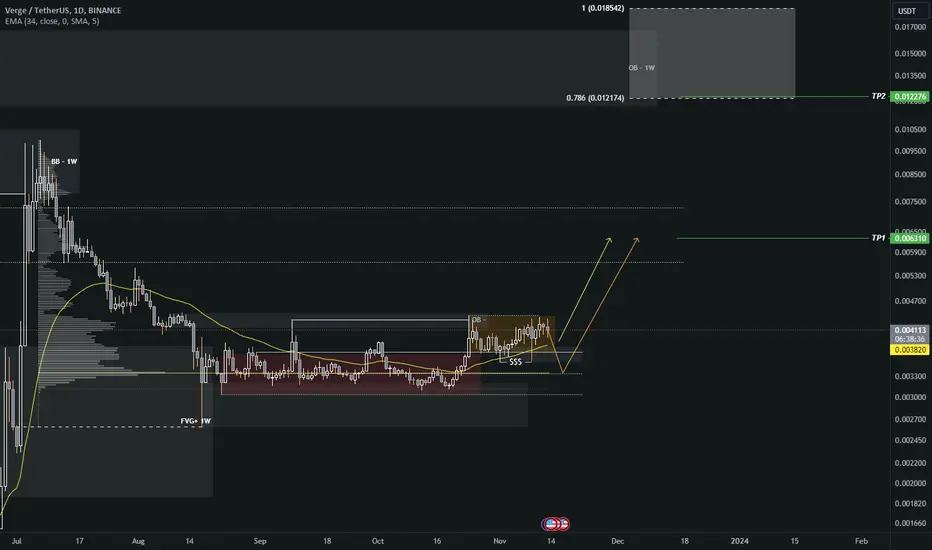
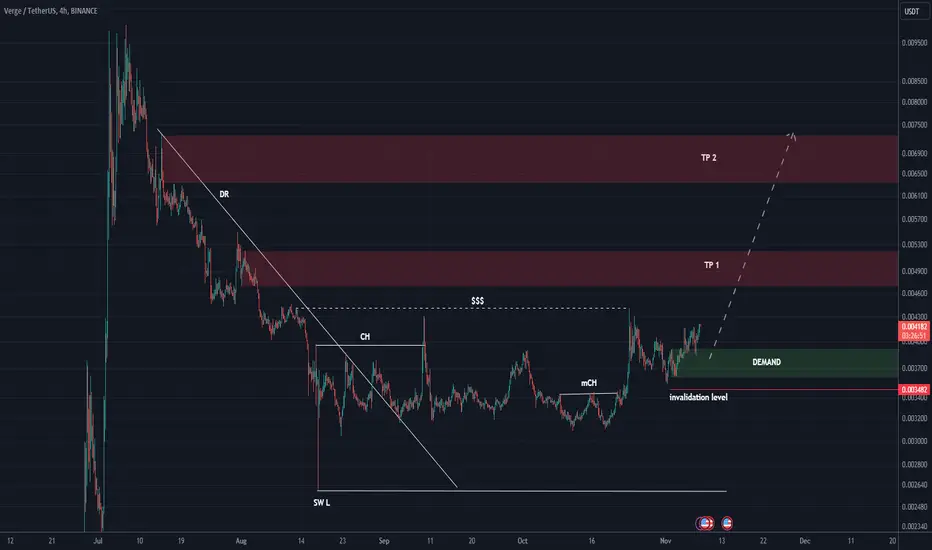
XVG ANAALYSIS (12H)XVG seems to have entered a correction from where we wrote "start" on the chart. Now the G wave, which is the last diametric wave, has ended and seems to have entered the bullish wave.
By maintaining the green range, it can move towards the targets.
Closing a daily candle below the invalidation level will violate the analysis
For risk management, please don't forget stop loss and capital management
When we reach the first target, save some profit and then change the stop to entry
Comment if you have any questions
Thank You

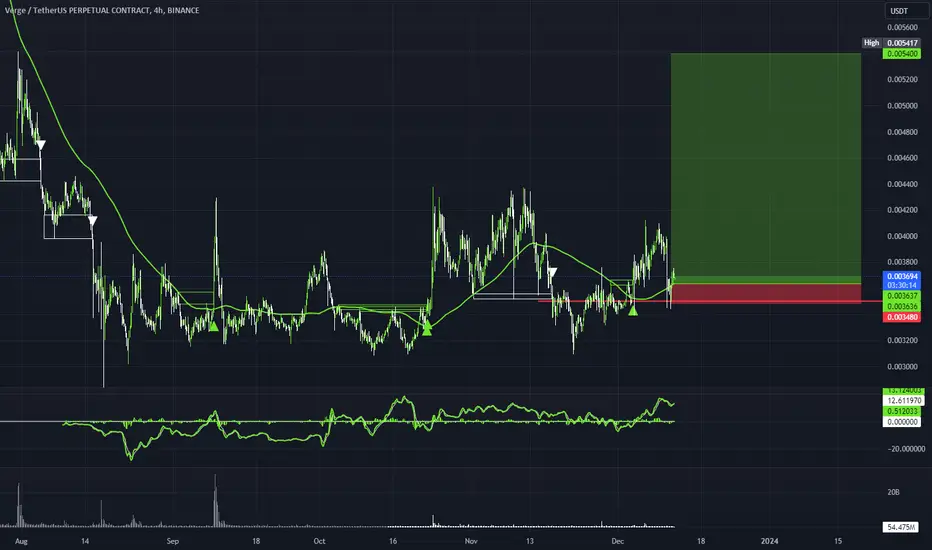
XVGUSDT - LONG SETUPXVGUSDT has given the clean breakout of long term consolidation. if this breakout holds the next upside targets will be 0.006922 followed by 0.009450
XVG long tradeits good opportunity for long position , if price breakout the 0.004358 level and trade above will target
0.009500 level
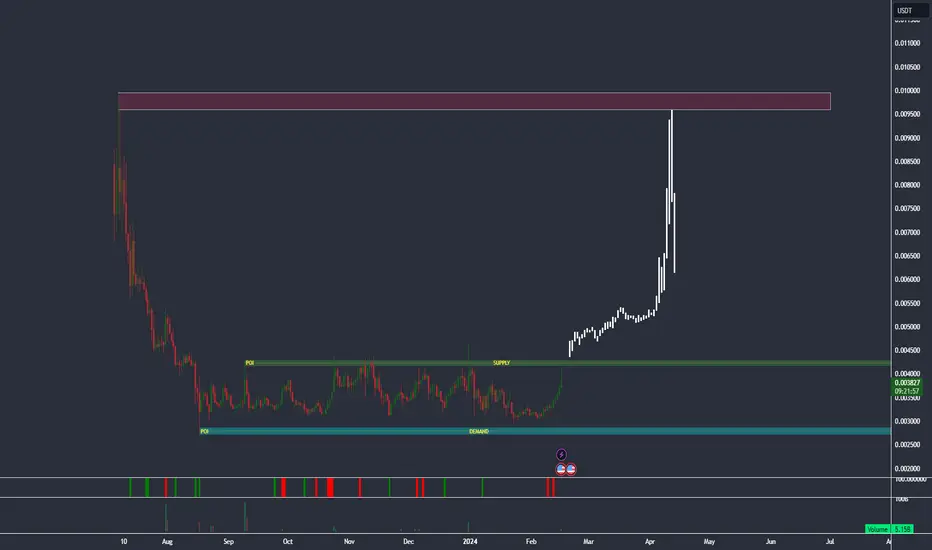
XVGUSDT (LONG) High Probability Swing Trade XVG has been in demand zone for a quite long time!
It break it's initial Demand area after the distribution it bullish retest on that floor now we are expecting to touch the current zone resistance.
It may or may not take time to get there.
This trade is not for intraday trader but for swing traders.
Long from Day level, accumulation before level, free zone afterLong from Day level, accumulation before level, free zone after

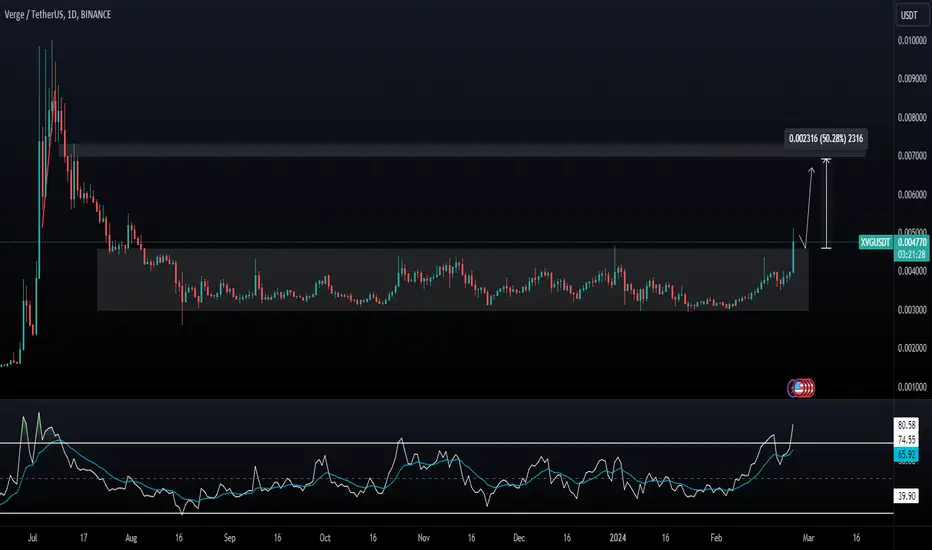
XVG long ⬆️There are some indications of long, this is will be soo high but I afraid after reach 0.0047 it drop down to 0.28
XVGUSDT.P Don't Miss $XVG1-Apply your own risk management.
2-Daily and Weekly Targets
3-Hunt the profits at any level you see convenient for you.
4-Raise Your SL any time the price moves up or down to protect your profits
5-Use 7 % Spot
6-Long it With 7 % LEV5
SGX:XVG to not be missed
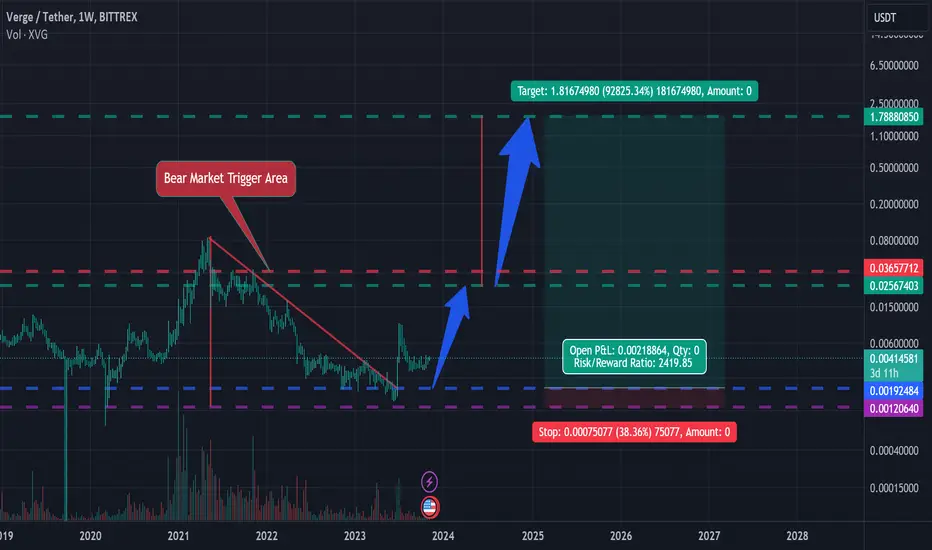
XVG showing a very impressive investment opportunityHi Everyone;
today we have one of the best risk to reward Investment opportunity
it is more than 2400 times the risk and the chart is look very promising.
I expect breaking the previous bear market key point will clear the way to the final target
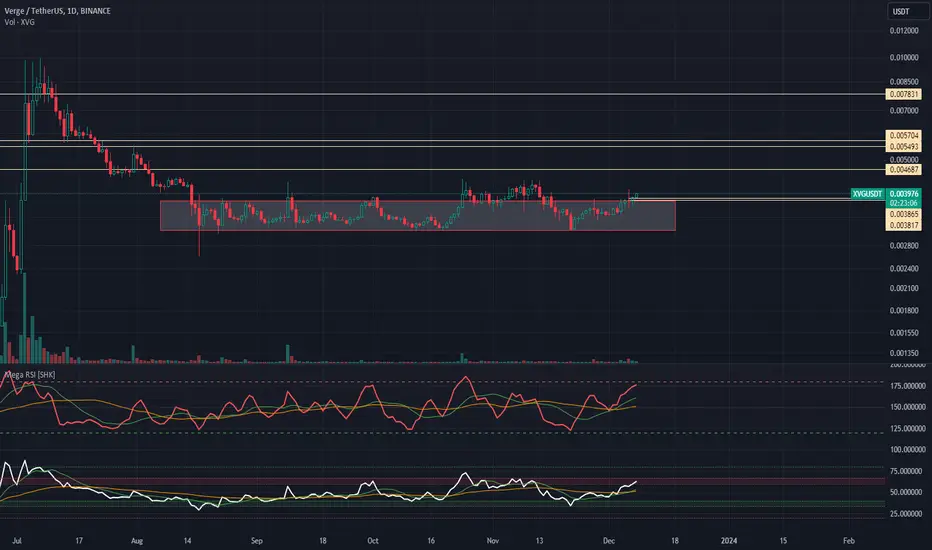
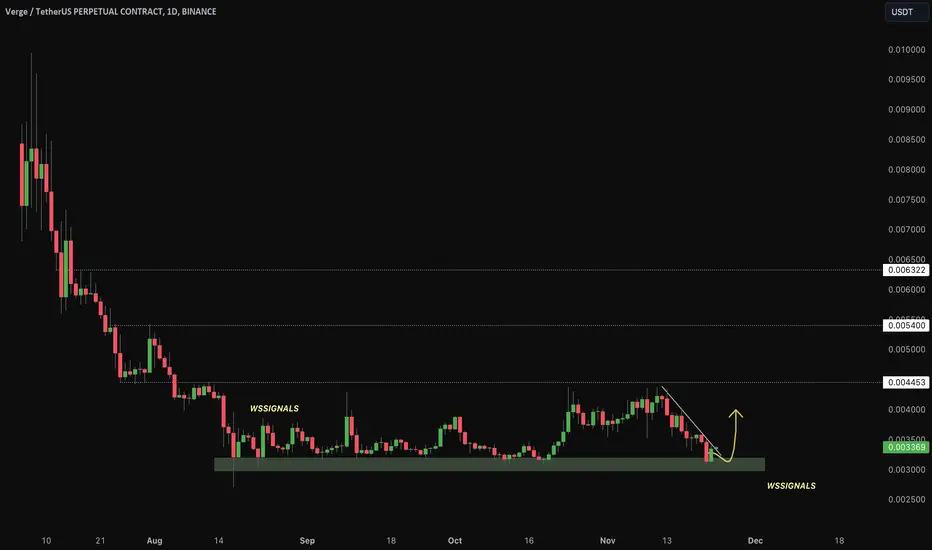
XVG/USDT lets see what will happen for it!XVG/USDT on daily time frame
it shows breaking the range box...
im set my order on0.003859
I thing it can see up to tp1 0.0043 tp2 0.0054 tp3 0.0065
be aware of entry price and dont set heavy leverages
market is on high risk .
its not a signal for buy or sell orders ,its just an idea .
please search yourself and share your minds with me.
wish you health and happiness love you everybody.
(from Mojax)

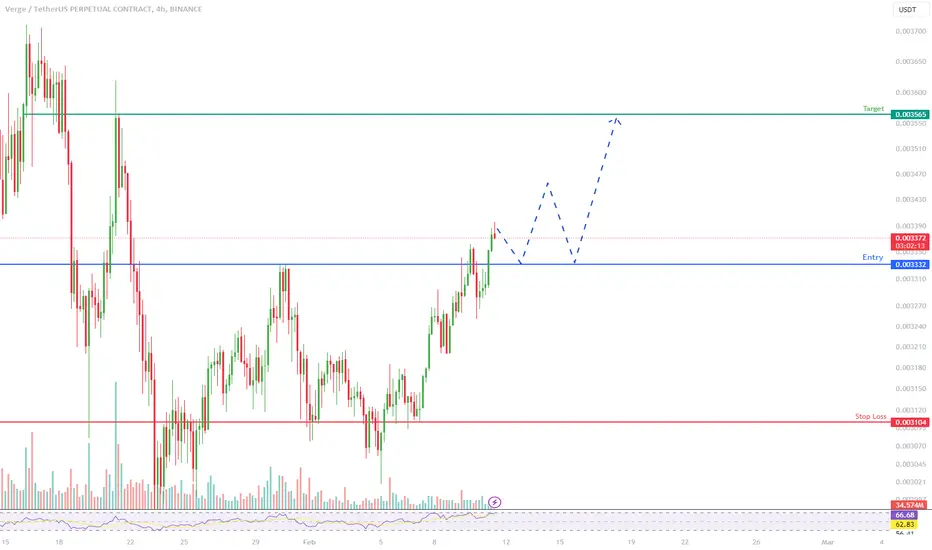
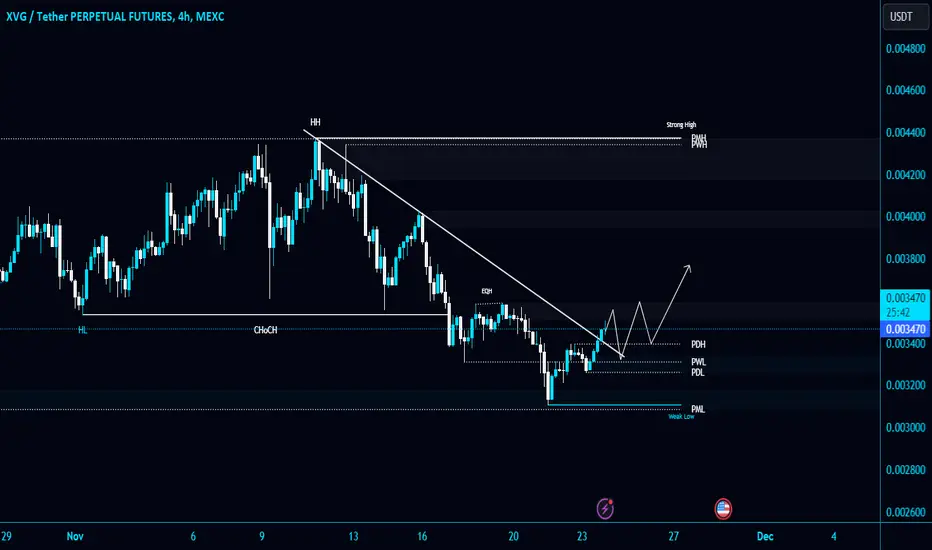
#XVG/USDT breaks the Diagonal Trendline in 4-Hour TF!#XVG/USDT breaks the Diagonal Trendline in 4-Hour TF!
Wait for successful retest to open a long position in $XVG. The major support level is PWL $0.00331. The local resistance level of #XVGUSDT is PMH $0.00437.
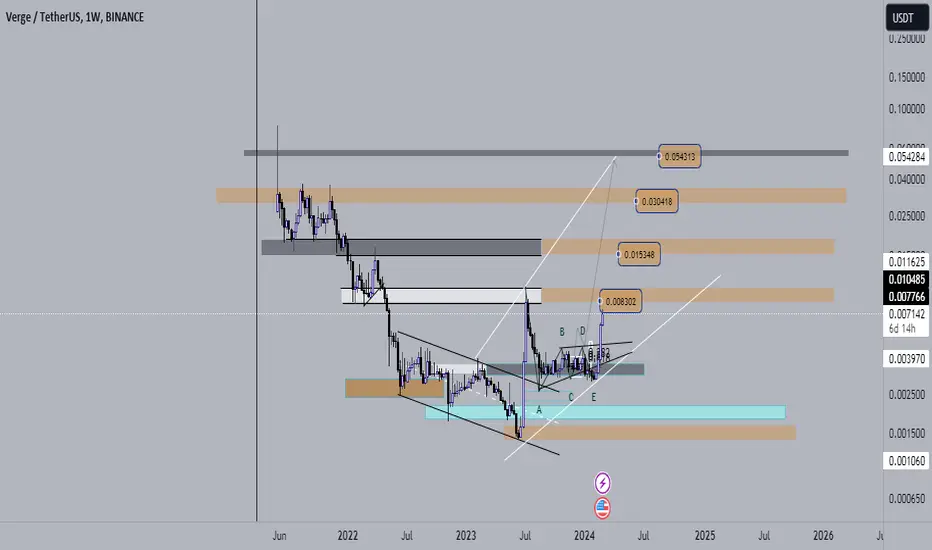
Can XVG grow?Verge (XVG) is one of the newest coins which I started to follow and invest in. This is trade (investment) setup on larger timeframe. I am not looking to reach targets 2,3,4 and 5 very soon, that could be year(s). I will sell most of my capital on targets 2,3 and 4. Small portion will be sold on Target 1 and 5.
Entry Zone: 0.0441 – 0.0742
Target 1: 0.0137 – 0.0148 (355%)
Target 2: 0.029 – 0.03 (875%)
Target 3: 0.05 – 0.06 (1837%)
Target 4: 0.1 – 0.11 (3203%)
Target 5: 0.13 – 0.14 (4199%)


XVG ANALYSIS (4H TF)Note: This symbol is risky, it has a small volume and its fluctuations are high, be careful.
This symbol has a bullish price action structure, it can move towards TPs by maintaining the green zone
For risk management, please don't forget stop loss and capital management
Comment if you have any questions
Thank You
XVG/USDTSGX:XVG set alert at green line, after accumulation comes a nice breakout, trade that breakout friends

XVG - Fomo with rebranding?#VergeFam, are you ready to witness history in the making? 👀
Only 25,000 SGX:XVG left, and then there will be no more new coins!
This is just the beginning of the future for #VergeCurrency!
BUY&HOLD = WIN