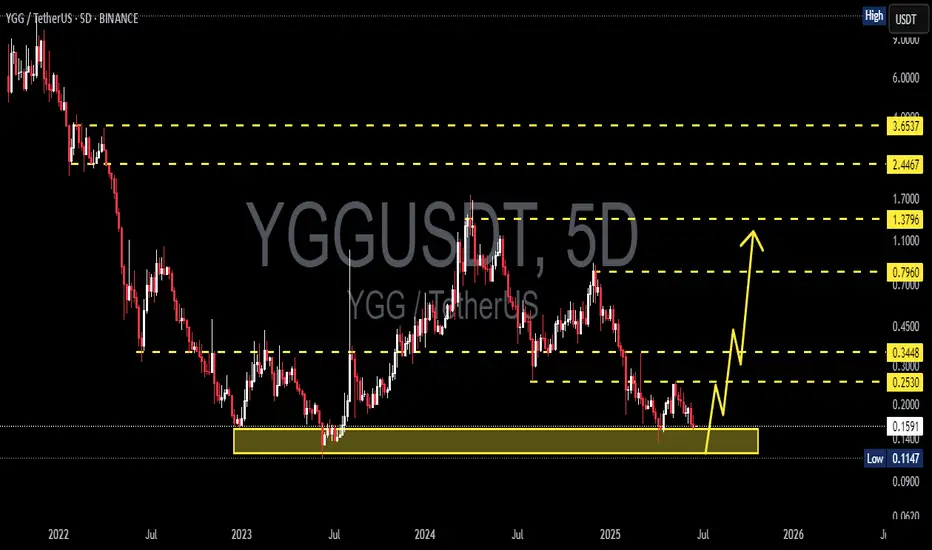
YGGUSDT 5D AnalysisYGG ~ 5D Analysis
#YGG This is the lowest support for now. Buy if you still have faith in this coin with a short term target of at least 15%+ from here.
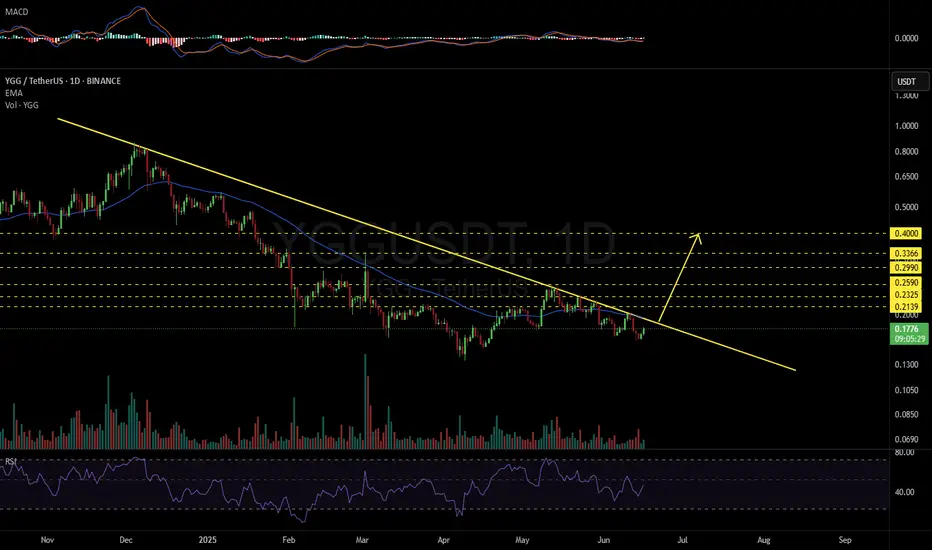
YGGUSDT 1D#YGG — Breakout Watch 👀
#YGG is heading toward the descending resistance and the EMA50 on the daily chart.
If it manages to break above both, a bullish move could follow.
Potential targets:
🎯 $0.2139
🎯 $0.2325
🎯 $0.2590
🎯 $0.2990
🎯 $0.3366
🎯 $0.4000
⚠️ Always use a tight stop-loss to manage risk
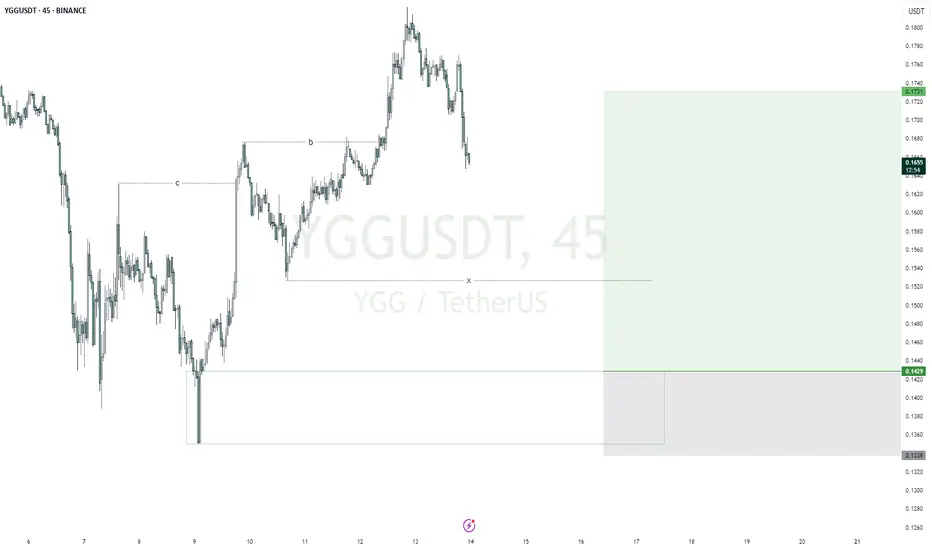
YGGUSDTmy entry on this trade idea is taken from a point of interest below an inducement (X).. I extended my stoploss area to cover for the whole swing as price can target the liquidity there before going as I anticipate.. just a trade idea, not financial advise
Entry; $0.1429
Take Profit; $0.1731
Stop
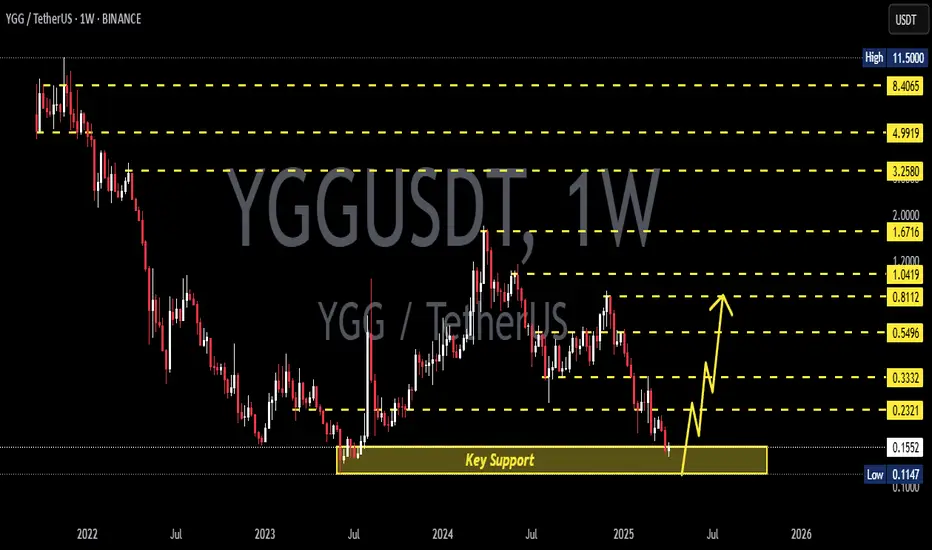
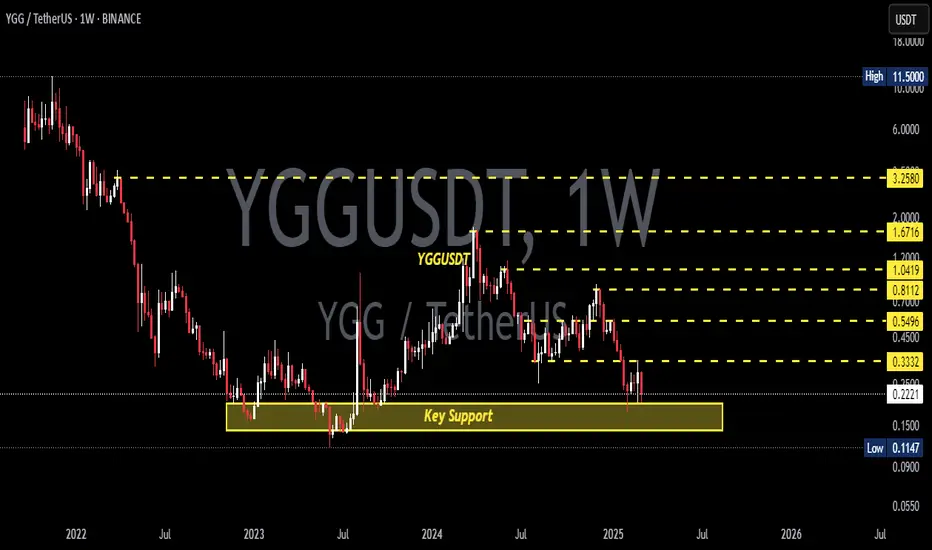
YGGUSDT 1WYGG ~ 1W Analysis
#YGG This is the lowest support that you might be able to consider to start buying back from here with a short -term target of at least 15%+.
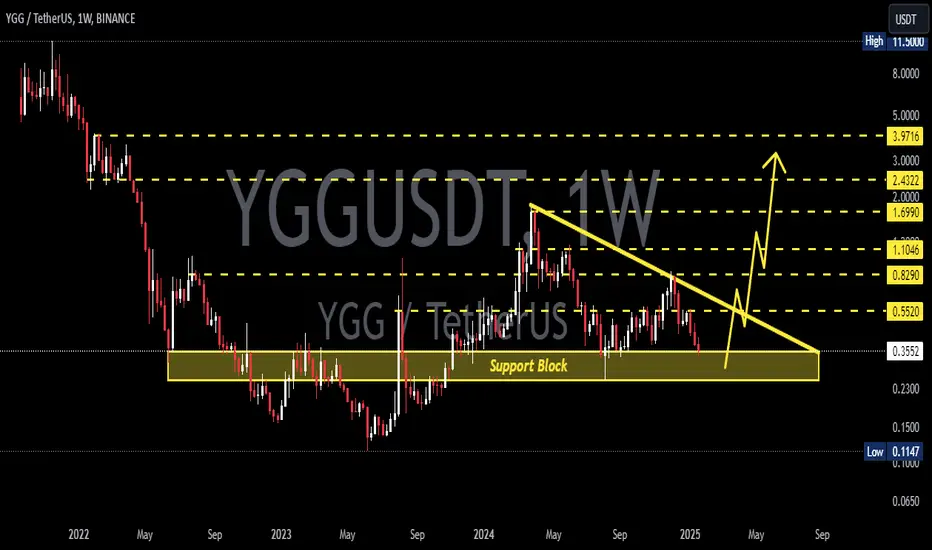
YGGUSDT 1WYGG ~ 1W Analysis
#YGG Support blocks that you might be able to consider to start buying again from here, with a short -term target of at least 15%+.
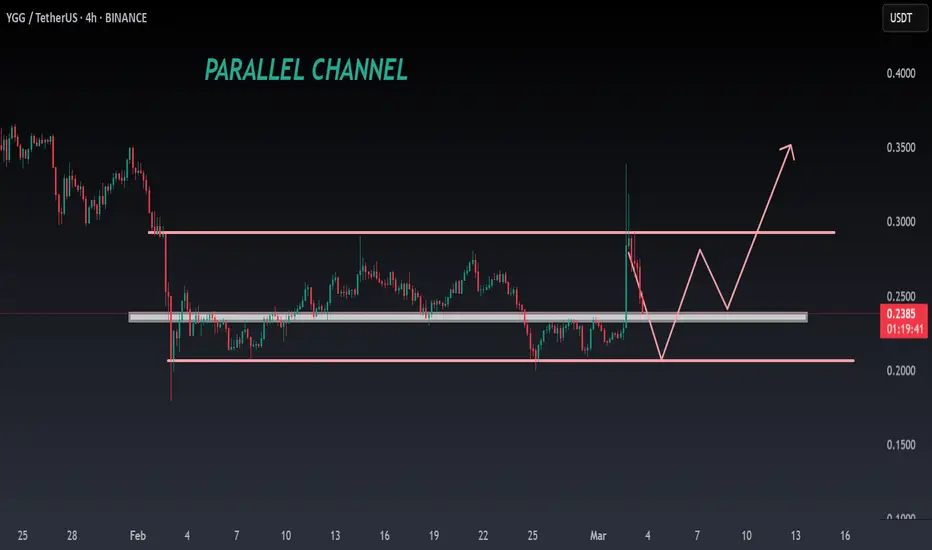
YGG ANALYSIS🚀#YGG Analysis :
🔮#YGG is consolidating in a parallel channel.... currently falling from its resistance zone. It is trading above its major support zone and there maybe a small retest towards lower supprt level and after that we will see a bullish move📈📈
🔰Current Price: $0.2400
🎯 Target Price:
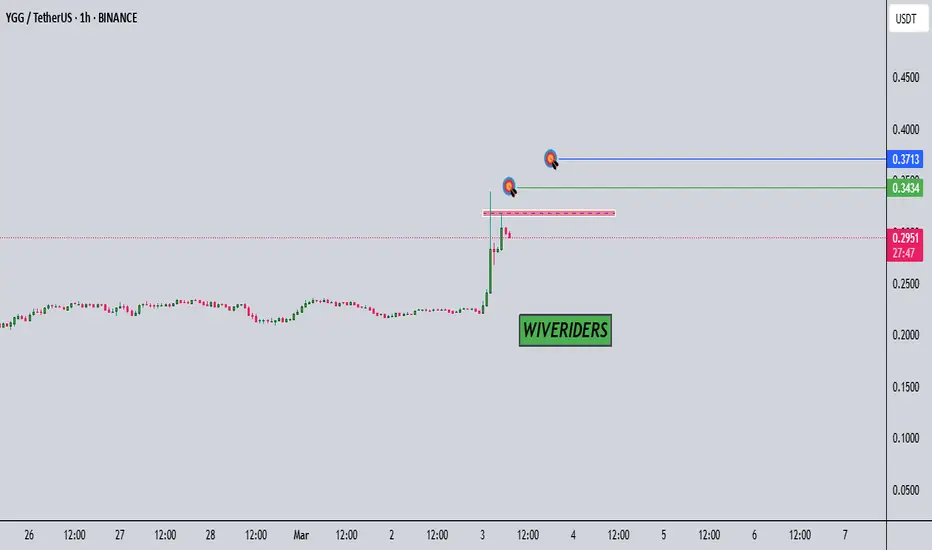
YGG is testingAnalysis 🚨
SET:YGG is testing the red resistance zone 🔴. If the breakout is successful, the first target will be the green line level 🟩, and the second target will be the blue line level 🔵!
🎯 Targets:
✅ 1️⃣ First Target: Green line level 🟩
✅ 2️⃣ Second Target: Blue line level 🔵
YGGUSDTmy entry on this trade idea is taken from a point of interest below an inducement (X).. I extended my stoploss area to cover for the whole swing as price can target the liquidity there before going as I anticipate.. just a trade idea, not financial advise
Entry; $0.2400
Take Profit; $0.2706
Stop

YGGUSDT 1WYGG ~ 1W Analysis
#YGG Re -testing this support block. Buy from here if you still have a Conviction on this coin with a minimum target of 20%++
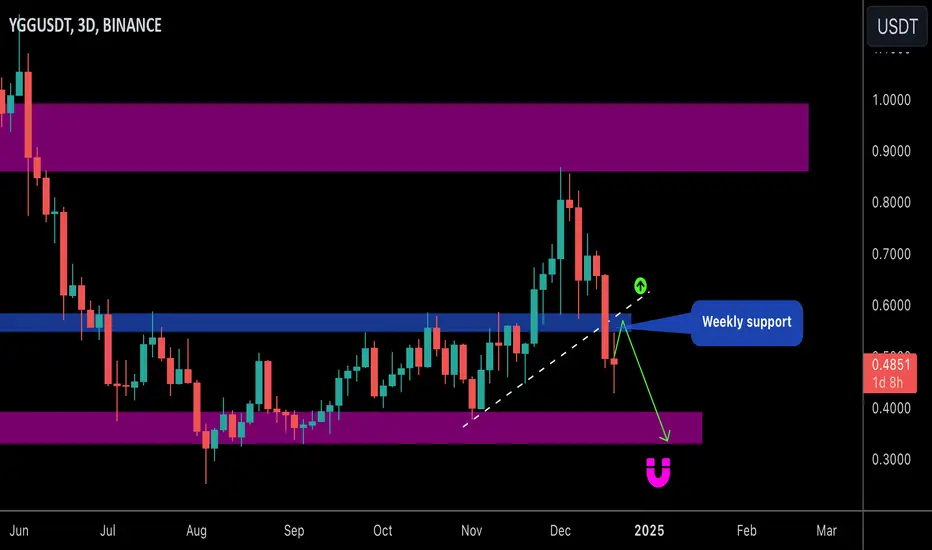
YGG short term viewYGG / USDT
Price broke down the weekly support
It looks like it heading towards 0.3X area before any future pump
Invalidation: close daily weekly above blue zone
The potential area could also be a good accumulation zone for this coin for next uptrend
Best of wishes
See all ideas
Summarizing what the indicators are suggesting.
Oscillators
Neutral
SellBuy
Strong sellStrong buy
Strong sellSellNeutralBuyStrong buy
Oscillators
Neutral
SellBuy
Strong sellStrong buy
Strong sellSellNeutralBuyStrong buy
Summary
Neutral
SellBuy
Strong sellStrong buy
Strong sellSellNeutralBuyStrong buy
Summary
Neutral
SellBuy
Strong sellStrong buy
Strong sellSellNeutralBuyStrong buy
Summary
Neutral
SellBuy
Strong sellStrong buy
Strong sellSellNeutralBuyStrong buy
Moving Averages
Neutral
SellBuy
Strong sellStrong buy
Strong sellSellNeutralBuyStrong buy
Moving Averages
Neutral
SellBuy
Strong sellStrong buy
Strong sellSellNeutralBuyStrong buy
Displays a symbol's price movements over previous years to identify recurring trends.