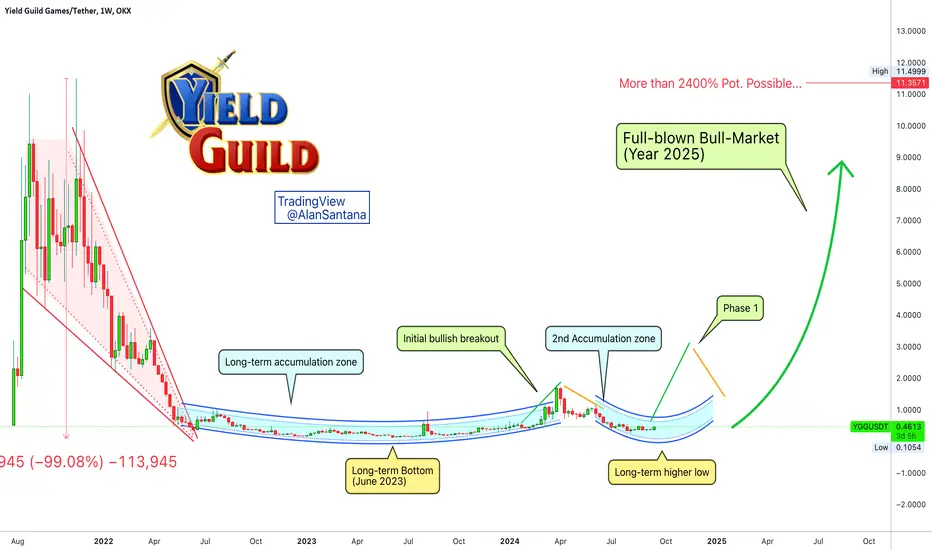
Yield Guild Games Long-Term | The 2025 25X+ Bull-MarketLet's look at how this current chart setup can lead to a strong bull-market in 2025.
Everything starts mid-2021, as soon as the trading pair goes live; massive growth.
The peak, ATH, happens November 2021 and this signals the start of a long-term correction or bear-market.
The bear-market hits bottom June 2023. The whole process lasts 567 days. Total drop amounts to 99.08%. That is, YGGUSDT lost 99% of its value.
This major bottom happens within a long-term accumulation zone. This zone leads to the first bullish wave, the "initial bullish breakout," and this wave in turn leads to a long-term higher low. The low hit recently ended up higher compared to June 2023.
Between now and March 2025 we will have mixed action. We will have a bullish wave and a correction. After this last correction, we will have sustained long-term growth.
The long-term growth phase ends in a classic bull-run. The bull-run can lead to very high prices or even a new All-Time High. This is expected to happen in late 2025.
Some Altcoins will peak in April/May 2025. Others will peak in August 2025 while still others will continue growing all the way through November 2025. Some will break all patterns and even enter 2026 green. There will be strong variations across the market. The only thing that is certain is that we are all going to win.
The market is red now.
The market has been red for years.
The market will not stay down forever, it cycles through red (down) and green (up).
After we are officially out of bear territory, we will experience growth for months, many months... Just as we can see prolonged bearish action on this chart, we will see sustained bullish growth. It will go for long. It will last more than anything you can expect and it will climb higher than anything you can imagine. You will be surprised.
Namaste.
YGGUSDT trade ideas
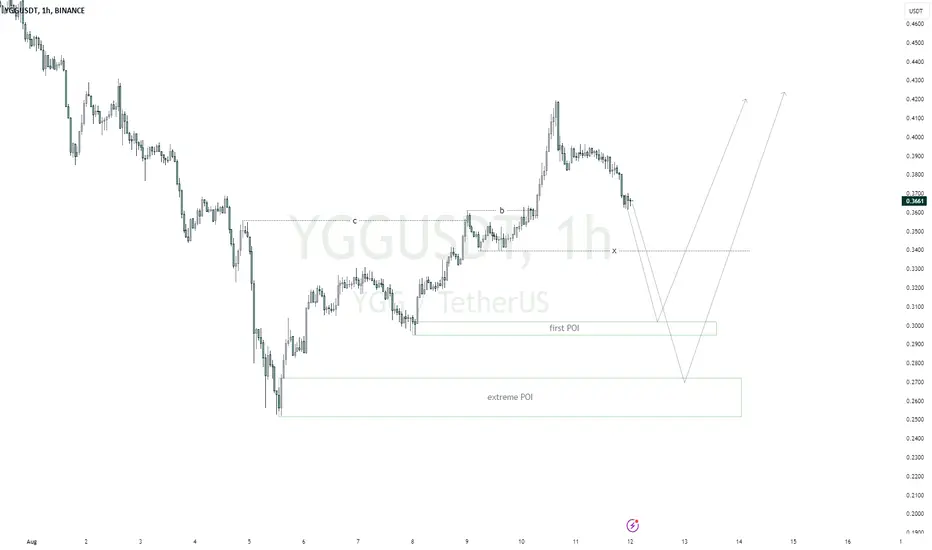
YGGUSDTmy entry on this trade idea is taken from a point of interest BELOW an inducement.. I extended my stoploss area to cover for the whole swing as price can target the liquidity there before going as i anticipate.. just a trade idea, not financial advise
Looking for reactions at these POIs
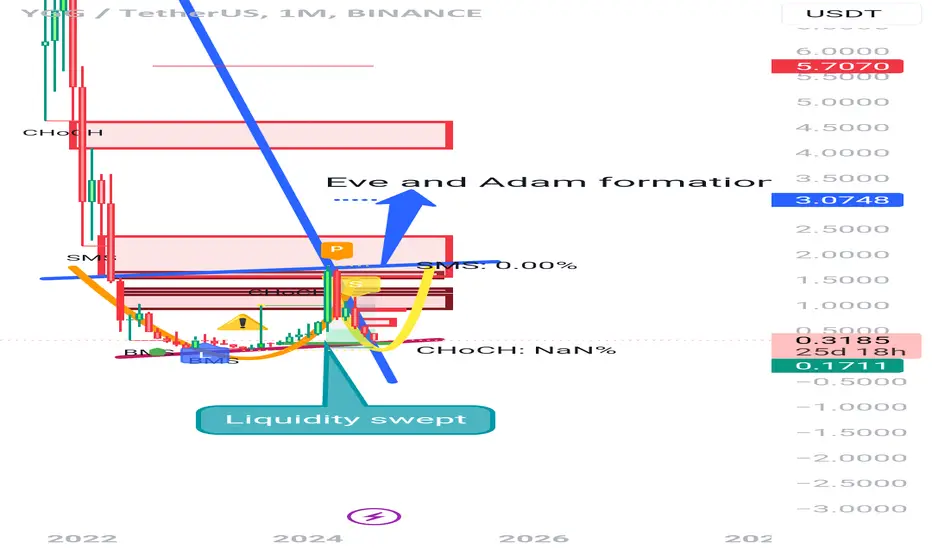
YGGUSDT Analysis YGG -
1)price is trading inside bullish pennant
2) could notice bullish Eve and Adam formation
3) bullish liquidity swept at 0.24-0.26 region
Breakout to upside is imminent
Target
Short term - 2.2-2.5
Retest after that around 1.6-1.8$ region
Long term Target - 4.4-5$
Any break below 0.11$ will invalidate this move.
DYOR.
YGGUSDTmy entry on this trade idea is taken from a point of interest BELOW an inducement.. I extended my stoploss area to cover for the whole swing as price can target the liquidity there before going as i anticipate.. just a trade idea, not financial advise
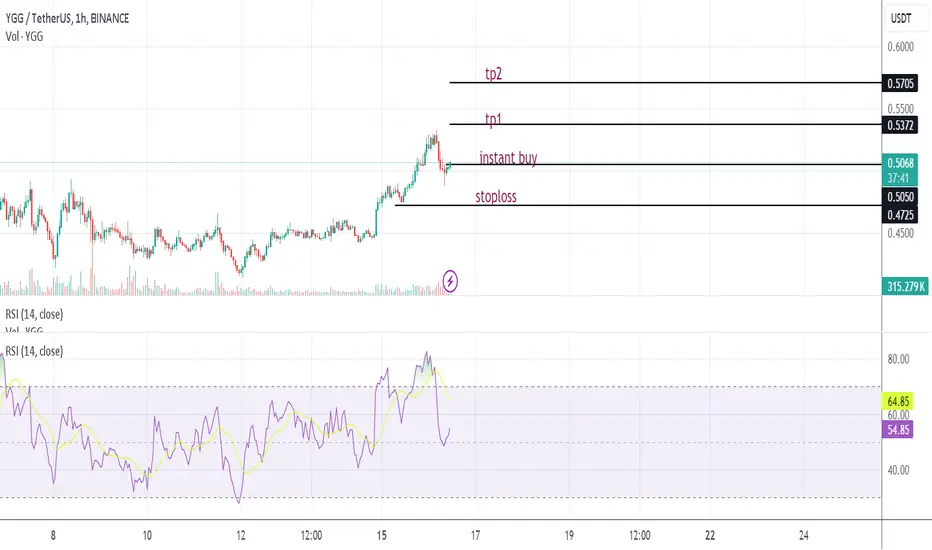
$YGG breakout done -- longed in YGG SET:YGG
**Future** / **Spot ** recommnded
Style swing hold
🫴`1st entry near the chart price `
🫴 `2nd entry around ( 0.5080 - 0.5020 )`
` Stop lose if daily candle close below (0.4665)`
<@&949979082127470592> @everyone

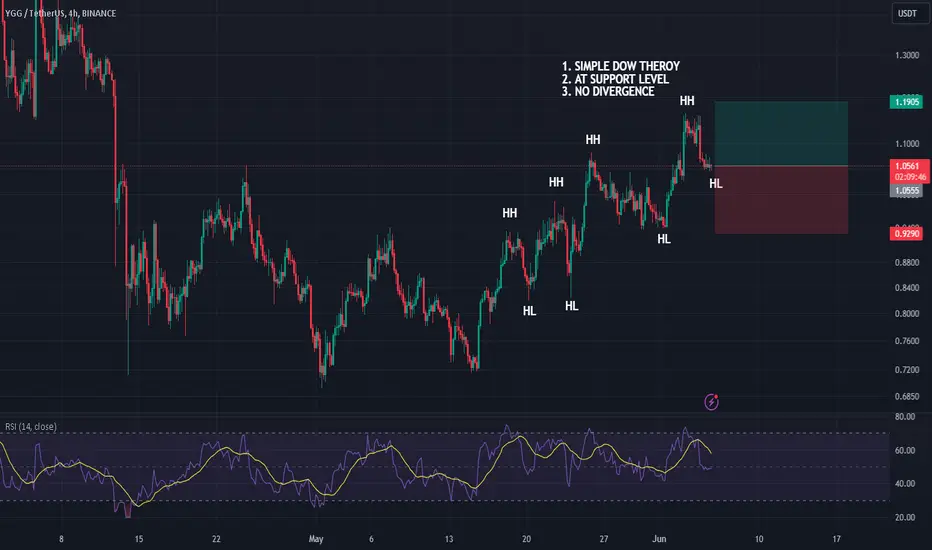
YGGUSDT is bullish in 1hour time frameYGGUSDT is bullish in 1hour time frame, as it came out from accumulation phase also printing HH and HL
YGGUSDT is BearishYGG gave a good breakout, however at the 15 minute it seems that the bears have taken control again. Previous higher low is broken, and hence a bearish rally is expected from here. Targets are mentioned on the chart.

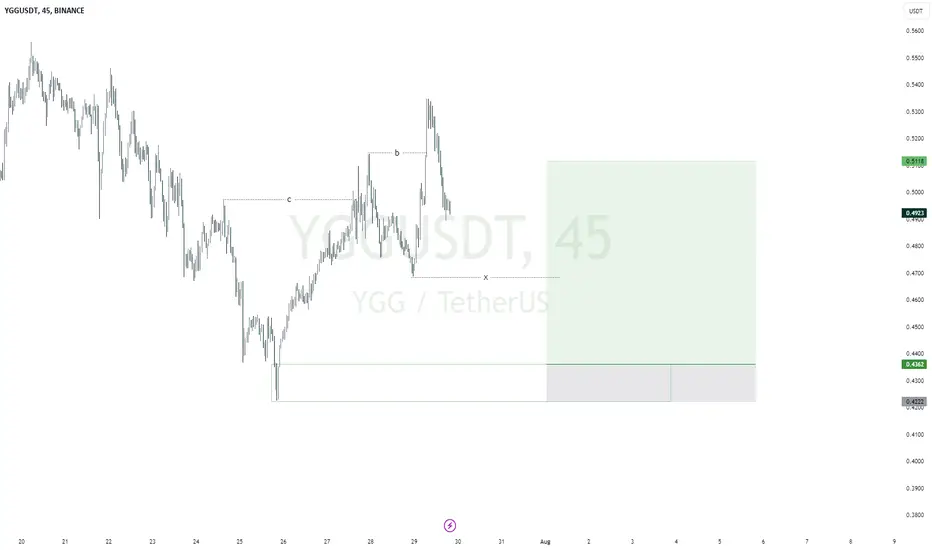
Alikze »» YGG | Pullback to broken structure🔍 Technical analysis: Pullback to broken structure
- According to the previous analysis presented in the 12H time frame, after reacting to the PRZ zones, it faced selling pressure, which finally continued to the specified zone of 0.58 correction.
- Currently, it has infiltrated the sub-region in the 12H time frame.
- Therefore, if this return continues up to the supply range and the middle of the descending channel and then faces selling pressure, the downward trend can continue up to the range of 0.39.
💎 Alternative scenario: if this reversal breaks the supply zone with strength and meets demand in the middle of the channel, the first target near that range will be 0.78, and if the zone is maintained, it can move up to the channel ceiling and the specified supply range.
🛑 Resistance range: 0.5859 - 0.6836
🟩 Support range: 0.3906
»»»«««»»»«««»»»«««
Please support this idea with a LIKE and COMMENT if you find it useful and Click "Follow" on our profile if you'd like these trade ideas delivered straight to your email in the future.
Thanks for your continued support.
Best Regards,❤️
Alikze.
»»»«««»»»«««»»»«««

Alikze »» YGG | Ready to break the PRZ !In 12H time, it is moving in an ascending channel, which has had three reactions to the dynamic trigger or the bottom of the channel so far.
💎 Therefore, this trigger or ascending channel can be considered valid. However, it has had two negative reactions at the ceiling of the channel in the resistance range, which has not been able to stabilize above this channel, which has led to two fake breaks and has faced supply and selling pressure.
💎 Finally, it formed a double ceiling in the ceiling of the channel, after which it encountered a zigzag correction and reacted positively to the trigger in the green box range.
💎 The first scenario: but it is currently in the PRZ1 range, if it can stabilize above it, it can rise to the PRZ2 area, which also has an FVG gap.
💎 Alternative scenario: But if this area does not have the ability, the alternative scenario is to retest the channel floor, and if it is lost, it can continue to the next node of the green box area.
»»»«««»»»«««»»»«««
Please support this idea with a LIKE and COMMENT if you find it useful and Click "Follow" on our profile if you'd like these trade ideas delivered straight to your email in the future.
Thanks for your continued support.
Sincerely.❤️
»»»«««»»»«««»»»«««

$YGG - Looking for a good entryYGG looks ready to bouche from this area.
Bullish still under control if price stay above the trendline.
All will invalid if price close below the purple zone ($0.49) in daily tf
Are you interesting?
What do you expect?

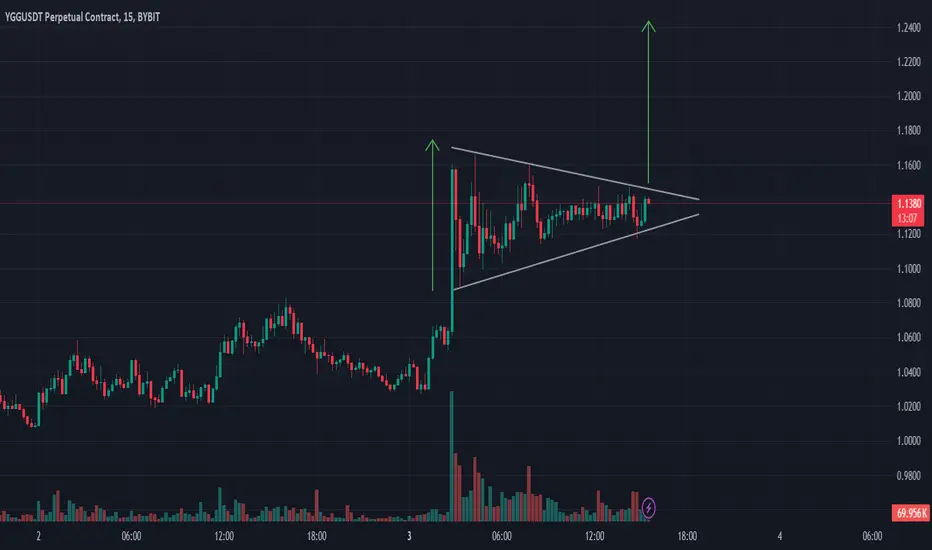
YGG Symmetrical Triangle Continuation PatternYGG has seen a significant price increase and might be consolidating in a symmetrical triangle for a possible breakout. Keep an eye on it.
Ideas are mine alone and do not constitute financial advice
A good scalp short on YGGUSDT. \Please manage your risk. On shorter timeframe, there is a break of internal structure. You can earn 3 times profit on this short scalp trade.

YGG NEW INCREASE VOLUMEYGG shows an interesting trend effect that could have a high chance of increasing in the coming time frames.
Holding volume makes it interesting for daily trend.


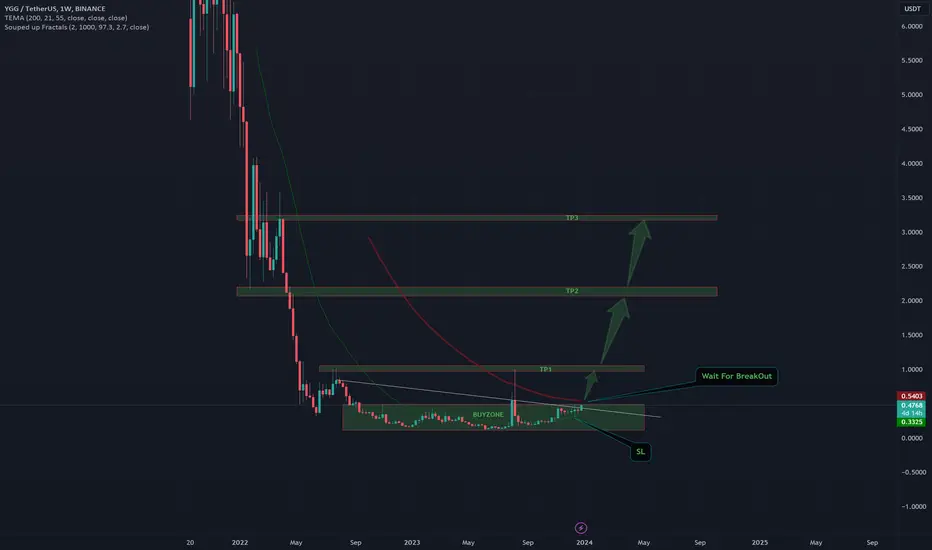
YGGUSDT Long/Short Just an Idea !!!YGG is at buyzone n trying to break its all time Resistance....
a break n confirmation can pull YGG to more than 2$...
Keep adding at buyzone ...
NAFA n DYOR...
ThankYou...
YGG looks bullish (4H)We have a large diametric on the chart. We seem to be at the end of the F wave.
If there is a pullback on the green range, we will look for buy/long positions.
The target is clear on the chart
For risk management, please don't forget stop loss and capital management
When we reach the first target, save some profit and then change the stop to entry
Comment if you have any questions
Thank You

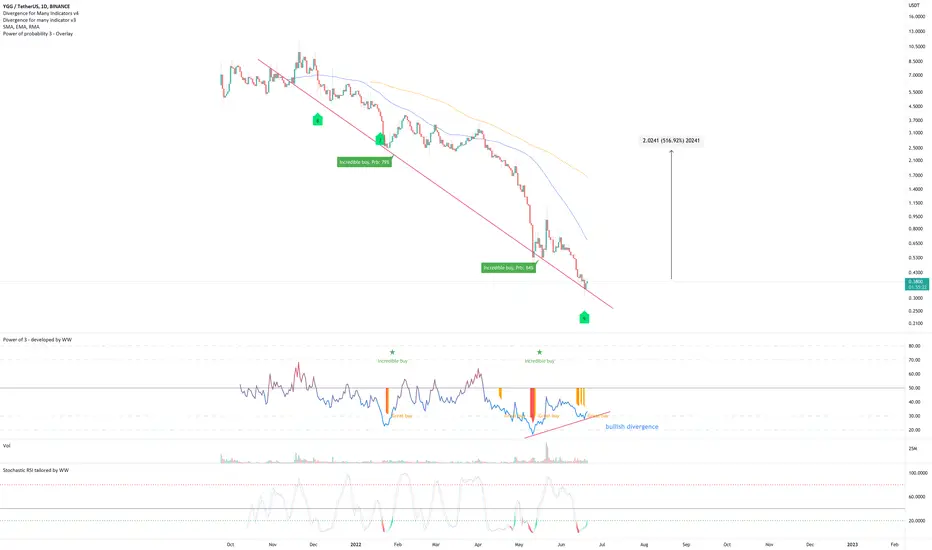
Yield Guild Games (YGG)- Bullish divergenceOn the above daily chart price action has corrected 95% since November. A number of reasons now exist to be bullish, including:
1) The ‘incredible buy’ signal.
2) Regular bullish divergence . Multiple oscillators are currently printing positive divergence.
3) The 3-day BTC prints the same conditions as 1 and 2 (below).
Is it possible price action falls further? For sure.
Is it probable? Very unlikely.
Good luck!
Ww
PS: I’m not trading this so please ask below for updates.
Type: trade
Risk: <=6% of portfolio
Timeframe: 1 to 4 months
Return: 7x / $2.40
3-day BTC chart

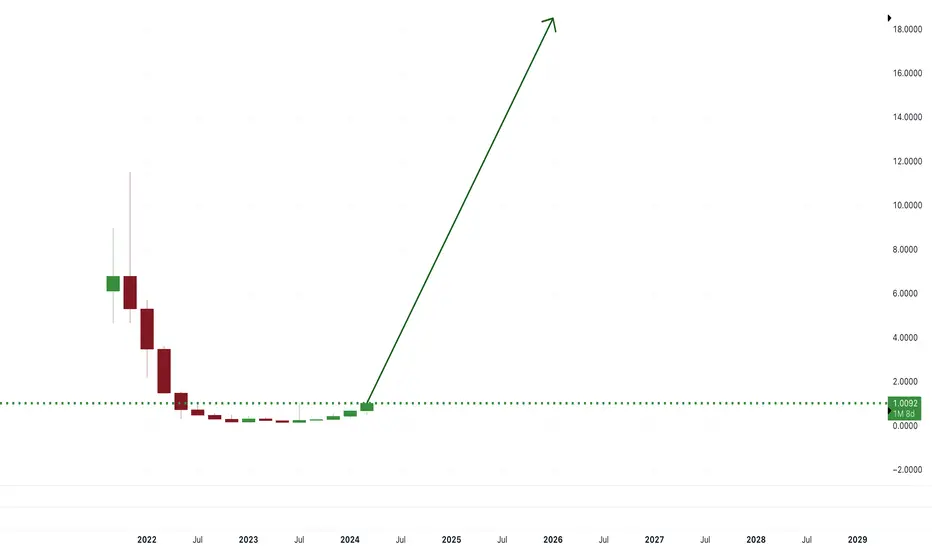
Got my trader's eye on $YGG with a juicy target of $18.55 by end🚀🌕 When CRYPTOCAP:BTC roars, the alts soar! Got my trader's eye on SET:YGG with a juicy target of $18.55 by end-2025. This is not financial advice. It is only a hope.
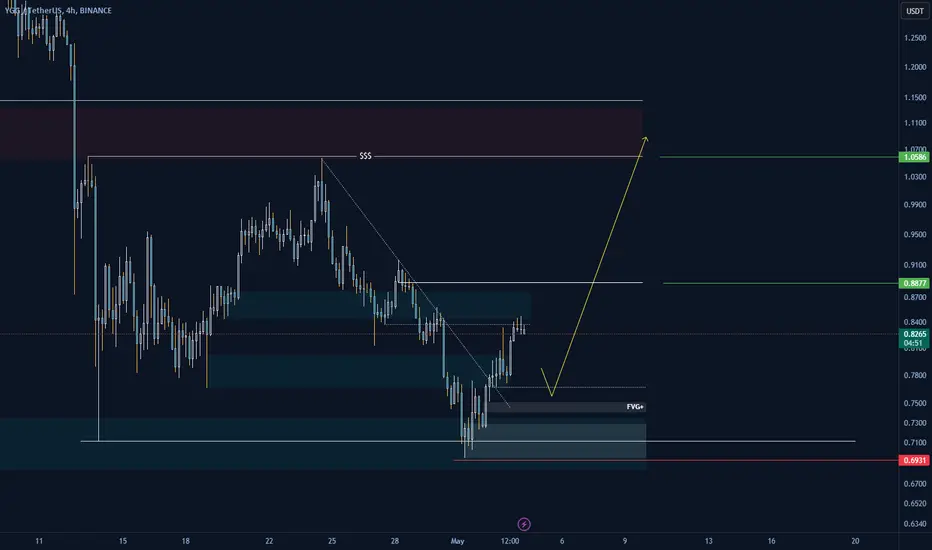
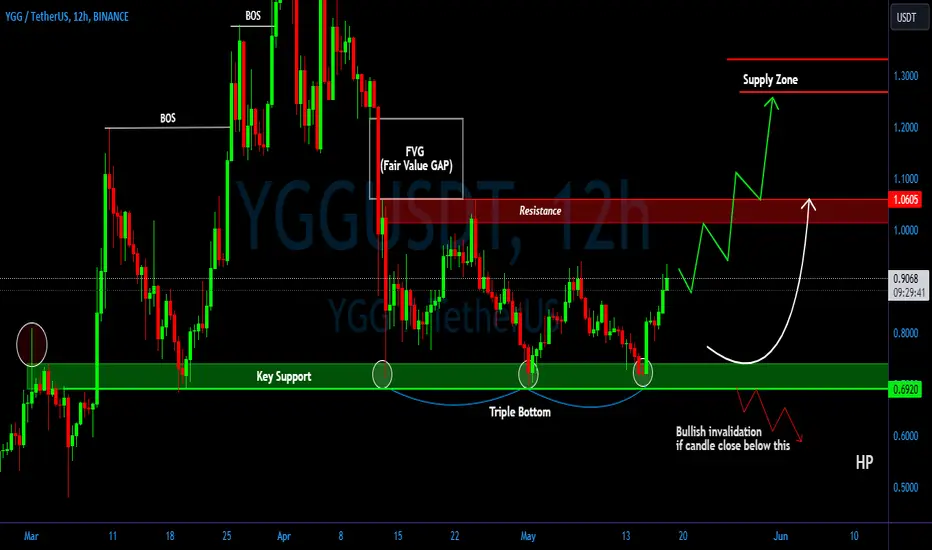
YGG/USDT It looks triple bottom, Bullish momentum for YGG💎 Paradisers, #YGG is indeed a coin worth monitoring closely.
💎 It appears that YGG has experienced a strong bounce from the key support area, potentially forming a triple bottom pattern, which is a bullish reversal pattern.
💎 To validate this pattern, YGG needs to break out above the resistance level of 1.06. If successful, this breakout could signal a return to bullish momentum, potentially leading YGG to reach our target supply zone area.
💎 However, if YGG fails to break above the resistance and faces rejection, it may resume its downward movement, retracing back to test the key support area around 0.74 - 0.69.
💎 Based on historical price action, YGG has shown a tendency to bounce when reaching this support zone. Therefore, if YGG revisits this area, there is potential for another bounce, potentially reversing the downtrend and aiming to break above the key resistance level at 1.06.
💎 The bullish invalidation scenario would come into play if YGG fails to bounce from the key support area and the daily candle closes below it. This would confirm bearish sentiment and could lead to further downward movement and deeper dips.
MyCryptoParadise
iFeel the success🌴
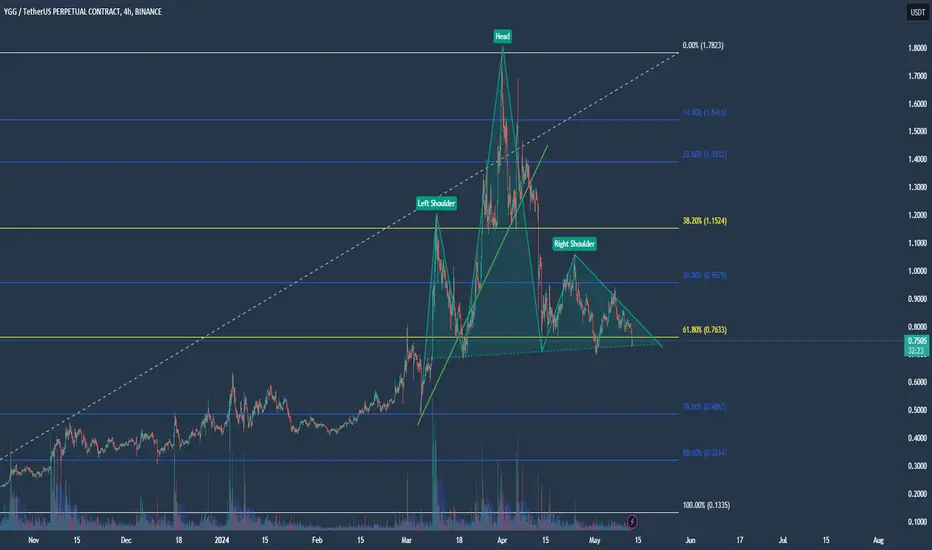
YGG Head And Shoulders Pattern 5/13/2024We are seeing a Head and shoulders pattern short term, it might retrace back to the nearest support in the .786 area.
YGG has a lot of catalyst for this year it can be a bagger.
YGG / YGGUSDTGood Luck >>
• Warning •
Any deal I share does not mean that I am forcing you to enter into it, you enter in with your full risk, because I'll not gain any profits with you in the end.
The risk management of the position must comply with the stop loss.
(I am not sharing financial or investment advice, you should do your own research for your money.)