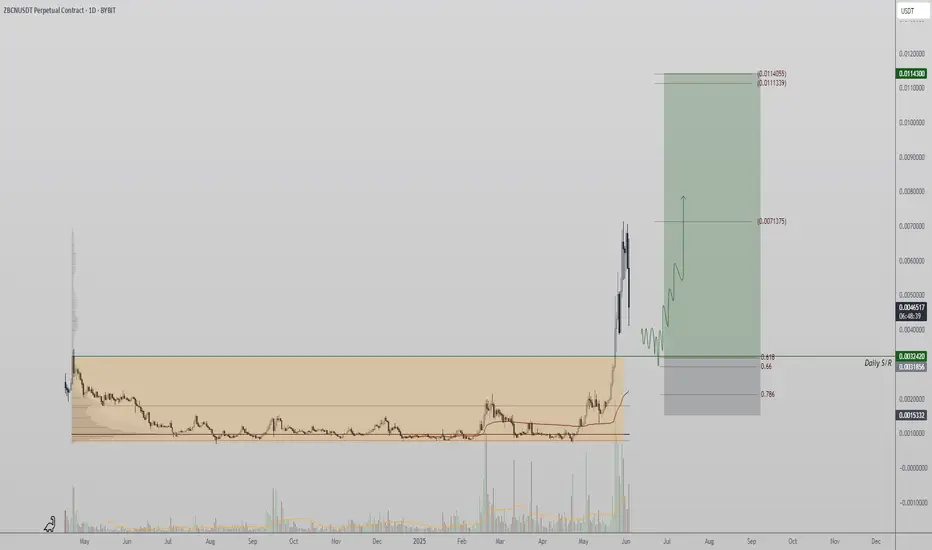
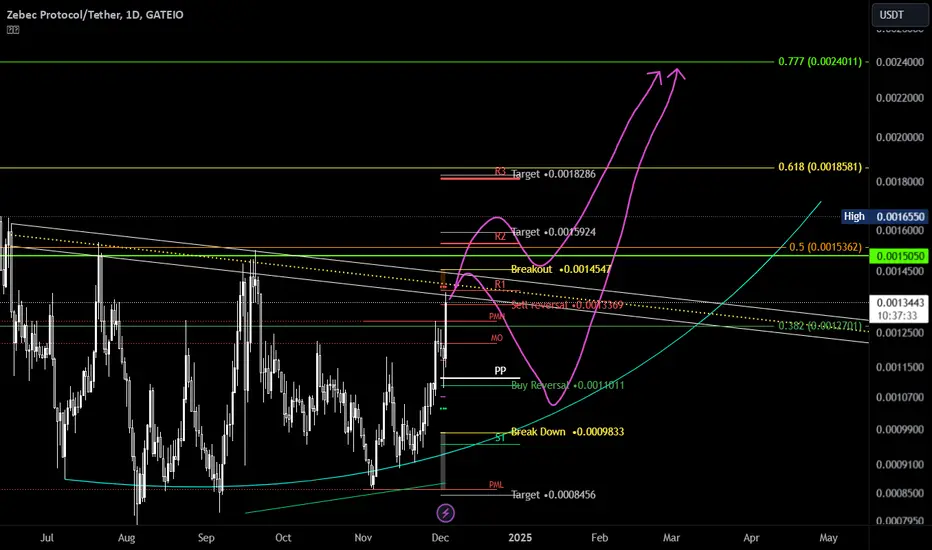
ZBCN Technical Analysis – Breakout From AccumulationZBCN has shown impressive strength recently, following a textbook breakout from an extended accumulation phase. This kind of setup is well-known among technical traders: a period of sideways, range-bound price action often leads to an explosive move once resistance is broken — and that’s exactly wha
Can we be optimistic that this will come true?Perhaps this is a cup and handle pattern, and if that's the case, it could push the price up to around 0.004 .
Give me some energy !!
✨We spend hours finding potential opportunities and writing useful ideas, we would be happy if you support us.
Best regards CobraVanguard.💚
_ _ _ _ __ _ _ _ _ _ _ _

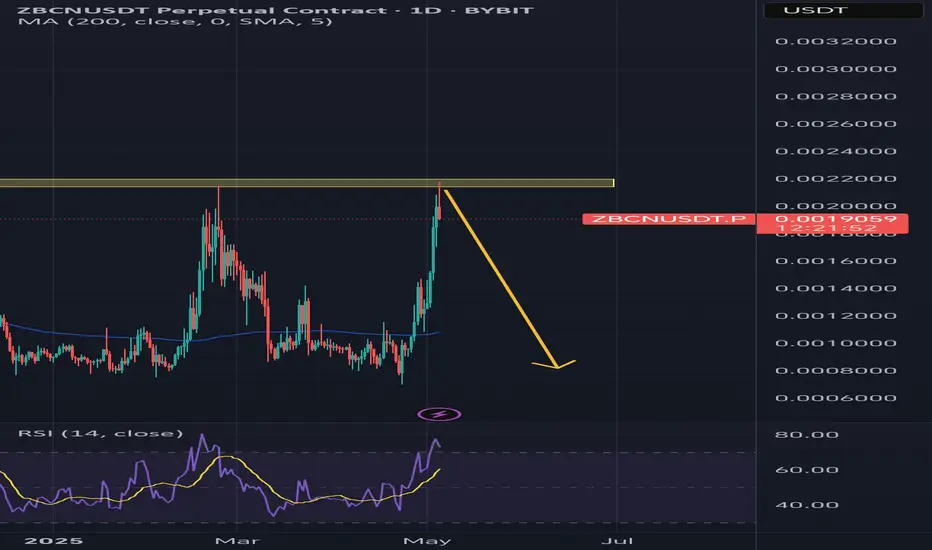
ZBCNUSDT coin Go to down againZBCN coin going to down againe..get entry short position.don't miss this chance.
Target
0.0014500
0.0010900
$ZBCN #ZBCN ZBCN ZBCNUSDT #LONG #BitgetLong base #breakout on volume fueld by news of partnerships, certifications and buybackscould be the catalyst for an explosive move. A strong following and socials backing is an added boost.
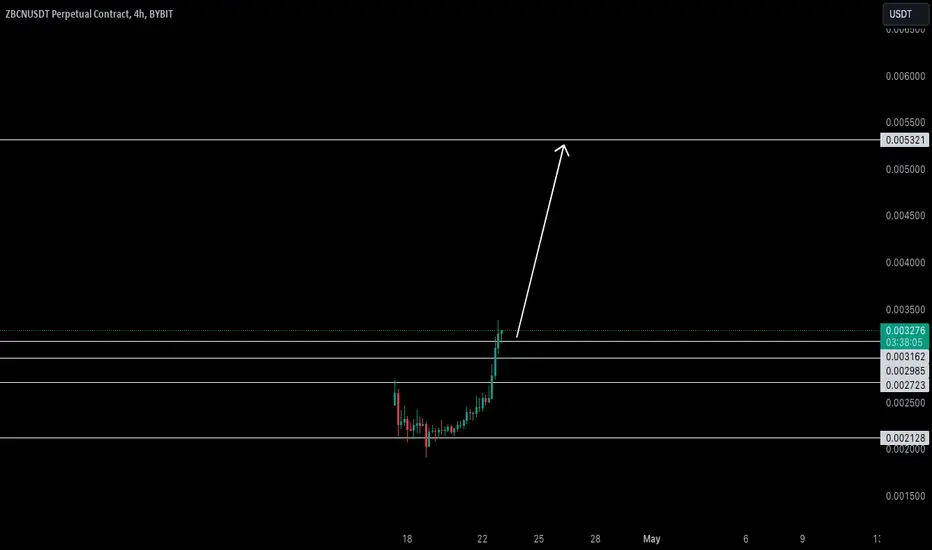
ZBCN - Exiting from stage 1!
Price Action Overview
The price has broken above previous resistance levels with strong bullish momentum, accompanied by a spike in volume.
The breakout occurred after a long period of consolidation, where the price was moving sideways with relatively low volatility.
The RSI is above 74, indicating
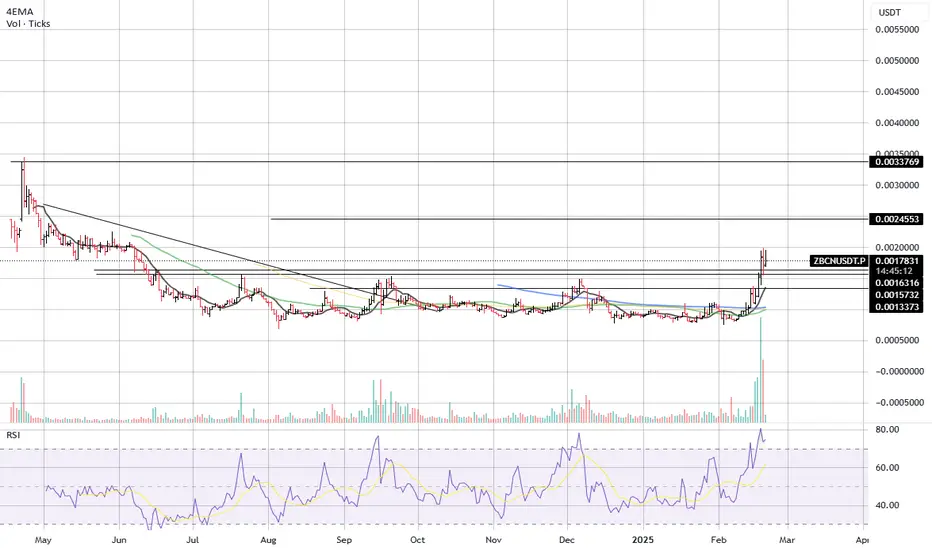
Zebec Network Breaks Long-Term Consolidation Pattern (~400%)Very interesting. The bull-market trend has been confirmed.
Zebec Network (ZBCNUSDT) broke a long-term consolidation pattern. This pattern has been active for a full eight months and is breaking only now. The break is happening on high and rising volume. Yesterday's volume is the highest ever.
Thi

#ZBCN watchingWatching the price here for the next couple of days, if we start to have a breakout will buy if we have a retrace will try to buy on sign of accumulation
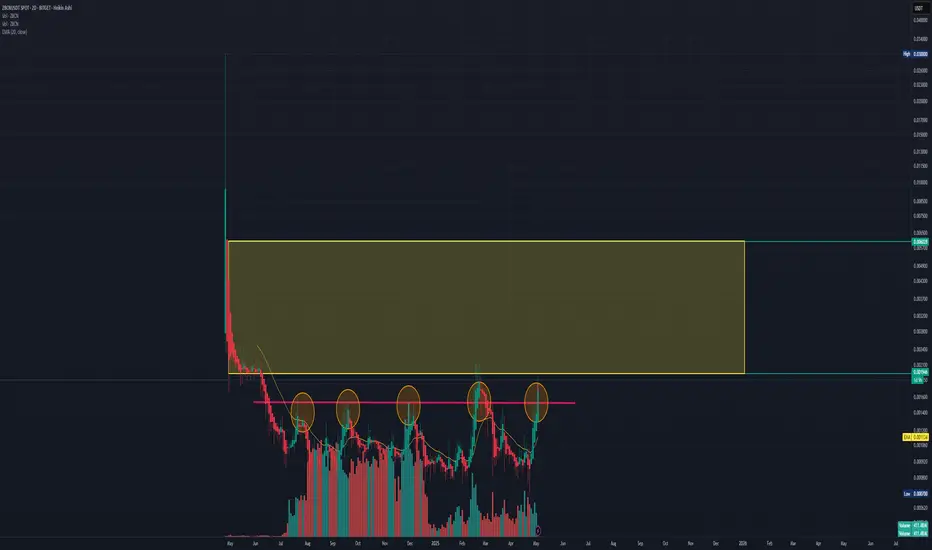
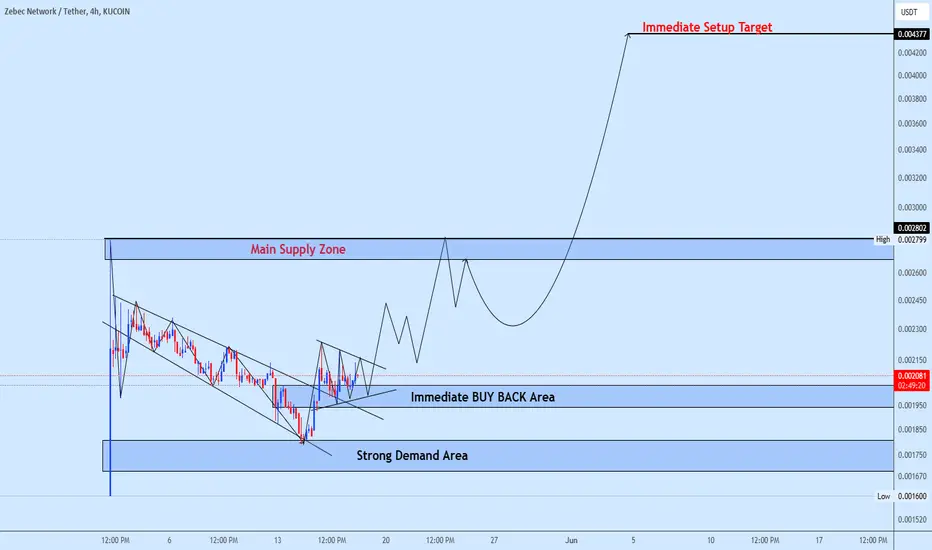
ZBCNusdt Buy opportunityZBCNusdt is currently trading within a robust demand and supply zone. From the current level, designated as an immediate buyback area, we anticipate a rise towards the primary supply zone. Our analysis indicates a potential breakout through this supply zone, aiming for the setup target illustrated o
From Hype to Reality:How DePIN is Revolutionizing InfrastructureDePIN (Decentralised Physical Infrastructure Networks) is a rapidly growing sector that combines physical resources such as industrial equipment, vehicles and energy systems with blockchain and crypto-economy technologies.
Using DePINs, people can share and manage resources, enabling the creation
ZBCNUSDTAccording to the waves analysis we can expect that price rise again to the green zone. follow me for more ideas
See all ideas
Summarizing what the indicators are suggesting.
Oscillators
Neutral
SellBuy
Strong sellStrong buy
Strong sellSellNeutralBuyStrong buy
Oscillators
Neutral
SellBuy
Strong sellStrong buy
Strong sellSellNeutralBuyStrong buy
Summary
Neutral
SellBuy
Strong sellStrong buy
Strong sellSellNeutralBuyStrong buy
Summary
Neutral
SellBuy
Strong sellStrong buy
Strong sellSellNeutralBuyStrong buy
Summary
Neutral
SellBuy
Strong sellStrong buy
Strong sellSellNeutralBuyStrong buy
Moving Averages
Neutral
SellBuy
Strong sellStrong buy
Strong sellSellNeutralBuyStrong buy
Moving Averages
Neutral
SellBuy
Strong sellStrong buy
Strong sellSellNeutralBuyStrong buy
Displays a symbol's price movements over previous years to identify recurring trends.