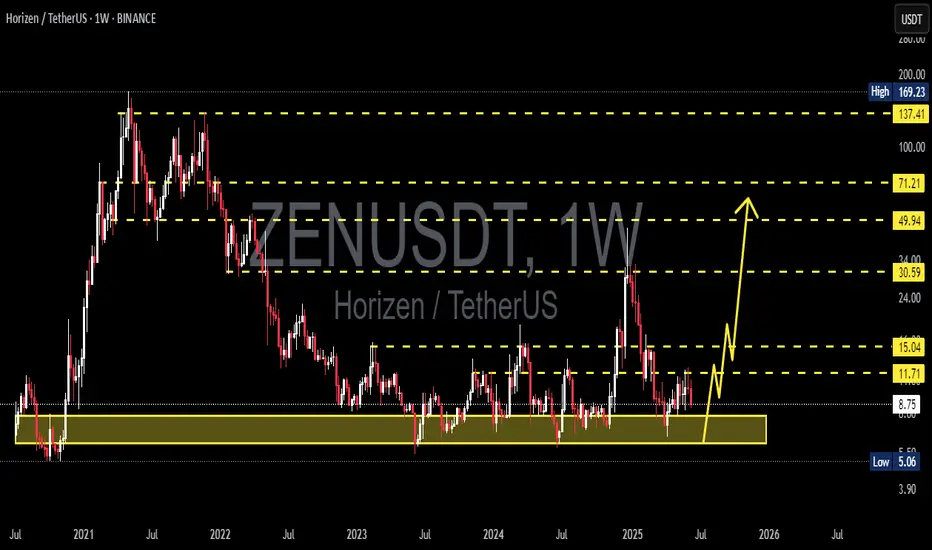
ZENUSDT 1W Analysis ZEN ~ 1W Analysis
#ZEN Buy on retest of this support block with short term target of at least 20%+. This is the lowest support block for now.
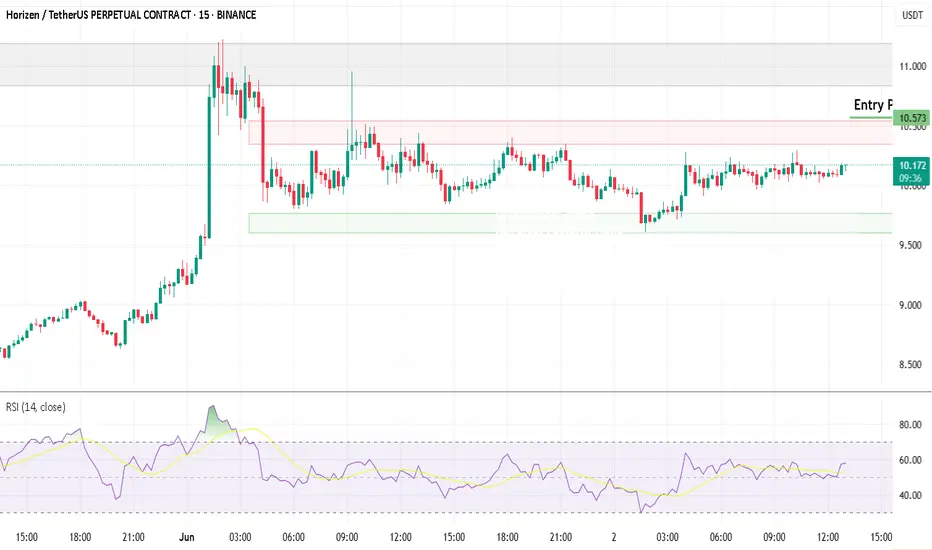
ZEN/USDT – 15M Chart Analysis📊 Trend: Bullish
📈 Entry Plan: I will take entry right after a confirmed breakout of the accumulation box.
🎯 Profit Target: You can book profits based on your own risk-reward ratio and trade plan.
"Amateurs focus on rewards. Professionals focus on risk."
Always protect your capital—let the market c
Horizen: What You Need To Know About The Altcoins—Experts Only!A shakeout is a market move where the whales (exchanges) create volatility in order to rattle unprepared traders and investors.
If you use a limit stop-loss and you are clueless, the exchanges and market whales can see your orders and they use this to their advantage. Since they own all of the coin
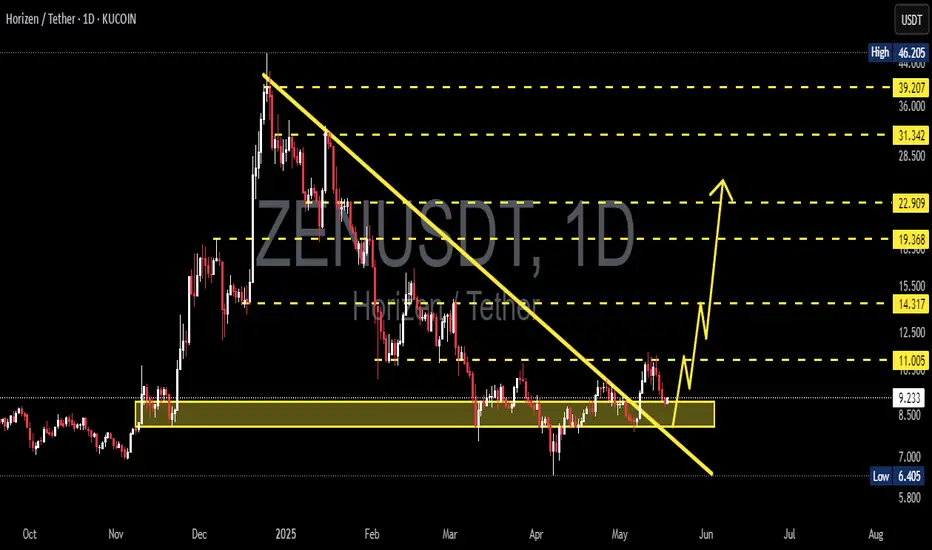
ZENUSDT 1D AnalysisZEN ~ 1D Analysis
#ZEN Buy back gradually from here with a short term target of at least 15%+ from here.
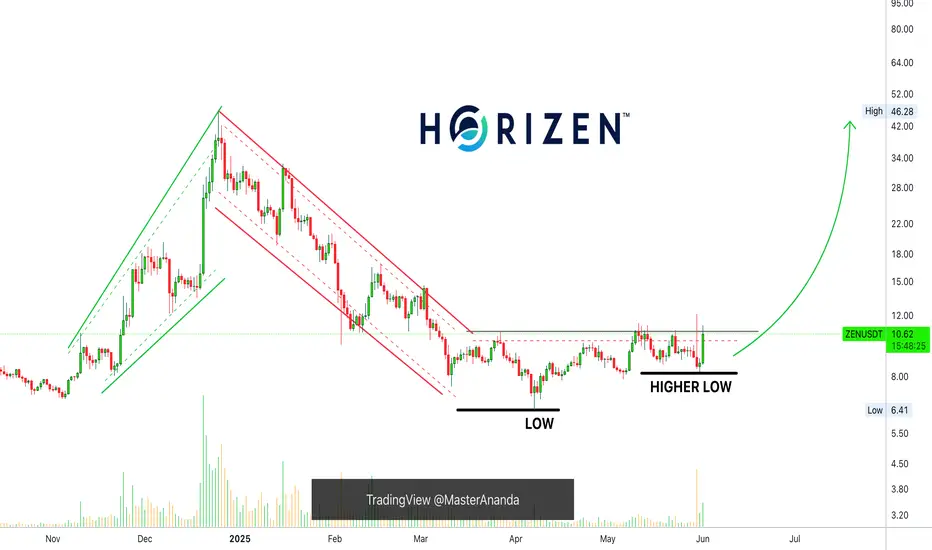
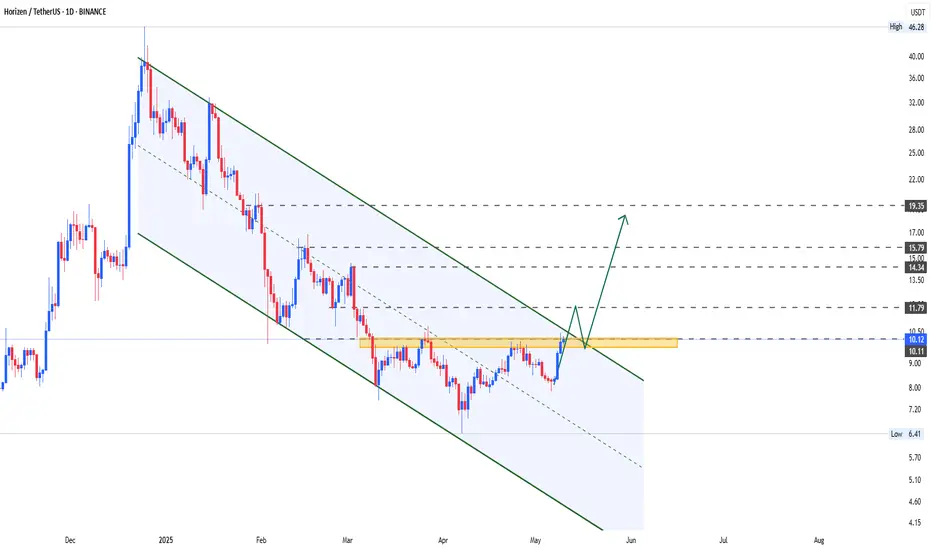
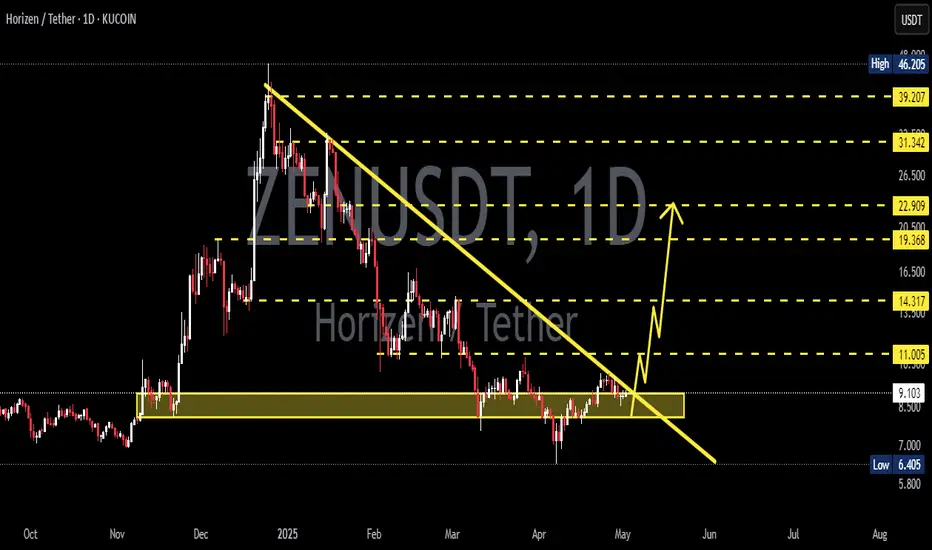
ZEN breakout soonYou can either buy gradually from here or wait for a breakout above this resistance line, aiming for a short-term target of at least 10% 20% or more.
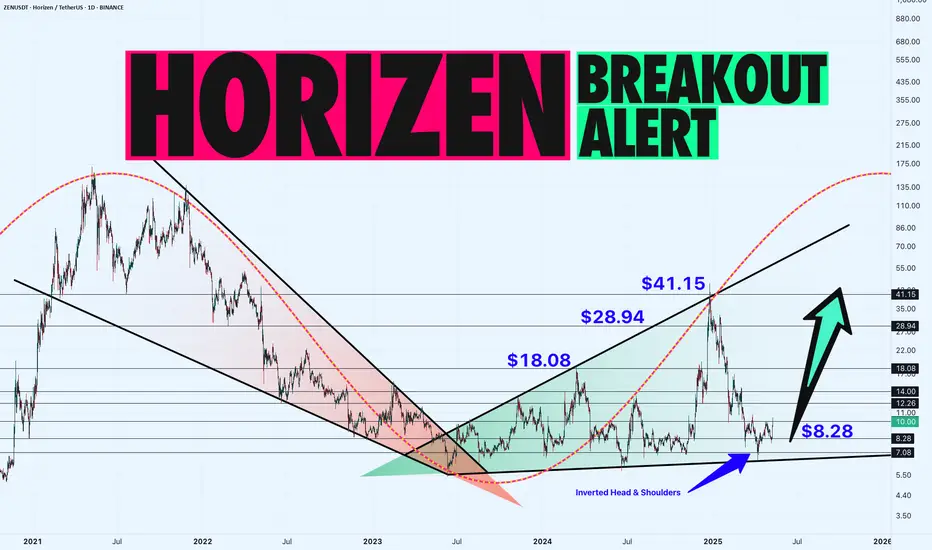
ZEN/USDT Daily Chart: Accumulation Before the Big Move? Hey traders! Let’s dive into this daily ZENUSDT chart. Horizon is in a sideways accumulation phase, forming an Expanding Wedge right after a massive bullish Falling Wedge breakout.
We’re also seeing a small inverted head and shoulders at the bottom support range of $7.08-$10.08 , with
ZENUSDT | Strong Buyers, Strategic PatienceZENUSDT has caught my attention thanks to persistent buyer strength, even in an environment where many altcoins are struggling to hold ground. This tells us something important: smart money is interested, and that makes this chart worth watching closely.
🔹 The Blue Box – A Launchpad or a Trap?
We’r

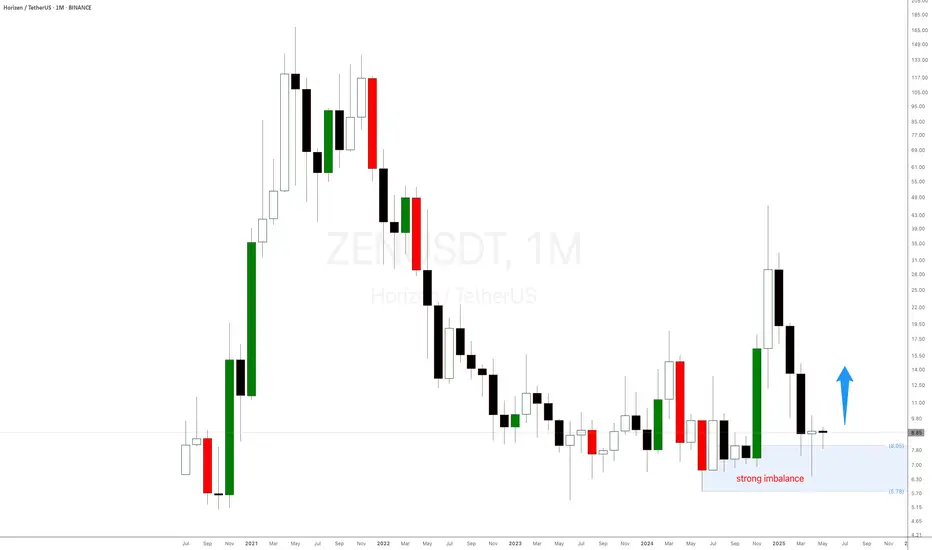
Is Horizen $ZEN The Next Big Crypto Investment Opportunity?In May 2025, LSE:ZEN has reached a strong imbalance trading at $8 after a period of consolidation for a couple of months. A morning star price action candlestick pattern is being created This imbalance suggests that buying pressure is outweighing selling pressure, creating a favorable environment
ZENUSDT 1D AnalysisZEN ~ 1D Analysis
#ZEN Buy gradually from here if you still have a Conviction on this coin with a short -term target of at least 15%+ from here.
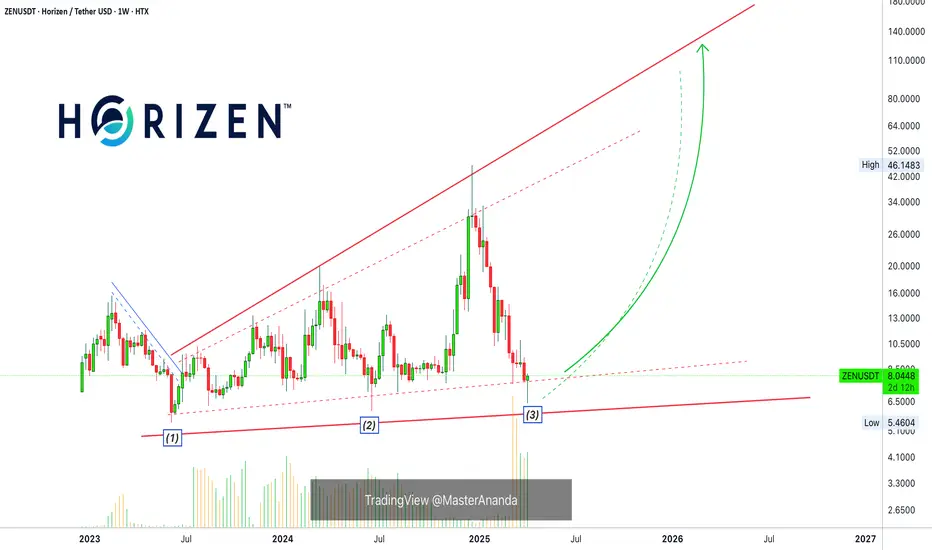
Horizen: Your Altcoin ChoiceIt is very easy to see where Horizen is going. Very easy. A broadening ascending channel is present on the chart.
➖ Notice the lower boundary and the higher lows. Perfect symmetry. Growing slowly long-term. The bottom was hit June 2023.
➖ Notice the higher boundary and the higher highs. Truly perf
See all ideas
Summarizing what the indicators are suggesting.
Oscillators
Neutral
SellBuy
Strong sellStrong buy
Strong sellSellNeutralBuyStrong buy
Oscillators
Neutral
SellBuy
Strong sellStrong buy
Strong sellSellNeutralBuyStrong buy
Summary
Neutral
SellBuy
Strong sellStrong buy
Strong sellSellNeutralBuyStrong buy
Summary
Neutral
SellBuy
Strong sellStrong buy
Strong sellSellNeutralBuyStrong buy
Summary
Neutral
SellBuy
Strong sellStrong buy
Strong sellSellNeutralBuyStrong buy
Moving Averages
Neutral
SellBuy
Strong sellStrong buy
Strong sellSellNeutralBuyStrong buy
Moving Averages
Neutral
SellBuy
Strong sellStrong buy
Strong sellSellNeutralBuyStrong buy
Displays a symbol's price movements over previous years to identify recurring trends.