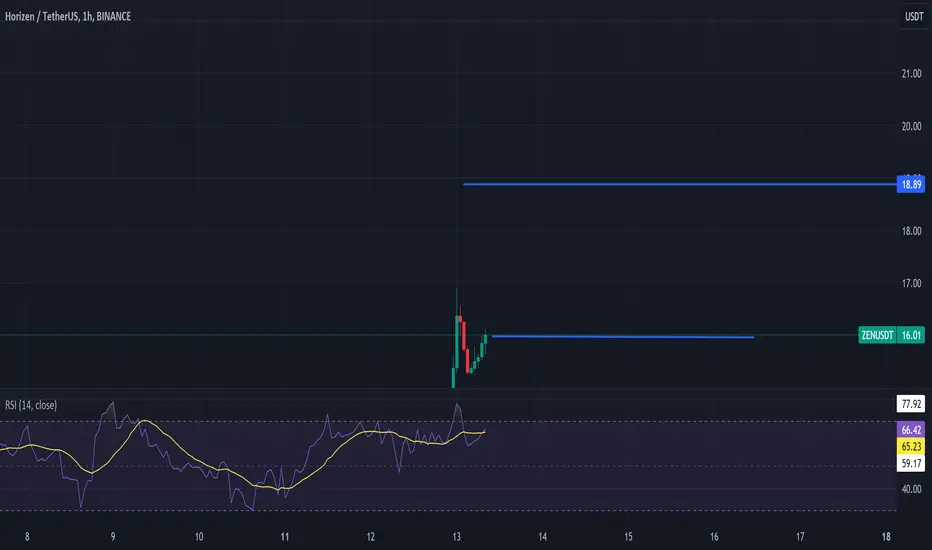
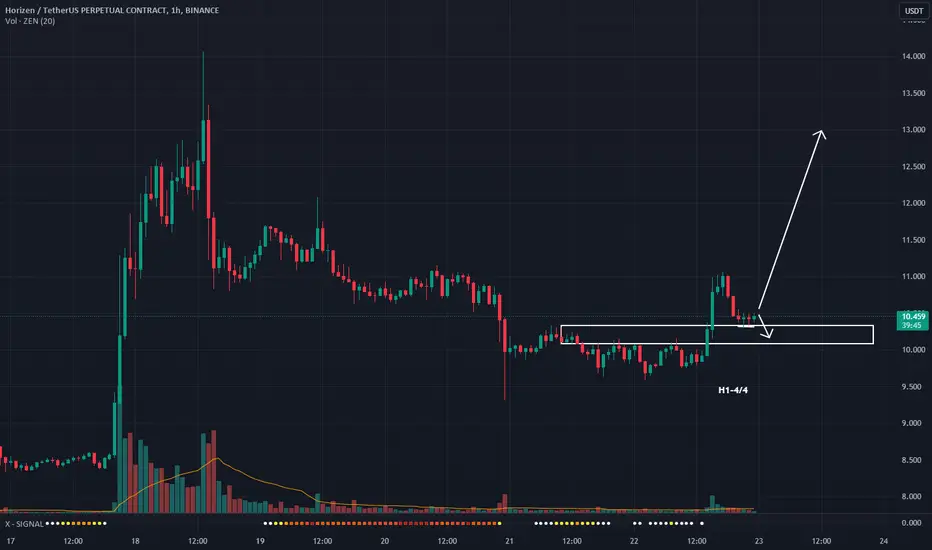
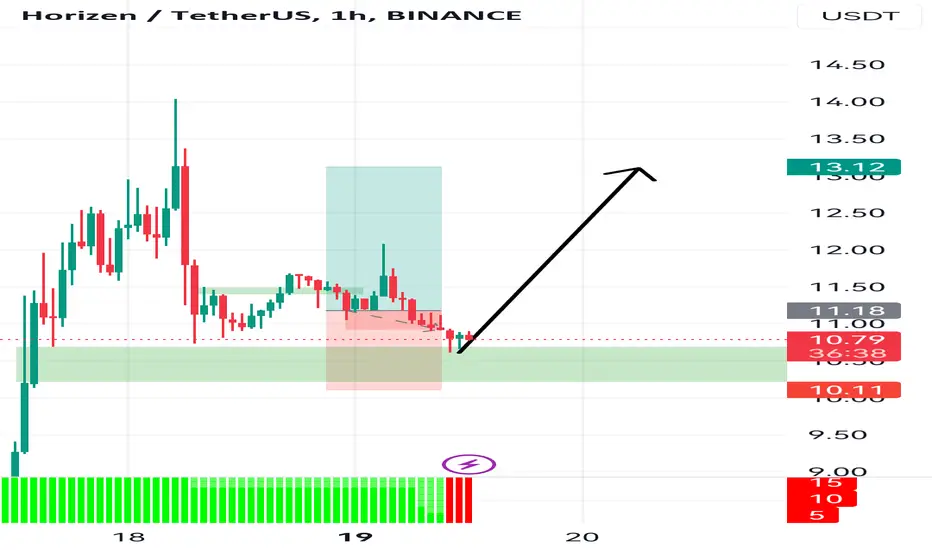
ZEN 🧘♀️Zen has experienced a rejection from the 4-hour order block, indicating a potential price increase from this point onwards.
ZENUSDT trade ideas
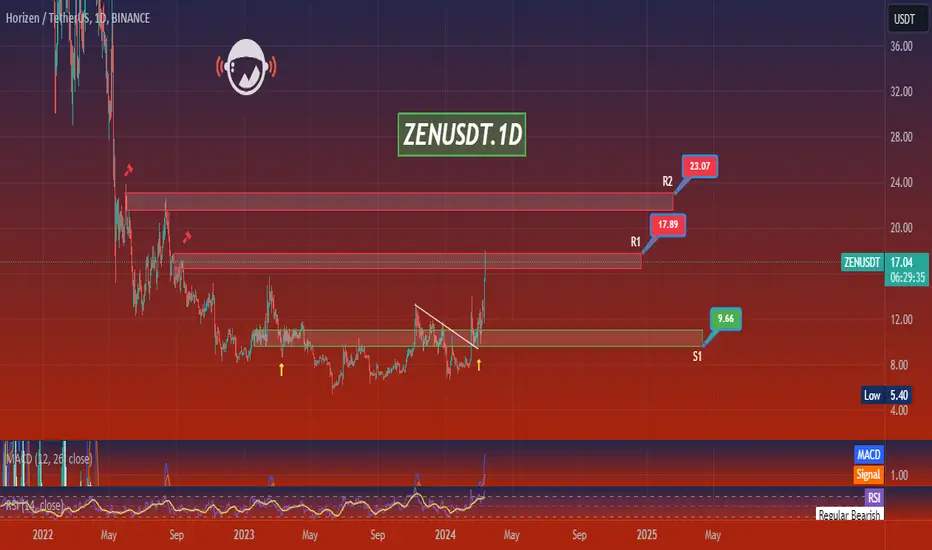
ZENUSDT.1DUpon reviewing the daily chart for ZEN/USDT, I observe the following from a technical analysis standpoint:
Bollinger Bands (BB): The price has made a decisive move above the upper Bollinger Band, which is often considered a signal of strong bullish momentum, although it can also suggest overbought conditions. The price extending above the band could mean that we're experiencing a period of high volatility.
Zig Zag Indicator: The Zig Zag lines show significant peaks and troughs, indicating a highly volatile market for ZEN. The latest movement shows a sharp increase in price.
Relative Strength Index (RSI): The RSI is currently around 68.45, which is nearing the overbought territory (70 and above), suggesting that the asset may be becoming overbought. However, it's not uncommon for the RSI to remain in overbought territory during a strong trend.
Moving Average Convergence Divergence (MACD): The MACD line is above the signal line and the histogram is positive, both of which suggest bullish momentum. The widening gap between the MACD line and the signal line emphasizes this bullish sentiment.
Volume: Again, volume isn't visible here, but it would be important to correlate the price movements with volume for confirmation. High volume would add confidence to the bullish signals.
Conclusion:
Based on this chart, I sense a strong bullish trend, underscored by the recent breakout above the upper Bollinger Band and positive MACD. However, given the RSI's proximity to the overbought zone, I would be cautious about a potential pullback or consolidation in the near future. My strategy would be to consider taking some profits while setting a trailing stop loss to protect from a downside. If I were looking to enter a new position, I would wait for a potential retracement or consolidation to avoid buying at a peak. It's crucial to monitor the RSI and MACD for signs of weakening momentum and be ready to adjust my position accordingly. Remember, while technical analysis can guide decisions, it's also important to consider fundamental factors and market news that could affect the price action.
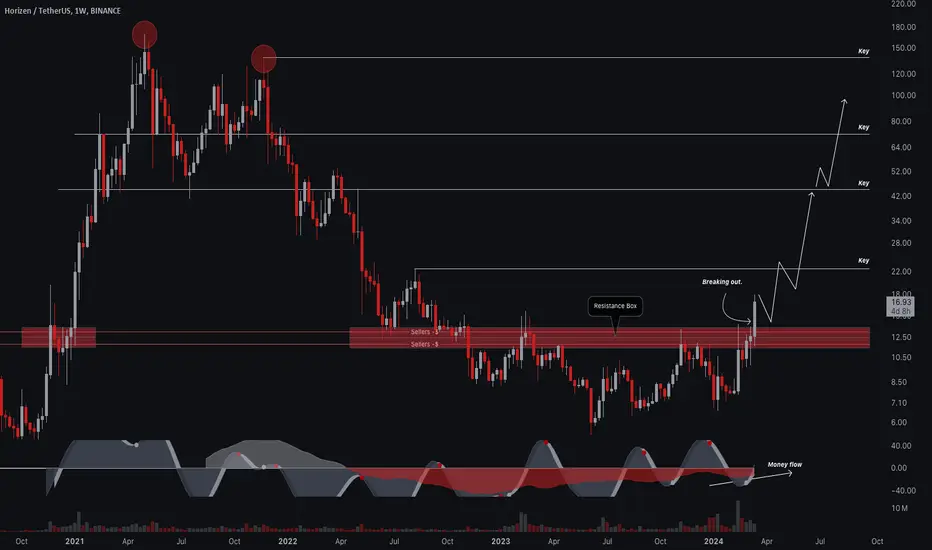
$ZEN #Horizen Trading IdeaZEN/USDT Horizen market structure remains bullish. Breaking through the red box (resistance zone) & the money flow tries to go upwards. The next target could be $22.50.
#ZEN/USDT#ZEN
The price is moving in an inverted trumpet pattern and sticking to its limits well
A breakout is underway
We have stability above the green support area at the $7 level
We have a higher stability Moving Average 100 in red
We have an uptrend on the RSI that the price is following well
Further upside is supported
Entry price is 11.66
First goal 13.23
Second goal 15.09
Third goal 17.47

Bullish trend ZENUSDT is showing no divergence, and showing a bullish continuation. Instant buying can be placed.
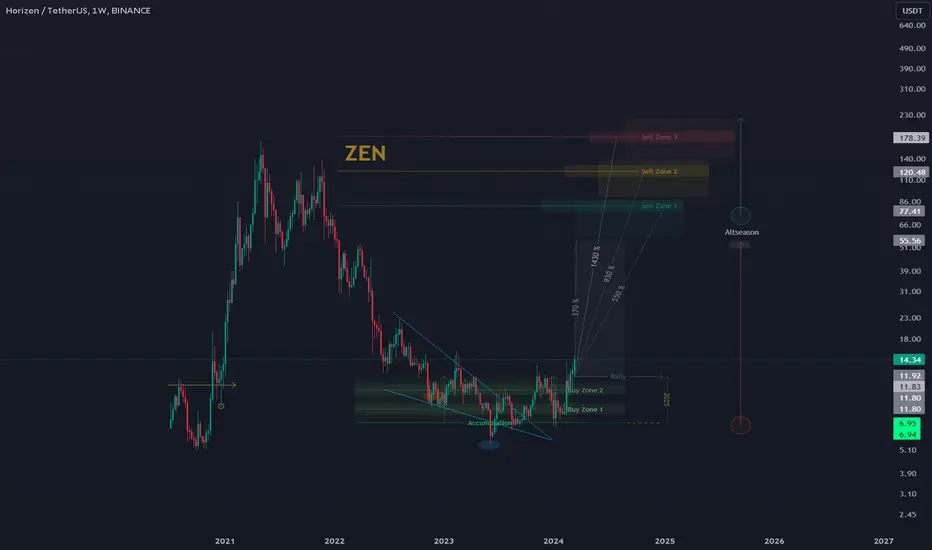
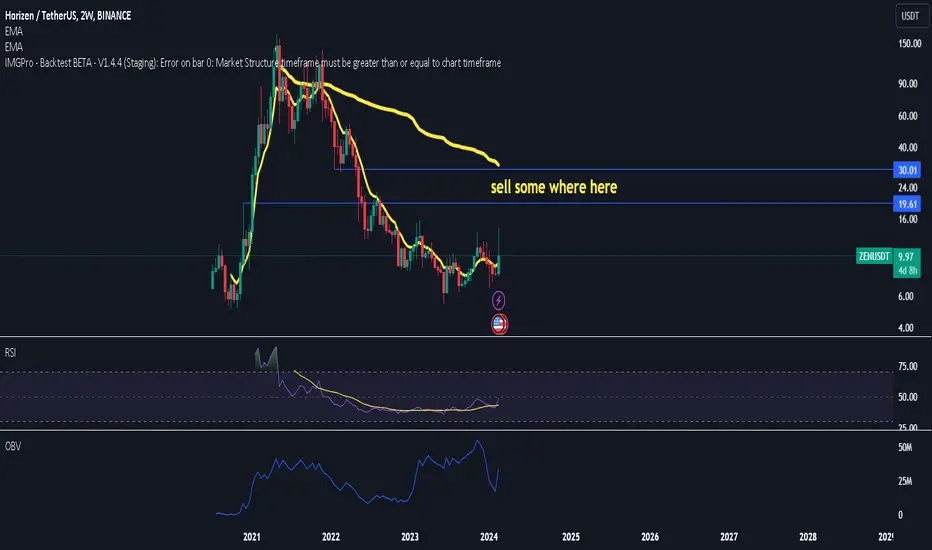
ZENUSDT | 1W 👀The coin has shown relatively good growth dynamics and has broken out of the descending channel with a breakthrough of the trend resistance (upper boundary).
It's better to limit risks in this case.
- Not financial advice, trade with caution.
✅ Stay updated on market news and developments that may influence the price of Horizen. Positive or negative news can significantly impact the cryptocurrency's value.
✅ Exercise patience and discipline when executing your trading plan. Avoid making impulsive decisions driven by emotions, and adhere to your strategy even during periods of market volatility.
✅ Remember that trading always involves risk, and there are no guarantees of profit. Conduct thorough research, analyze market conditions, and be prepared for various scenarios. Trade only with funds you can afford to lose and avoid excessive risk-taking.
#Crypto #Horizen #Investment #ZEN
ZENThe RSI and price of Zen indicate weakness, suggesting a bearish trend. Therefore, I have taken a short position.
#Zen #Zen
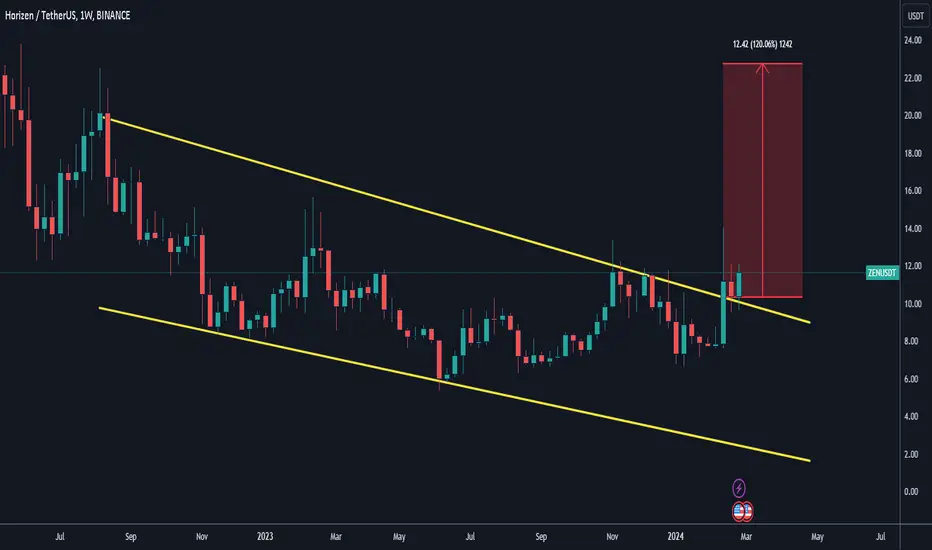
Zen has been trapped in a descending channel for some time now, but it is finally showing signs of breaking free. As Zen approaches the trendline, it is poised to erupt in a bullish rally of 150%.

ZEN AnalaysisBased on my analysis, Zen appears to have a bearish outlook. Let's observe the current situation and see what unfolds. At the moment, it seems to be Rejecting a one-hour Order Block
ZEN/USDT Primed for a Bullish Rally? 🚀👀 ZEN Analysis💎ZENUSDT is currently showcasing dynamic market movements, poised for a potential breakout from its descending channel pattern.
💎At present, #Horizen is experiencing lateral consolidation within a demand zone, which was once considered a supply area. There's a significant chance for the price to rebound from this zone and initiate an upward trend, aiming for the bearish OB area as its next milestone.
💎If ZEN does not manage to rebound and instead dips below the demand zone, it might regress to the Bullish OB area, around the $7.70 mark, in search of renewed impetus for an ascent.
💎The Bullish OB area has historically been a catalyst for notable recoveries upon its testing. Yet, a breach of this zone, affirming a bearish trajectory, could lead ZEN to seek bullish signals from a further depth.
💎Failing to find upward momentum from this subsequent level could perpetuate a downward trend for ZEN. Rest assured, we are here to navigate you through these market shifts.

ZENUSDT IDEAUPDATE
Broken Falling Wedge in Weekly Time frame Positively.
If holds over broken level, 100-120% increase in price may be seen
COIN DETAILS
Horizen (ZEN) Price today is $10.37, for the last 24 hours 964,463 ZEN coins were exchanged with a trading volume of $10,004,091. It's currently traded on 21 exchanges. The price is down by (-0.75%) for the last 24 hours. It has a circulating supply of 7 million ZEN coins and is ranked #393 by current Horizen market cap of $75 million.
ZENUSD 1WLSE:ZEN ~ 1W
#ZEN Long Accumulation is over, Sooner or later this will be successfully broken through and the Rocket will fly soon, Minimum Target 20%
[$ZEN] I never heard of this but looks good ...Long for now, no future trading pairs :( ... buy at best price now and sell when you are happy about your profits ... ;)
ZENUSDT.PHM signal v3.0 (High momentum) spotted. Looking good with previous wave up with increasing volume and momentum.
- Heathy retracement and support well at good level @ 10.087-10.330
- Trending slow and steady if able to hold above the support zone
It is at extremely good reward to risk level now if able to hold above the support level.
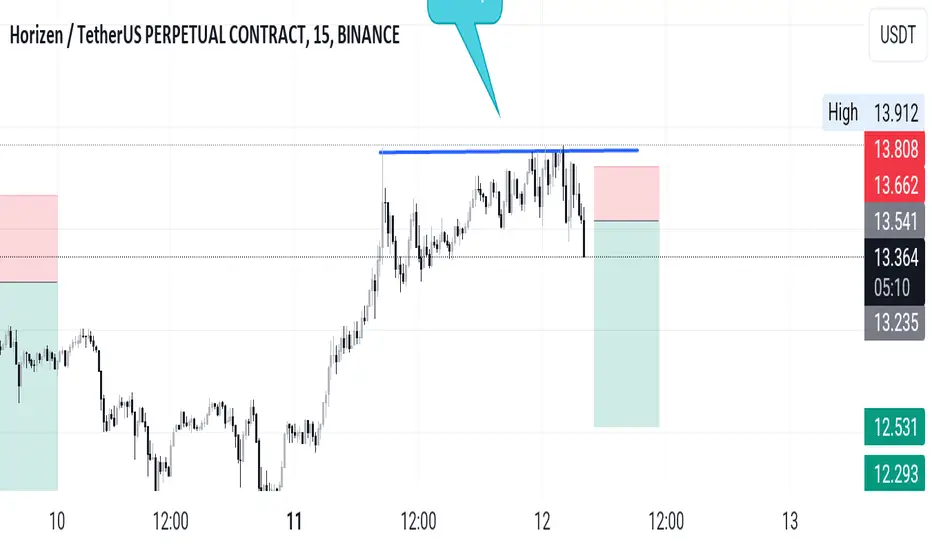
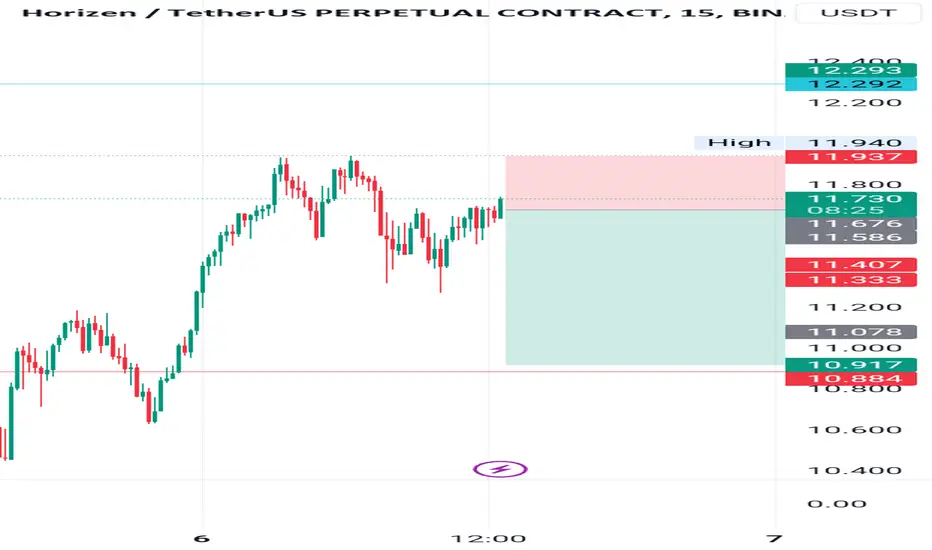
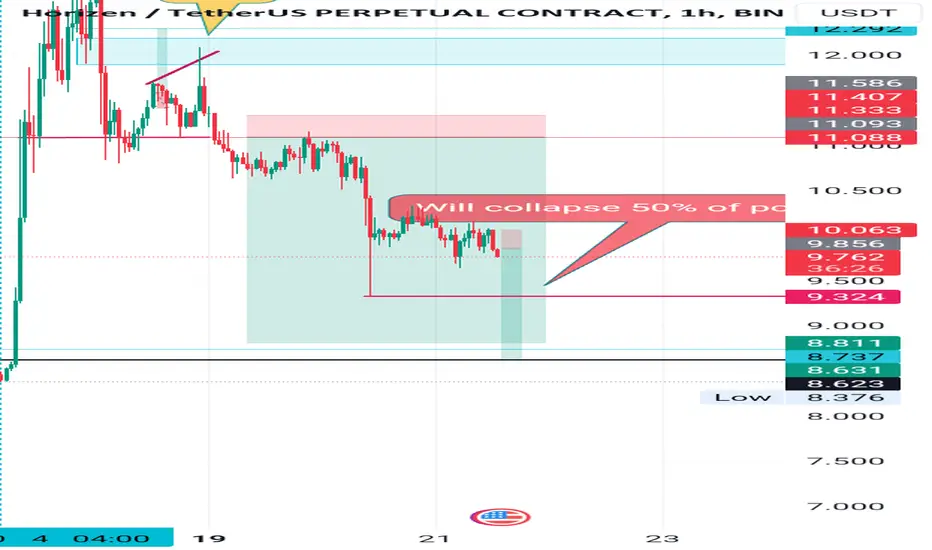
Zen bearish continuation I plan to take profit at the low of the wick, as there is weakness observed on the 15-minute timeframe.
$zenbtc pair chilling above the 200 ema on the H4
had a nice candle with volume yesterday so along as we hold the 7 on the weekly
swing trade
like the rsi and obv along with the btc pair attempting to show strength
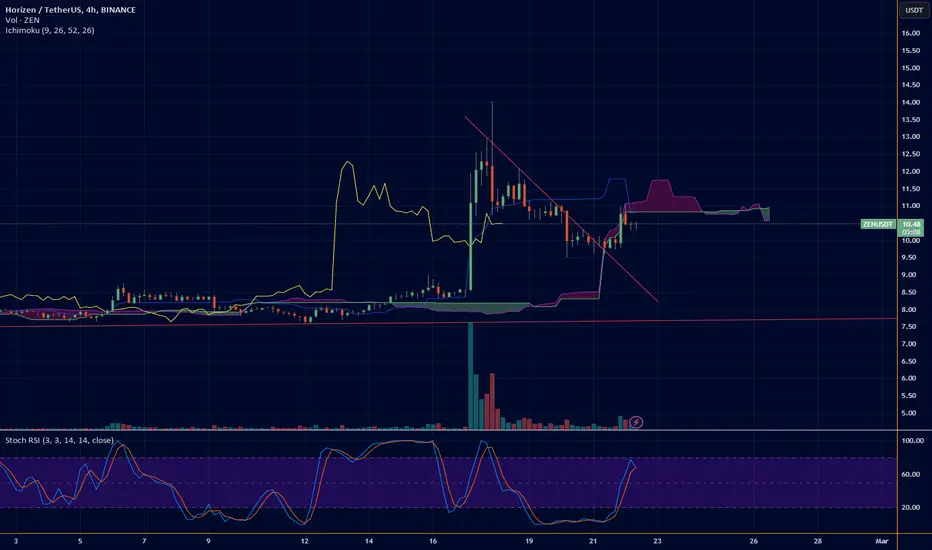
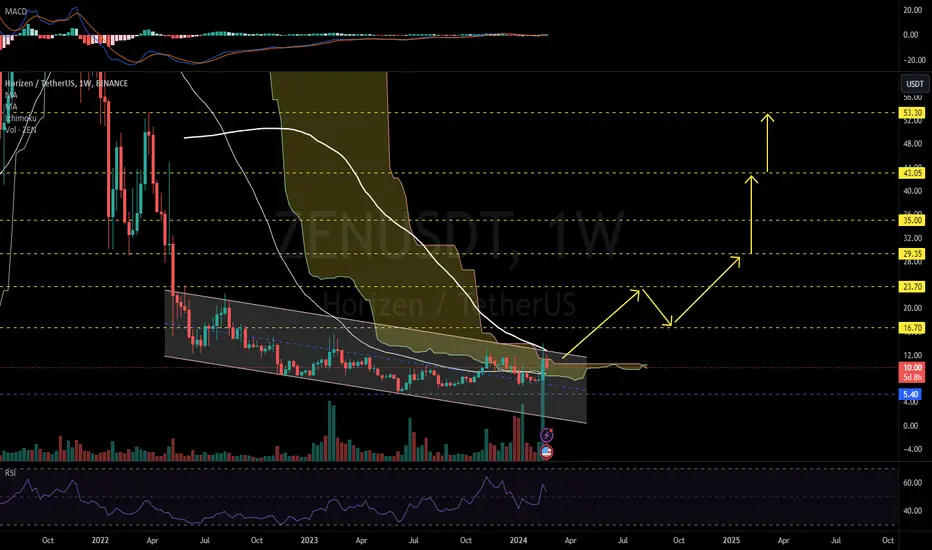
ZENUSDT 1W#ZEN is moving inside a Descending Channel on weekly chart. We had a volume spike last week and price has broke the weekly MA50, which is a bullish sign.
#ZEN is trying to get out of the Ichimoku cloud. In the next step we have descending line and weekly MA100. Wait for breakout and then enter to this coin.
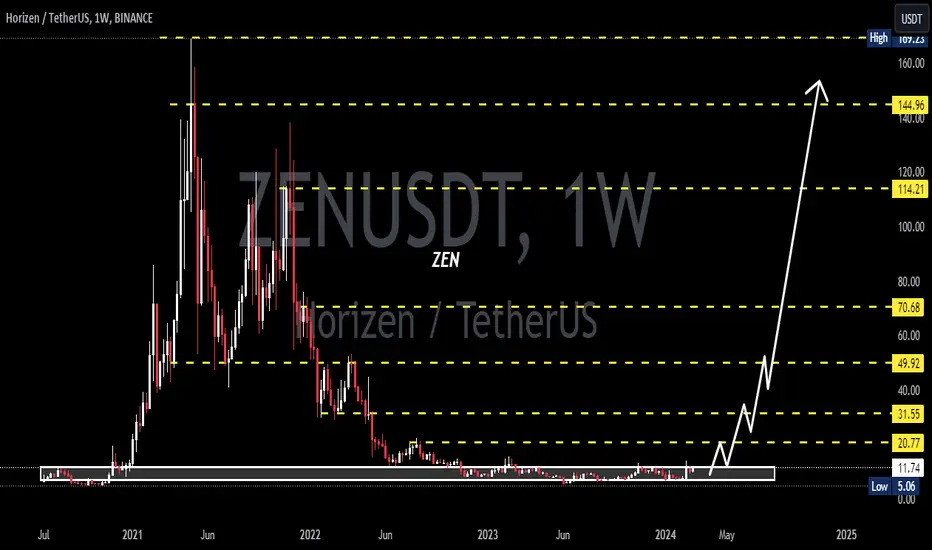
Targets are:
$16.70 $23.70 $29.35 $35.00 $43.05 and $53.30
If price goes like what I said, we will have a big rounding bottom, which is another bullish pattern. Let see what will happen next.
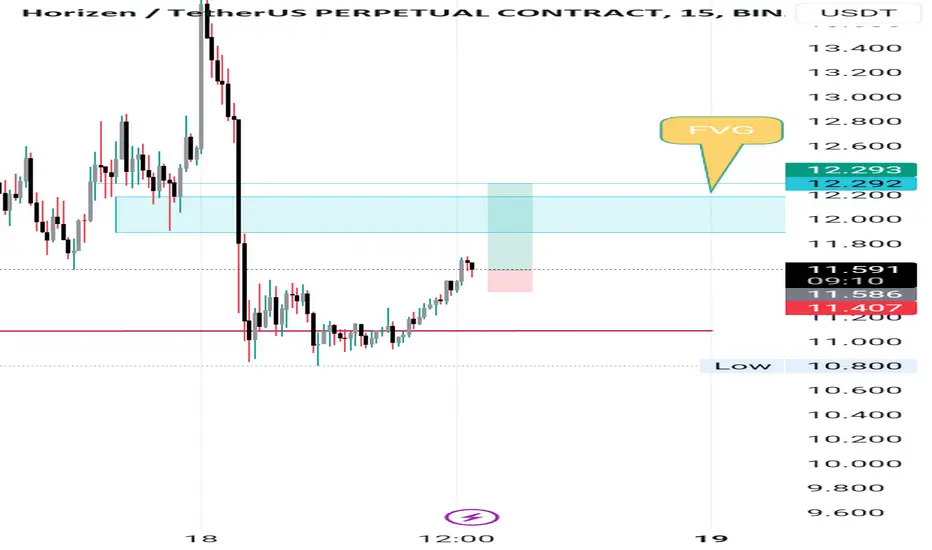
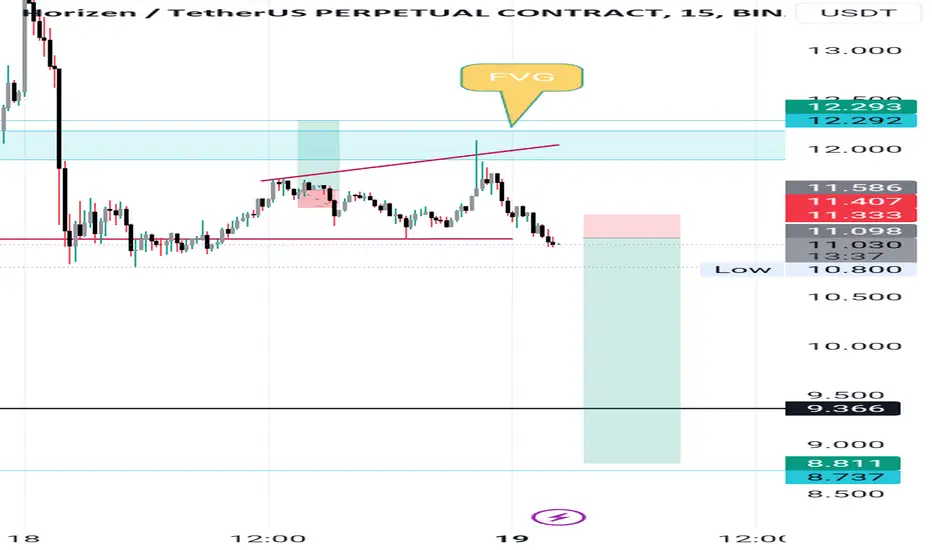
Zen is very bearish!!🐻 Zen is strongly rejecting the fair value gap and displaying weakness, with a risk-reward ratio of 1 to 8. It is important to secure profits along the way.
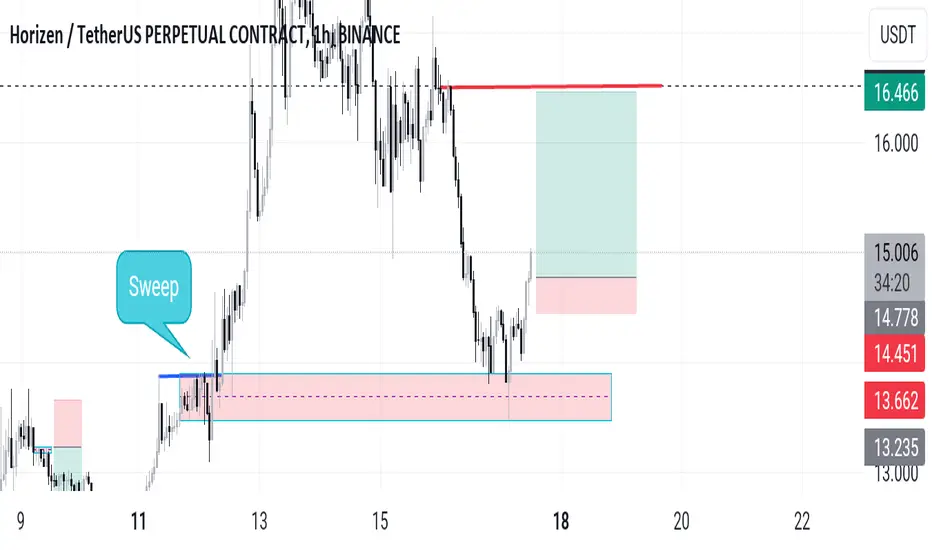
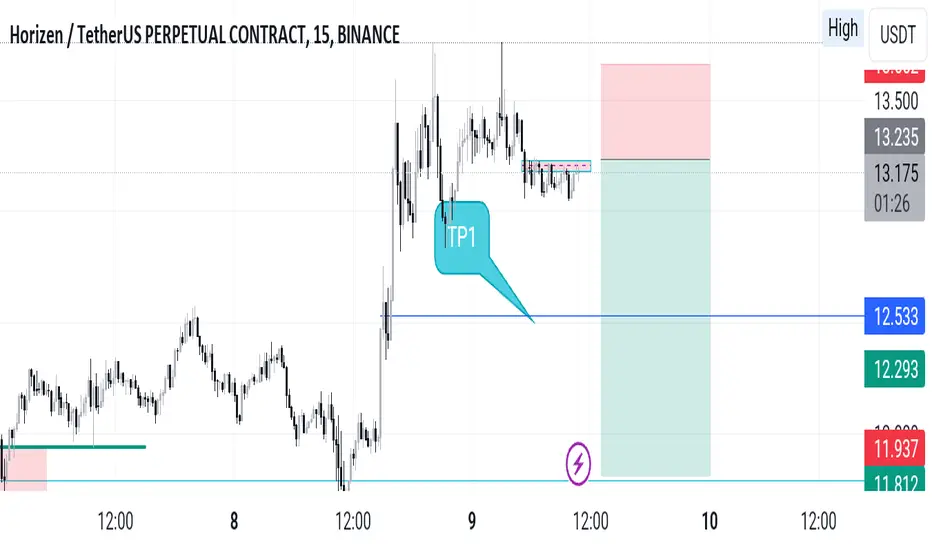
Zen to push up againPrevious lows swept after bullish impulse. liquidity pool hit after retrace, with nice looking reaction on lower time frame. My take profit target is around the 13usd
ZEN will continue to go up after the PullbackZEN will continue to go up after the Pullback.
🔵Entry Zone 10.34 - 10.89
🔴SL 9.39
🟢TP1 11.33
🟢TP2 12.98
🟢TP3 14.29
Risk Warning
Trading Forex, CFDs, Crypto, Futures, and Stocks involve a risk of loss. Please consider carefully if such trading is appropriate for you. Past performance is not indicative of future results.
If you liked our ideas, please support us with your likes 👍 and comments.

ZEN/USDT - Zen Magic is waiting to happen | +340% Profit Scope🫰#ZEN/USDT - Description
---------------------------------------------------------------
+ ZEN just bounced back from the support
+ Now its just close to the resistance range around 8.6, this area is critical for the prize
+ Breakout from this resistance is critical for the next leg of the run.
---------------------------------------------------------------
VectorAlgo Trade Details
------------------------------
Entry Price: 8.76
Stop Loss: 7.49
------------------------------
Targets 1: 9.18
Targets 2: 9.62
Targets 3: 10.38
Targets 4: 11.76
------------------------------
Timeframe: 4H
Capital: 1-2% of trading capital
Leverage: 5-10x
---------------------------------------------------------------
Enhance, Trade, Grow
---------------------------------------------------------------
Agree or Disagree with the ideas ? lets discuss in the comments.
Like and follow us for more ideas.
Regards
VectorAlgo

Zen long!🧘♂The market needs to retrace back to fair value before a significant correction. I am currently looking to go long.