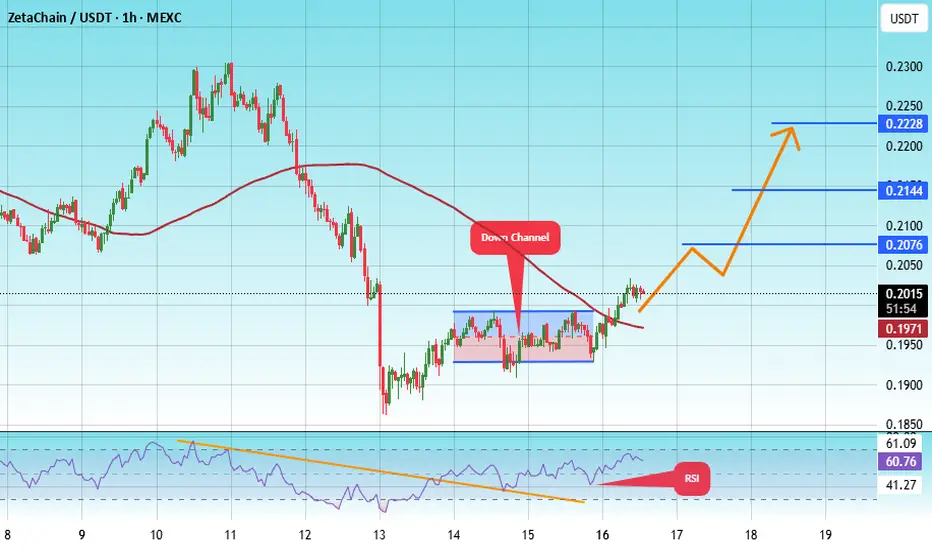
#ZETA/USDT#ZETA
The price is moving within a descending channel on the 1-hour frame, adhering well to it, and is heading towards a strong breakout and retest.
We are experiencing a rebound from the lower boundary of the descending channel. This support is at 0.1933.
We are experiencing a downtrend on the RS
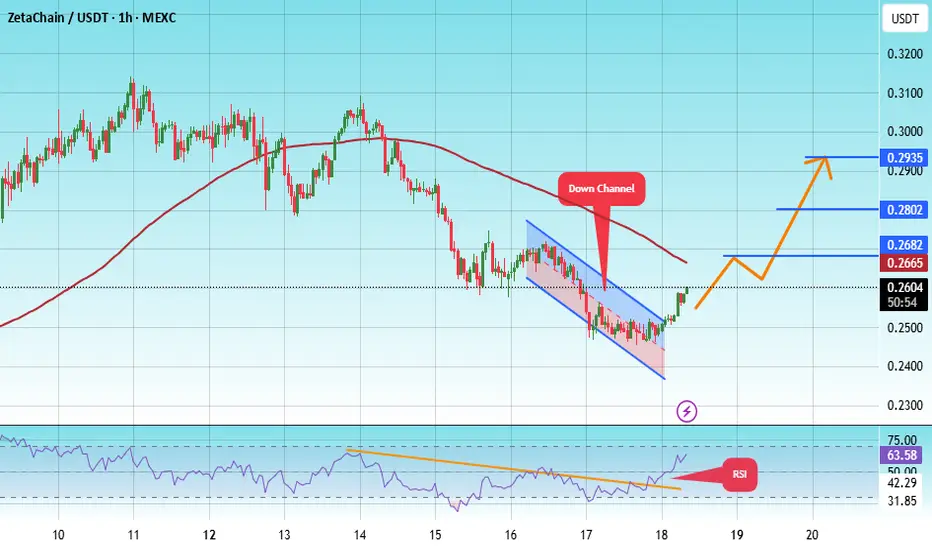
#ZETA/USDT#ZETA
The price is moving within a descending channel on the 1-hour frame, adhering well to it, and is on its way to breaking it strongly upwards and retesting it.
We are seeing a rebound from the lower boundary of the descending channel, which is support at 0.2386.
We have a downtrend on the RSI
#ZETA/USDT#ZETA
The price is moving within a descending channel on the 1-hour frame and is expected to continue upward.
We have a trend to stabilize above the 100 moving average once again.
We have a downtrend on the RSI indicator that supports the upward move with a breakout.
We have a support area at th
#ZETA USDTEvery high is an opportunity to get out, don't miss the opportunity to buy at low prices
Don't rush to buy, soon the prices of all coins will return to where they started.
Do not trade futures in this market, only spot.
Please check all my previous analyses, all of them came true

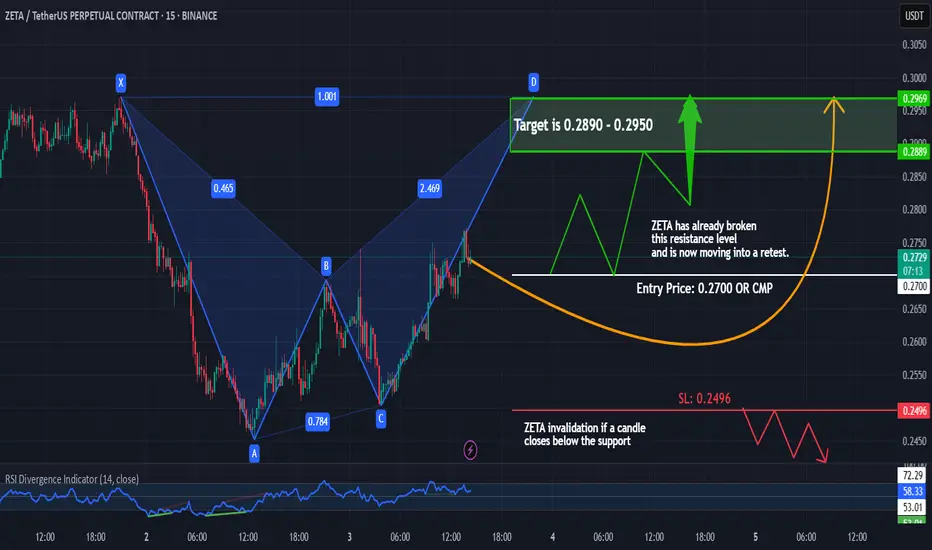
ZETA: Bullish Setup with Harmonic Pattern & Breakout Retest! Timeframe: 15-Minutes
Pattern: Harmonic Formation
Breakout & Retest Confirmation
#ZETA has formed a bullish harmonic pattern and successfully broken above resistance. Currently, it's retesting the breakout zone, a classic confirmation for a strong upside move!
Why This is a High-Probability L
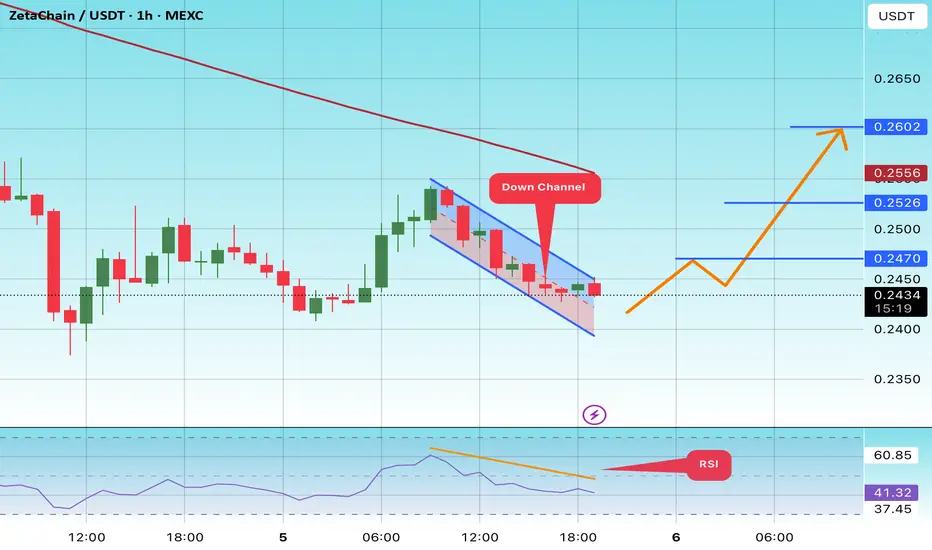
#ZETA/USDT#ZETA
The price is moving within a descending channel on the 1-hour frame and is expected to continue lower.
We have a trend to stabilize below the 100 moving average once again.
We have a downtrend on the RSI indicator, supporting the upward move with a breakout.
We have a resistance area at th
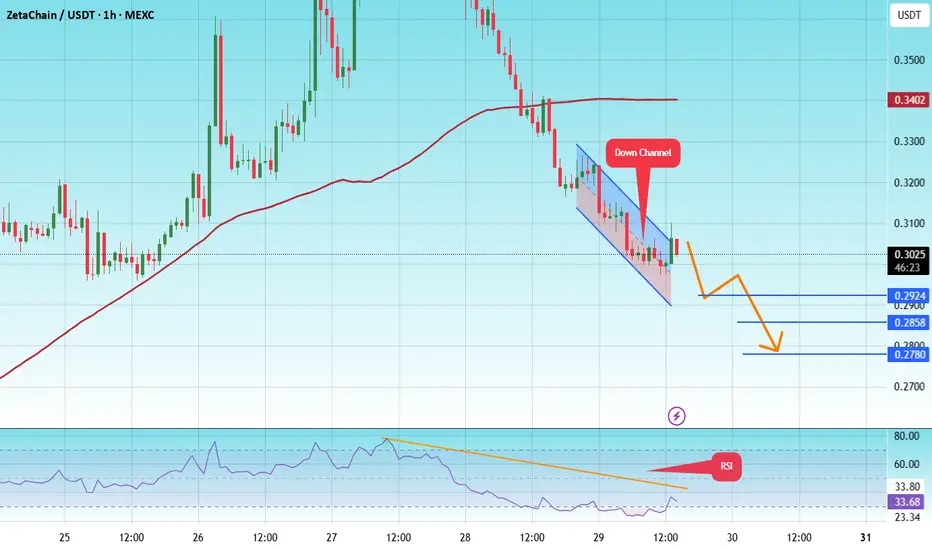
#ZETA/USDT#ZETA
The price is moving within a descending channel on the 1-hour frame, adhering well to it, and is heading for a strong breakout and retest.
We are seeing a bounce from the lower boundary of the descending channel, which is support at 0.3013.
We have a downtrend on the RSI indicator that is a

$ZETA trading setup### **Trading Setup for ZetaChain (ZETA/USDT) on Gate.io (30-Min Chart)**
#### **Chart Analysis:**
- The chart follows **Elliott Wave Theory**, displaying a **five-wave impulse pattern**.
- The price action suggests a bullish trend with clear **Wave 1, Wave 2, Wave 3, Wave 4, and a potential Wave 5

ZetaChainThe price has currently corrected well. However, it is expected to correct another 20 to 30 percent. I see around $0.2026 as the bottom for this currency, and from there, it could start its move towards $0.8. If the bottom of $0.2026 is lost under any circumstances, there will be no barrier to holdi

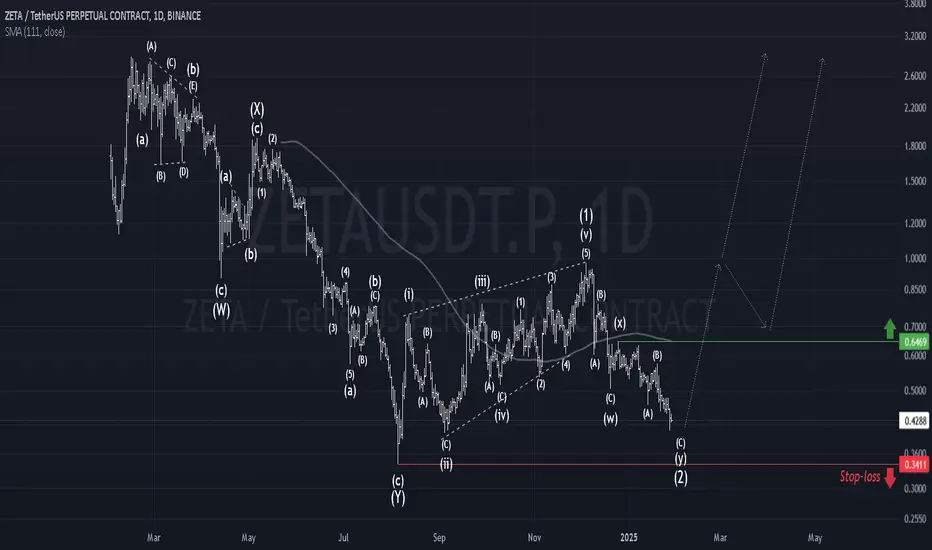
ZETA Critical Support#ZetaChain is showing bullish potential in its current price zone.
Breaking $0.341 invalidates the idea (stop-loss).
Passing $0.647 confirms a bullish trend.
See all ideas
Summarizing what the indicators are suggesting.
Oscillators
Neutral
SellBuy
Strong sellStrong buy
Strong sellSellNeutralBuyStrong buy
Oscillators
Neutral
SellBuy
Strong sellStrong buy
Strong sellSellNeutralBuyStrong buy
Summary
Neutral
SellBuy
Strong sellStrong buy
Strong sellSellNeutralBuyStrong buy
Summary
Neutral
SellBuy
Strong sellStrong buy
Strong sellSellNeutralBuyStrong buy
Summary
Neutral
SellBuy
Strong sellStrong buy
Strong sellSellNeutralBuyStrong buy
Moving Averages
Neutral
SellBuy
Strong sellStrong buy
Strong sellSellNeutralBuyStrong buy
Moving Averages
Neutral
SellBuy
Strong sellStrong buy
Strong sellSellNeutralBuyStrong buy
Displays a symbol's price movements over previous years to identify recurring trends.