ZKUSDT 2D AnalysisZK ~ 2D Analysis
#ZK This trade is very risky, buy if you still have confidence in this coin with a short term target of at least 15%+ from here.
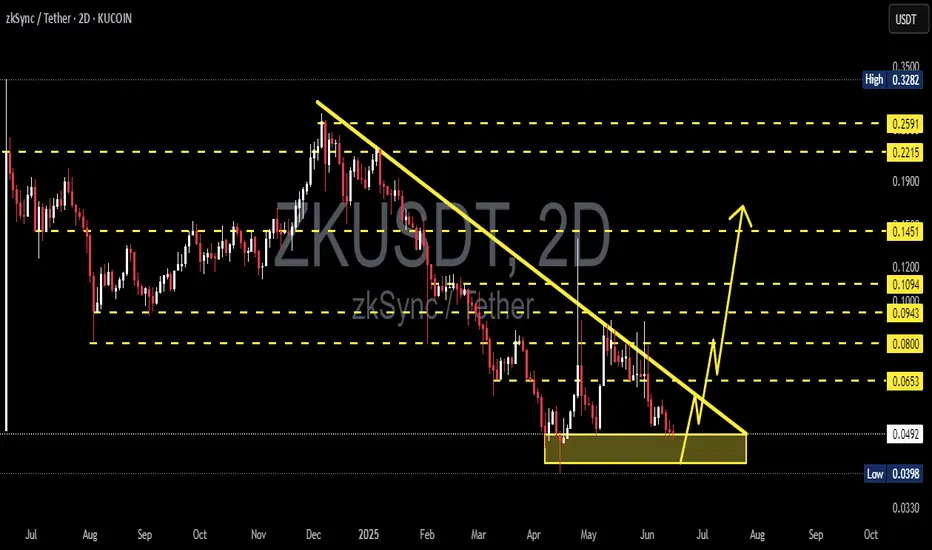
Need to be careful.A new downward wave may occur. Need to pay attention.
The market is very enthusiastic about Ethereum, we need to be cautious in these exciting moments.
* The purpose of my graphic drawings is purely educational.
* What i write here is not an investment advice. Please do your own research before in
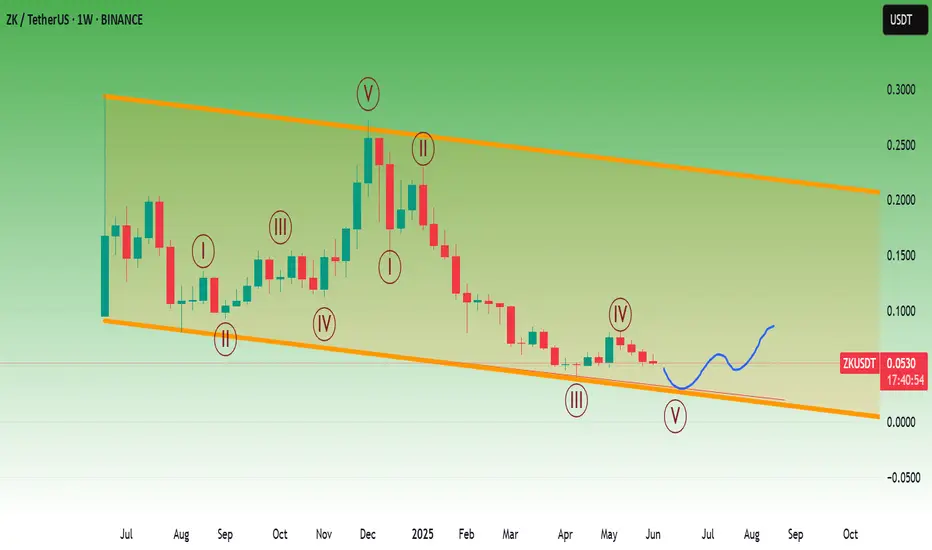
ZK/USDT Buy the Silence?A familiar cycle:
▪️ Hype peak
▪️ -80%+ crash
▪️ Silence
▪️ Consolidation
We're likely somewhere between phase 3 and 4.
Retail has moved on. Volume is dead.
But the chart is quietly forming a structure.
This is when real positions are built — the kind people tweet about after the breakout.
While
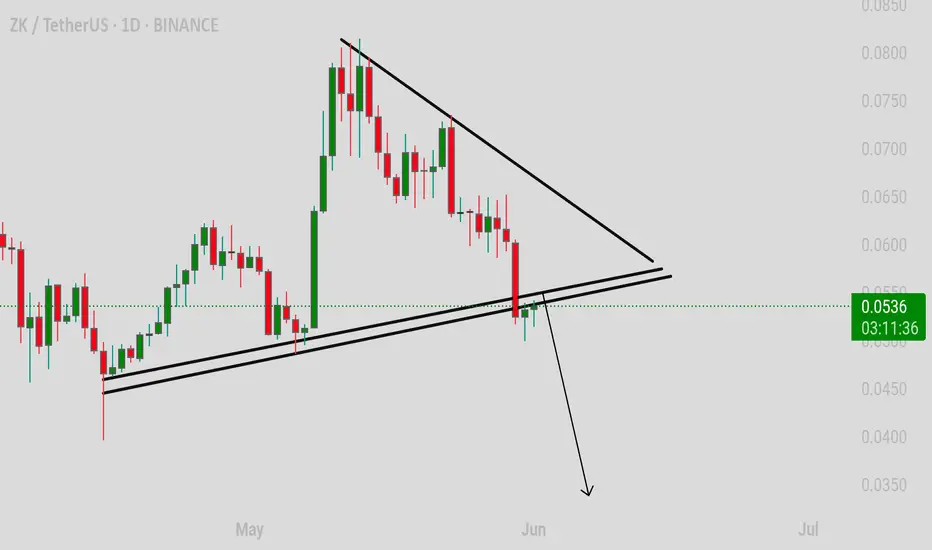
ZKUSDT breakdown alertZKUSDT breakdown alert
ZKUSDT has broken down from a triangle pattern, signaling potential bearish momentum. The price has slipped below the triangle’s lower support line, suggesting that sellers are gaining control and further downside could follow if the move holds.
This kind of pattern breakdow
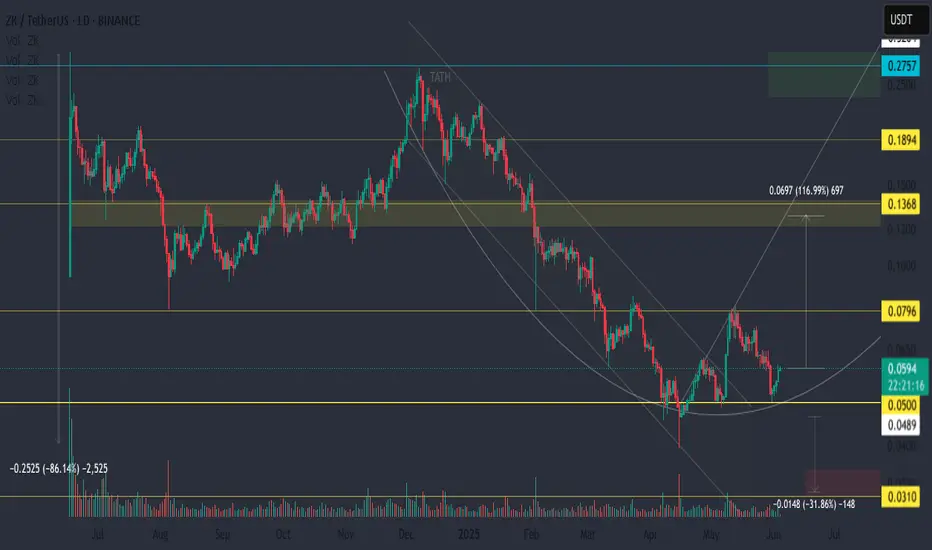
ZKUSDT 1D AnalysisZK ~ 1D Analysis
#ZK Buy incrementally on retest of this support block with short term target of at least 15%+ from here and long term target of $0.2727

long term sideways movement, good potential next bull runlong term sideways movement, good potential next bull run

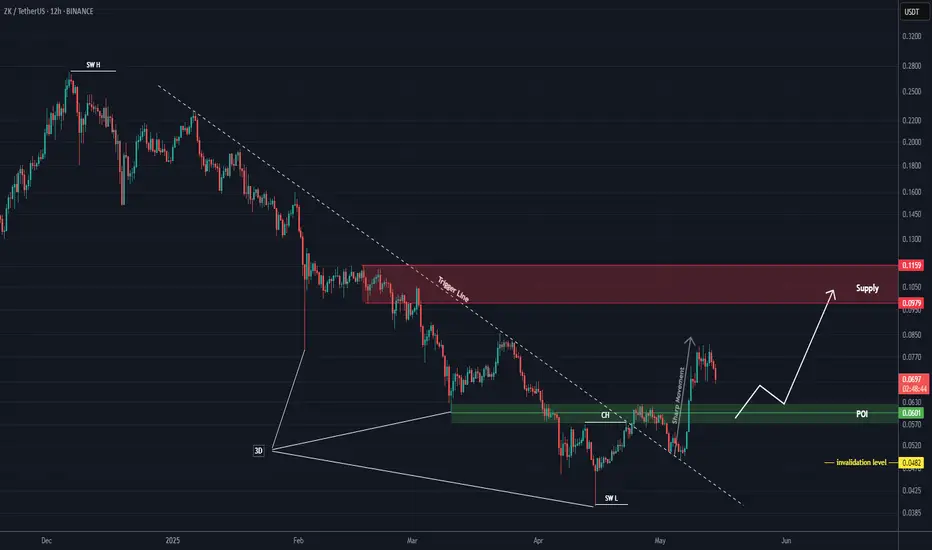
ZK Aanalysis (12H)After forming a 3D bottom, the price moved upward with a strong and rapid bullish wave that was stronger than the previous bullish waves within the bearish move, reclaiming a key zone. Additionally, an important trigger line has been broken, which strengthens the bullish outlook on ZK.
We are looki
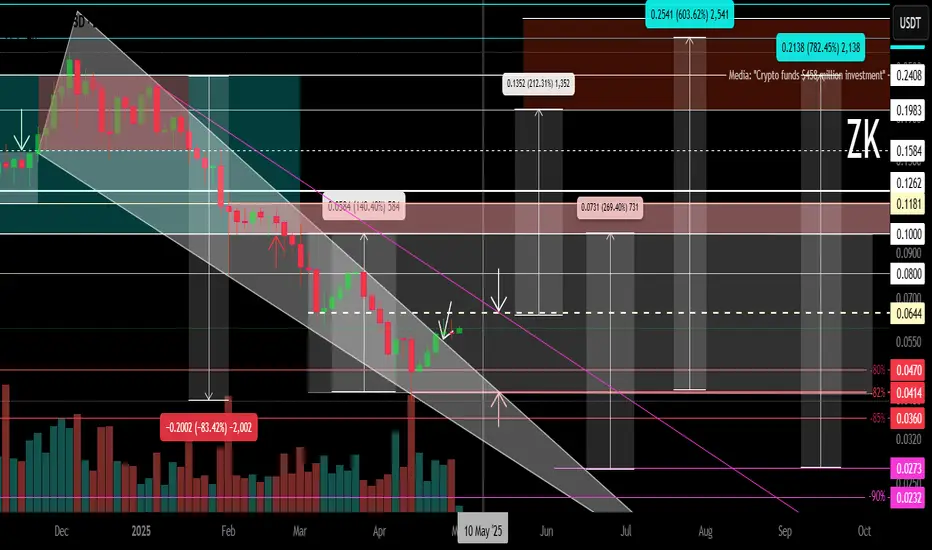
ZK Secondary trend.-82% Wedge. Reversal zones. 01 05 2025Logarithm. Time frame 3 days. Decrease from listing about -82%. For cryptocurrencies of such liquidity and capitalization, this is not the maximum decrease (-90-96%). But sometimes from such values as now (-82-85%), taking into account the news hype during the listing "whales $ 458 million", a rev
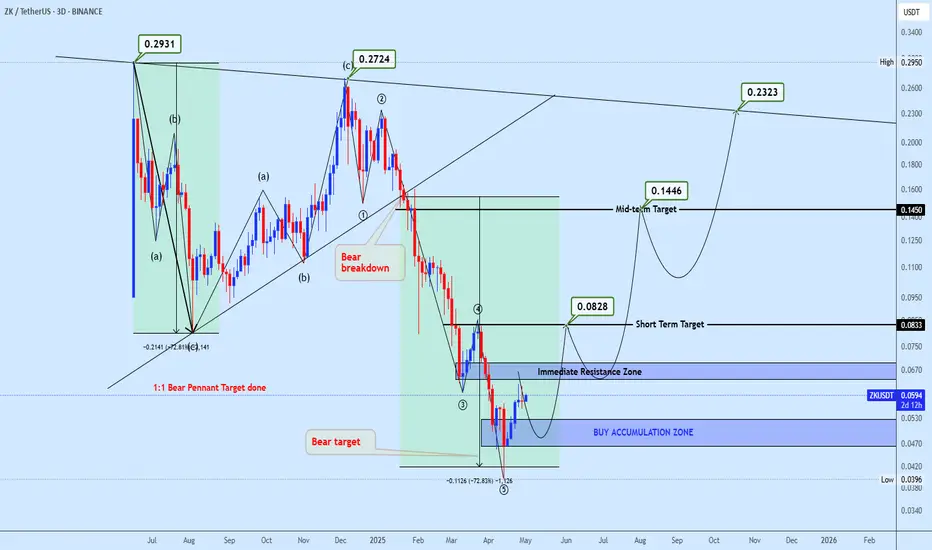
Zkusdt trade opportunityZK has completed a 1:1 Bear Pennant Breakdown, perfectly meeting its projected downside target with a -72.83% measured move. This confirms the exhaustion of the previous bearish leg and sets the stage for a potential bullish reversal.
With the bear cycle target achieved, bulls are now likely to reg
ZKUSDT 2D AnalysisZK ~ 2D Analysis
#ZK Buy back from here with a short -term target of at least 15%+ from here.

See all ideas
Summarizing what the indicators are suggesting.
Oscillators
Neutral
SellBuy
Strong sellStrong buy
Strong sellSellNeutralBuyStrong buy
Oscillators
Neutral
SellBuy
Strong sellStrong buy
Strong sellSellNeutralBuyStrong buy
Summary
Neutral
SellBuy
Strong sellStrong buy
Strong sellSellNeutralBuyStrong buy
Summary
Neutral
SellBuy
Strong sellStrong buy
Strong sellSellNeutralBuyStrong buy
Summary
Neutral
SellBuy
Strong sellStrong buy
Strong sellSellNeutralBuyStrong buy
Moving Averages
Neutral
SellBuy
Strong sellStrong buy
Strong sellSellNeutralBuyStrong buy
Moving Averages
Neutral
SellBuy
Strong sellStrong buy
Strong sellSellNeutralBuyStrong buy
Displays a symbol's price movements over previous years to identify recurring trends.