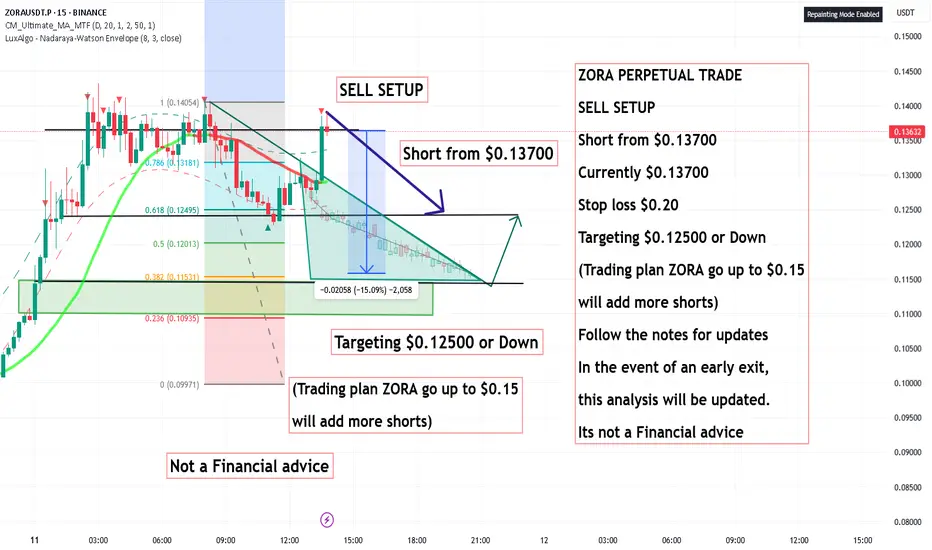
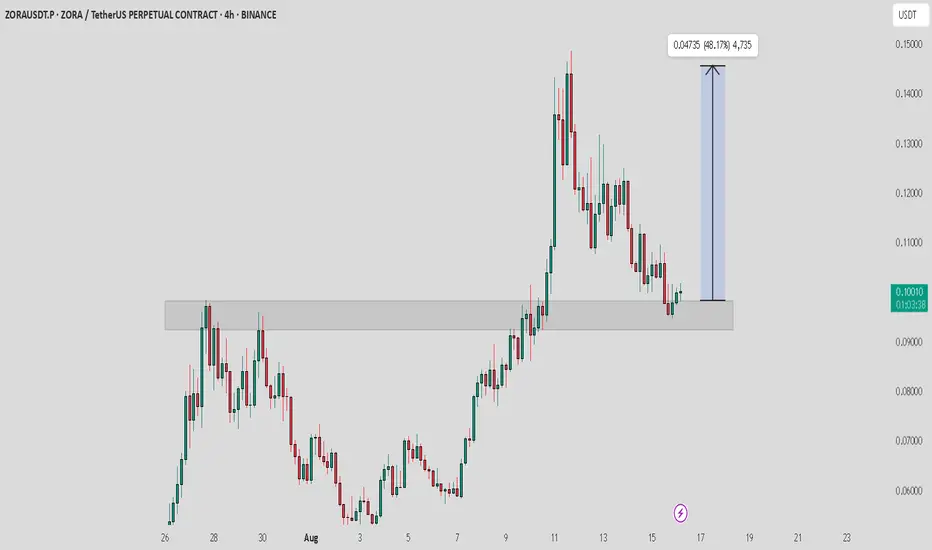
ZORA PERPETUAL TRADE , Short from $0.13700ZORA PERPETUAL TRADE
SELL SETUP
Short from $0.13700
Currently $0.13700
Stop loss $0.20
Targeting $0.12500 or Down
(Trading plan ZORA go up to $0.15
will add more shorts)
Follow the notes for updates
In the event of an early exit,
this analysis will be updated.
Its not a Financial advice
ZORAUSDT.P trade ideas
ZORA Long x7Jump in
Entry $0.126
SL $0.112
Target $0.1464 - Sell 50% then B/E
Final $0.23
Risk 4/10
Market is very Bullish
Large SL, need to move it up once trade start to work

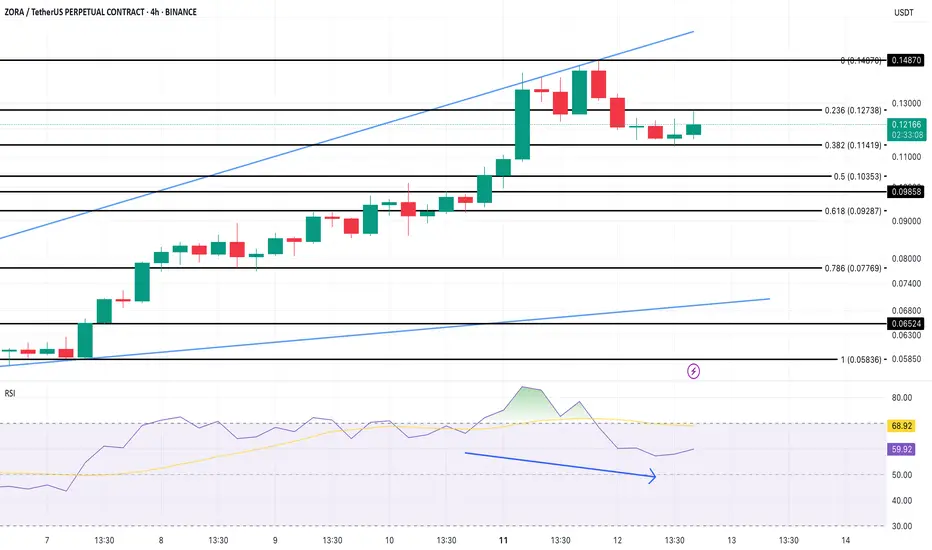
ZORA Price Pause Hints At Hidden Bullish ReboundBINANCE:ZORAUSDT.P ’s explosive 80% rally in the past week has hit resistance at $0.14, and price is now holding at the $0.11 support zone — the key level that could decide its next move. On the 4-hour chart, the RSI is flashing a hidden bullish divergence: price has made higher lows while RSI made lower lows, often a sign of consolidation within a strong trend.
On-chain data from Nansen shows whales accumulated nearly 70 million ZORA during the rally, even as short-term “smart money” trimmed positions. Exchange balances have dropped consistently since early August, meaning fewer tokens are available for quick selling.
The structure on shorter timeframes still favors the bulls. BINANCE:ZORAUSDT.P is trading inside an ascending broadening wedge, with the $0.148 zone as the next resistance. A clean break above this could pave the way for a retest of the all-time high — and potentially new highs if NFT minting activity remains strong.
If $0.11 holds, the bullish structure stays intact; lose $0.09, and the short-term bias flips bearish. For now, buyers remain in control.
Buy Trade Strategy for ZORA: Empowering the Creator EconomyDescription:
This trading idea highlights ZORA, a Web3 protocol focused on revolutionizing the creator economy through decentralized NFT marketplaces and permissionless minting. ZORA empowers artists, developers, and communities to create, sell, and distribute digital assets without intermediaries, fostering an open and fair digital economy. With the rising adoption of NFTs and the growing shift towards decentralized ownership, ZORA’s innovative infrastructure positions it as a strong contender in the blockchain-powered creative sector. Its emphasis on accessibility, community governance, and scalability gives it significant long-term potential.
Nonetheless, the cryptocurrency market remains highly volatile, and ZORA is not immune to rapid price fluctuations influenced by regulatory developments, macroeconomic events, and evolving market sentiment. Investors should approach with a clear risk management plan and avoid overexposure.
Disclaimer:
This trading idea is for educational purposes only and should not be taken as financial advice. Trading cryptocurrencies like ZORA carries substantial risks, including the possibility of a total loss of investment. Always conduct your own due diligence, assess your financial position, and consult with a qualified financial advisor before making any investment decisions. Past performance is not indicative of future results.
ZORA / USDT : Short term bullish rally expectedZORA/USDT is showing strong potential for a short-term bullish rally. The price is bouncing back from support and is nearing a breakout from the trendline on the 1H timeframe.
Keep a close watch for the breakout, but always manage your risk properly.
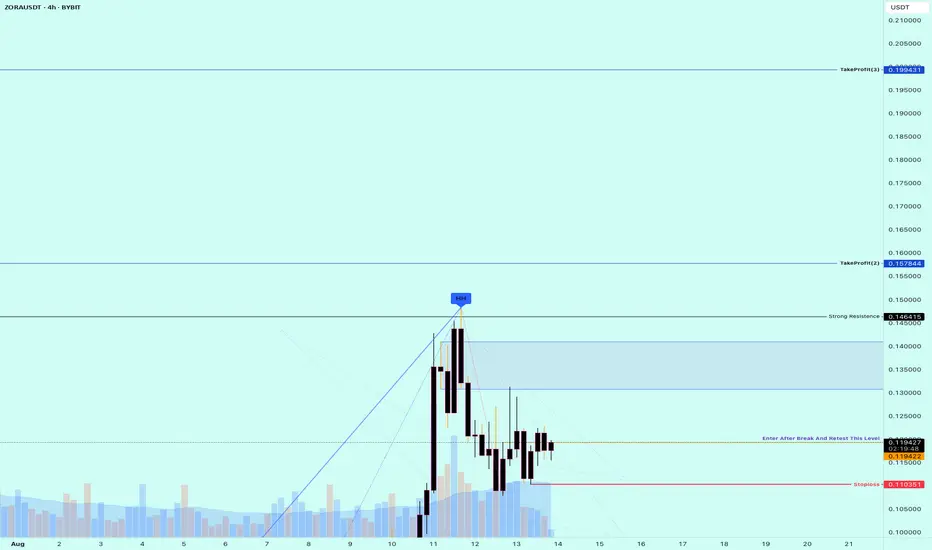
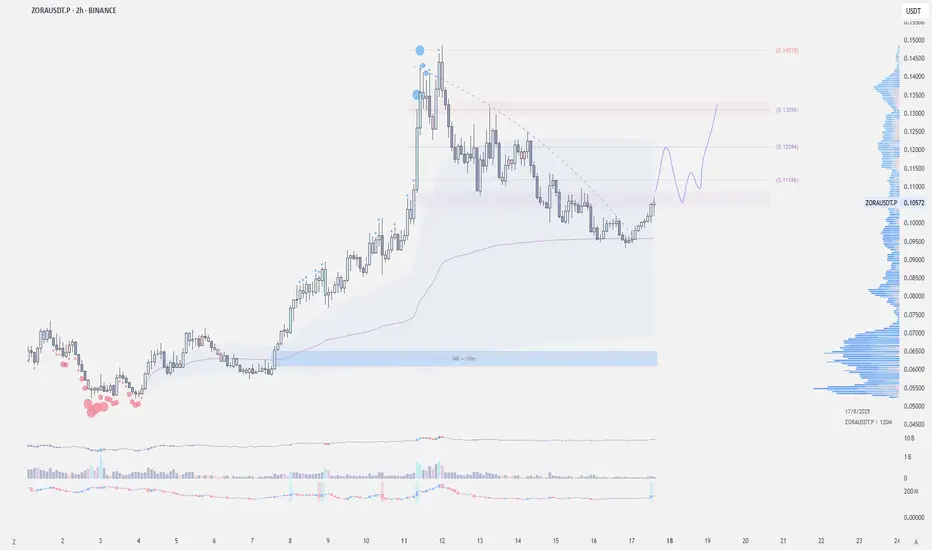
$ZORA is gearing up for the Next Move UpBYBIT:ZORAUSDT | 2h
Price held support at vwap .093, marking local demand.
Acceptance above the .108 value area opens potential for a retest of .12–.125
If rejected in this level, ideally price needs to flip .108 into support to continue higher toward the .15–0.16 zone.
Next predictions for ZoraI see two scenarios for Zora on the chart, one scenario is a head and Shoulder pattern , which pushes Zora down .
and the next scenario is the possibility of another bullish wave.
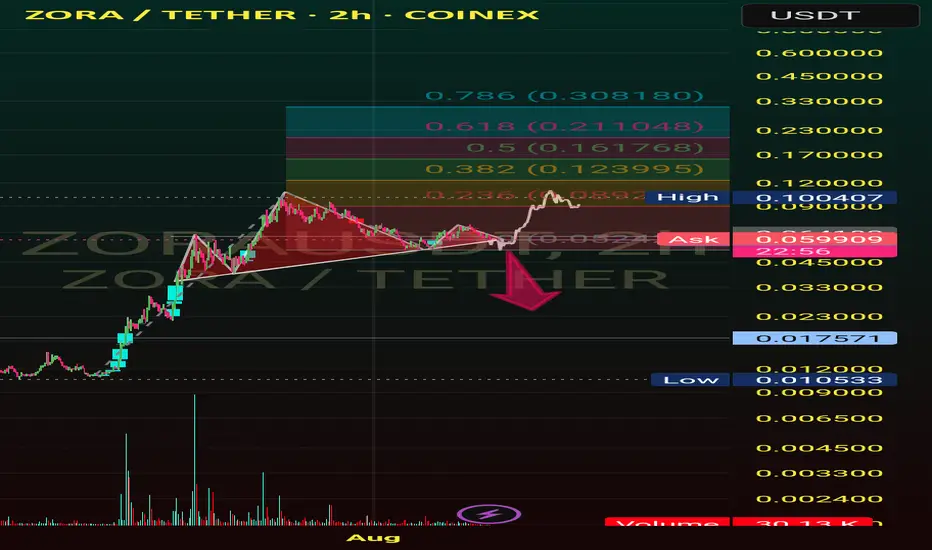
Cypher patternI see a Cypher Pattern on this chart, which could correct to lower areas for now. Again, please trade with your own analysis, I am not responsible for your profits or losses.📉

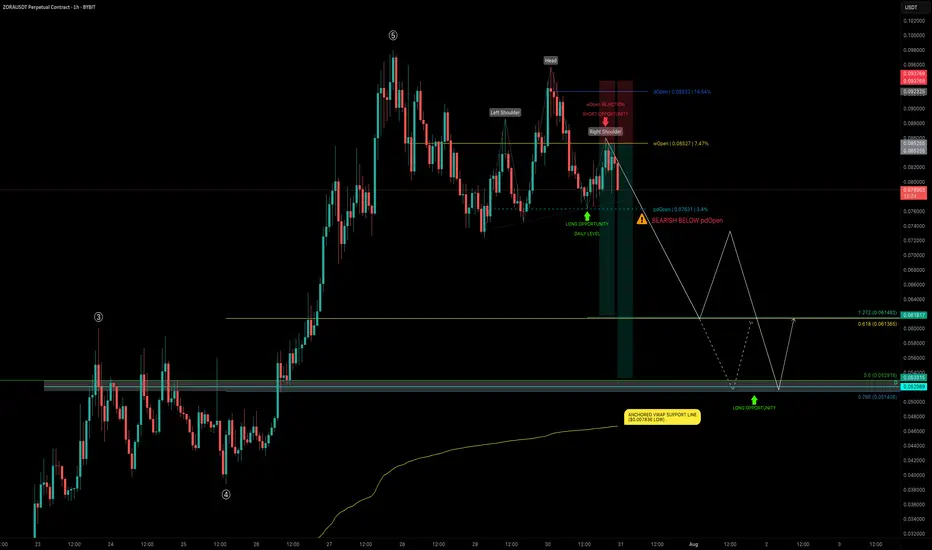
ZORA 5-Wave Completion — 30% Crash Incoming?After exploding +1150% in just 20 days and completing all 5 waves, ZORA is now consolidating — trading sideways just under the $0.10 psychological level for the past 4 days.
📉 Current Market Structure
The current structure shows signs of a developing Head & Shoulders pattern, with price:
Trading below the daily open (dOpen) and weekly open (wOpen) → Bearish signs
Hovering near the prior daily open (pdOpen) → a breakdown here would confirm bearish continuation
🔴 Short Setup - Bearish Scenario
If ZORA breaks below pdOpen, we’re likely heading for:
0.618 Fib retracement at $0.06137 of the final wave 5
Confluence with 1.272 Trend-Based Fib Extension (TBFE) at $0.06148
This zone marks the next high-probability reaction point and a potential long opportunity if price shows a bounce or reversal.
📉 Overall Short Trade Target
The full retracement target sits between $0.0529 and $0.0514, offering multiple layers of confluence:
0.5 Fib retracement of the full 1150% move
0.786 Fib retracement of the final wave 5
Aligned with an old trading range and daily level
This makes it an ideal demand zone for patient bulls but only once price confirms.
💡 Educational Insight
This setup highlights an example of Elliott Wave Theory in action — after a strong 5-wave impulse move, markets often enter a corrective phase. The completion of wave 5, especially near key psychological levels like $0.10, often marks a local top, where price corrects toward key Fibonacci retracement zones.
Combining wave structure with confluence factors like Fib levels, VWAP, and prior trading ranges helps traders identify high-probability reversal zones — allowing for better timing, risk management, and trade planning. Always wait for confirmation before jumping into any trades.
Summary
Bearish continuation confirmed on pdOpen breakdown
First support zone: $0.0613–$0.0614
Final downside target: $0.0529–$0.0514
Look for long opportunities only on reaction + confirmation
_________________________________
💬 If you found this helpful, drop a like and comment!
Want breakdowns of other charts? Leave your requests below.
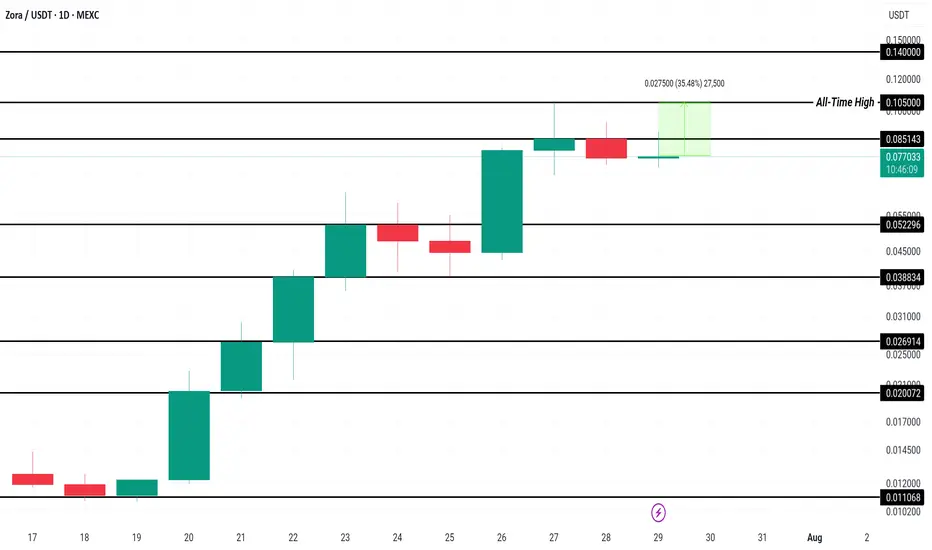
Zora Price Stands 35% From ATH; Can It Make It This Week?MEXC:ZORAUSDT has been rallying for the past ten days, recently reaching a new all-time high (ATH) of $0.105. Currently, Zora is trading at $0.775 , just below the resistance of $0.085. This recent rally has sparked optimism among investors, positioning Zora for potential further gains.
Given the altcoin’s 7% increase today, there’s a high probability that $ MEXC:ZORAUSDT will surpass its ATH of $0.105 , potentially reaching new highs beyond $0.140 this week . The strong momentum indicates that the bullish trend could continue if the current market conditions hold.
However, if investor sentiment shifts and selling pressure intensifies, MEXC:ZORAUSDT price could dip below $0.052 . A significant drop through this support level would invalidate the current bullish outlook and could signal a longer-term decline in the coin’s value.
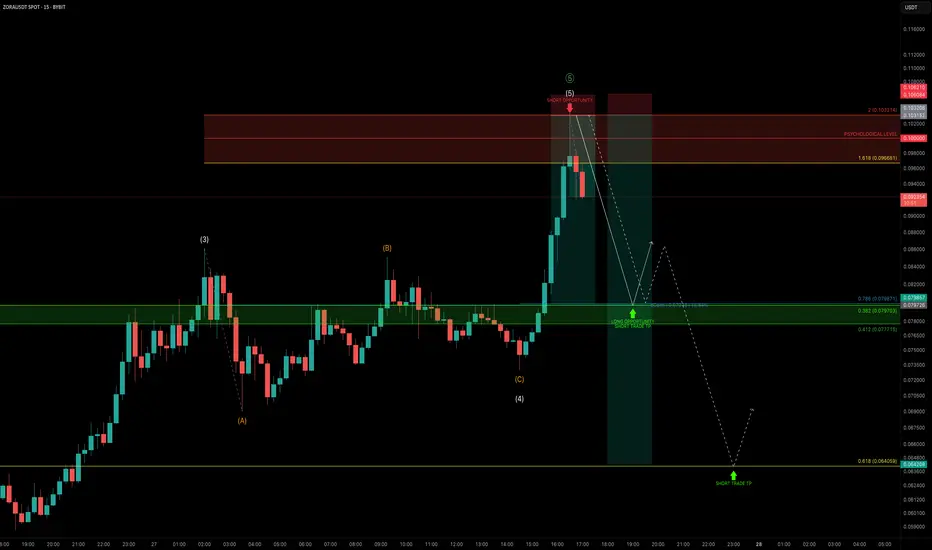
ZORA — Parabolic Rally Nearing ExhaustionZORA has been on an explosive run, pumping +1239% in just 20 days. But after such a vertical move, the question is:
Is this rally nearing exhaustion?
Let’s dive into the technicals 👇
🧩 Elliott Wave Structure
Looking at price action through the lens of Elliott Wave Theory, ZORA appears to be completing its 5th wave:
➡️ Wave 3–4 zone: Held around the $0.05 trading range
➡️ Wave 5: Now pushing into the $0.097–$0.103 zone
This area aligns with:
The 1.618–2.0 Fib extension pocket — a typical exhaustion zone for wave 5s
The $0.10 psychological level
🔴 Short Trade Setup
This zone between $0.097–$0.103 is the ideal reversal area to consider shorting, with clearly defined targets and confluence:
Entry: $0.097 – $0.103
Stop-Loss: Above the 2.0 Fib Extension
TP1: Around $0.08
TP2: Around $0.064
Confluence: TP1
Daily Open (dOpen)
0.786 Fib of the local move
0.382 Fib of the 5-wave structure
TP2 (Lower Target):
0.618 Fib retracement of the 5-wave move at $0.064
Risk-to-Reward:
TP1 gives an R:R of 1:8
TP2 offers potential 1:13+
Watch for signs of weakness.
_________________________________
💬 If you found this helpful, drop a like and comment!
Want breakdowns of other charts? Leave your requests below.
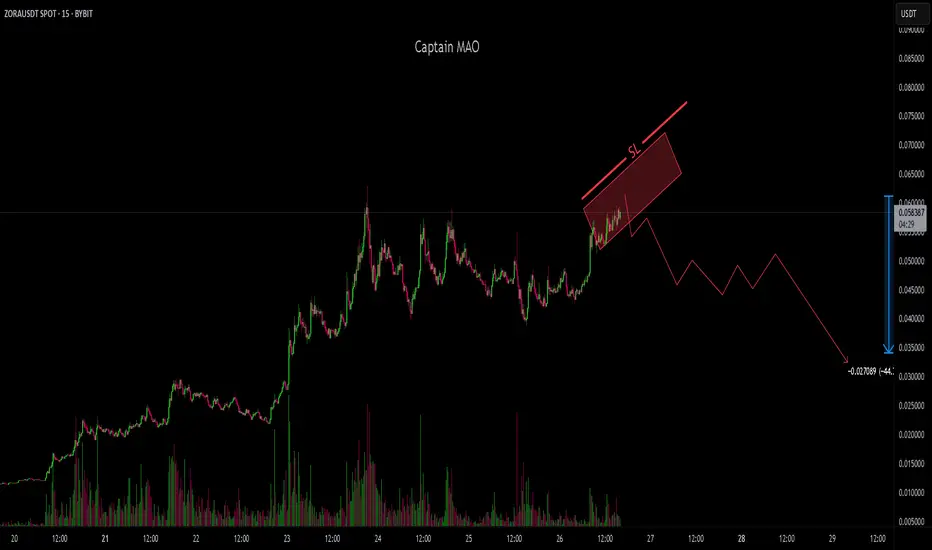
ZORA/USDT -short setuphas recently completed a massive rally, surging nearly 700% since its July 2025 . Price has now swept key liquidity above the 0.085 level, marking an exhaustion point after a parabolic advance. liquidity grab in this zone, indicating potential bull trap behavior and weakening
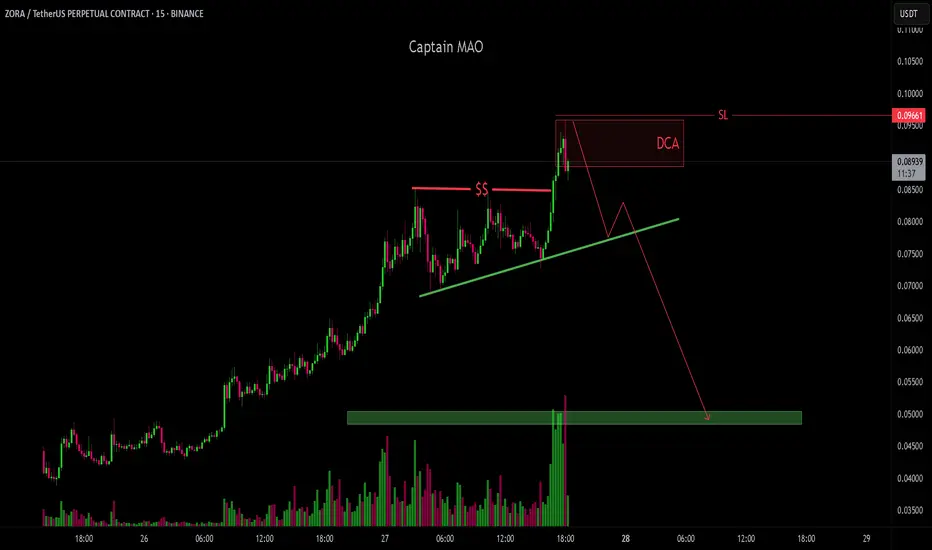
ZORA/USDT -40% has delivered an explosive move since July 2025, rallying nearly +700% from its listing price. This kind of parabolic price action typically marks the climax of a strong impulse wave, especially for newly listed tokens on perpetual markets.
Currently, ZORA is showing early signs of exhaustion, with price stalling near recent highs. Momentum indicators are flattening out, and volume is starting to decline classic signs of distribution. Given the magnitude of the recent move, a healthy correction is likely before any potential continuation.
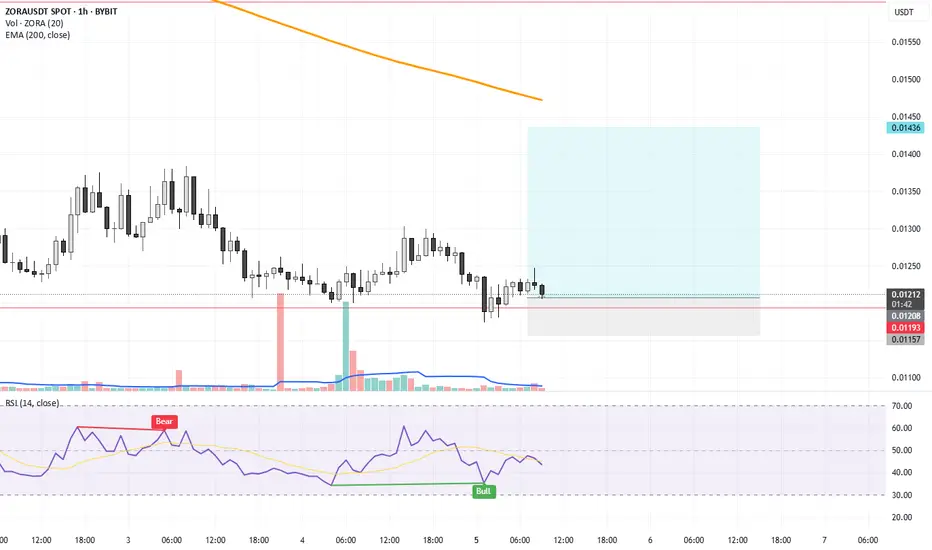
ZORA usdtCP 0.01212
Buy: 0.012 to 0.0124
Sell: 0.0143 (18%)
SL: 0.01157 (4%)
Low Volume
Low Risk
High Reward.
Exchange Bybit.
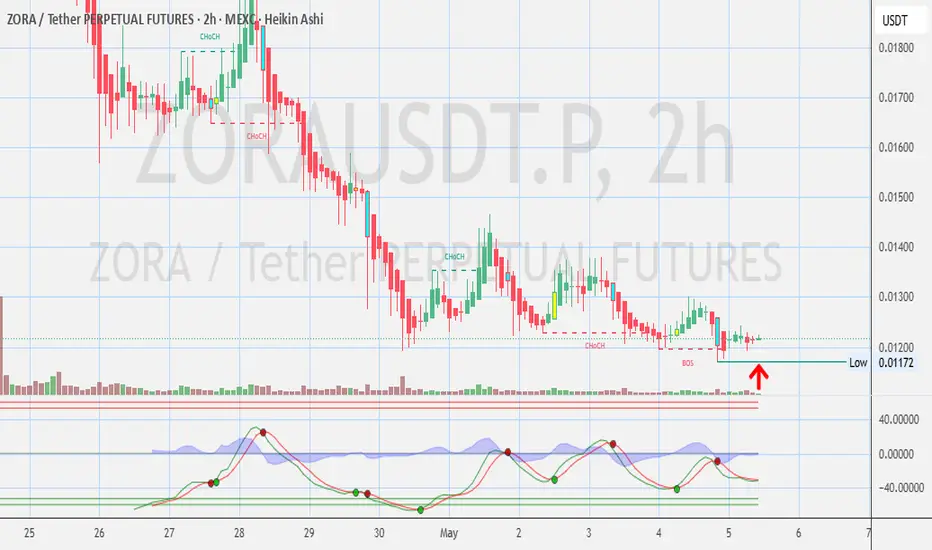
ZORA - 2 Hours Chart - Bottom? Not financial advice.
No recommendations to buy sell any securities, crypto, stocks or FX.
DYOR.
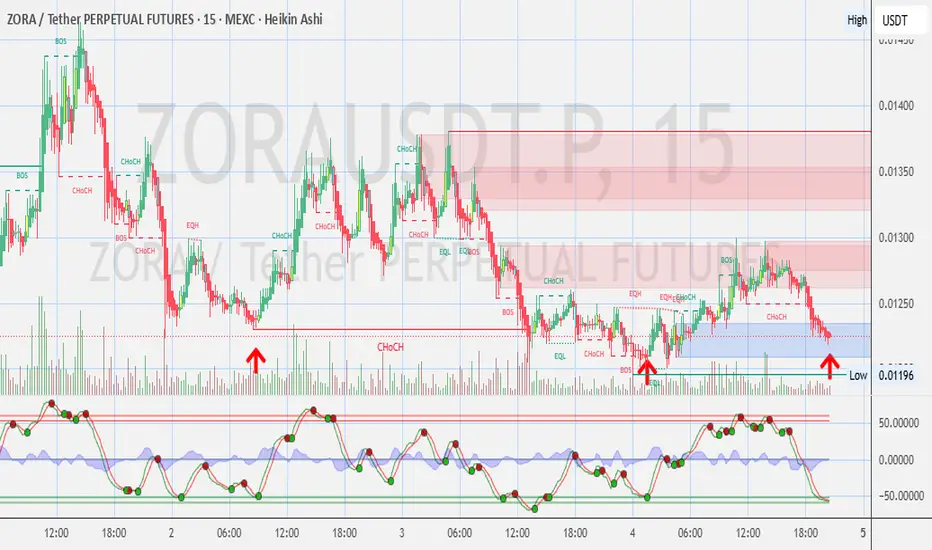
ZORA - 15 Minutes Chart Not financial advise.
No recommendations to buy sell securities, stocks, crypto or FX...
Just for fun. DYOR
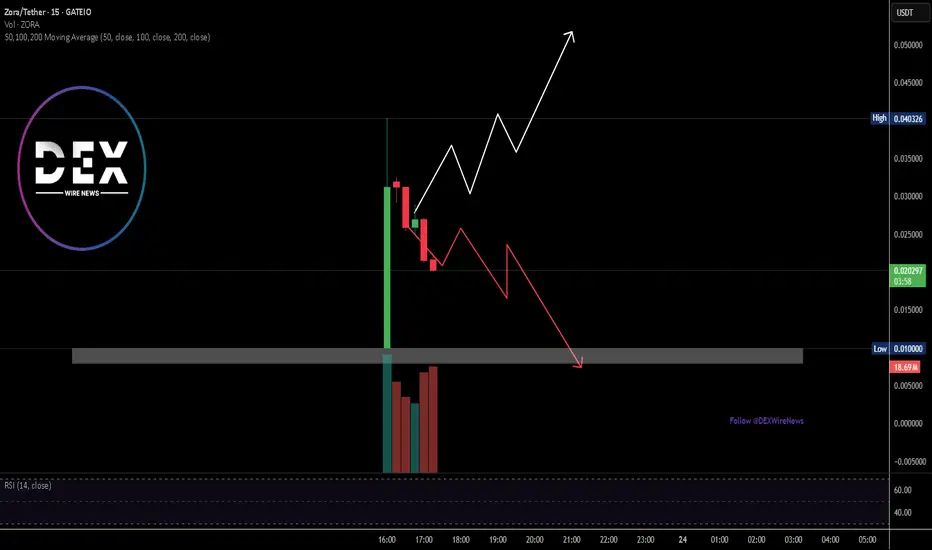
Breaking: $ZORA Spike 200% After ListingZora, a token on the Base blockchain saw a 200% price surge hours after listing on notable crypto exchanges. The asset started trading 12 UTC with about 10B ZORA in total and Max supply the asset started trading at $0.02568.
As per data from CMC, there's about 52982.18% increase in 24 hour trading volume with an influx of $23,016,656.05.
Whether or not $ZORA performs, the asset is pretty much new without much trading data. However, all eyes are set on the $0.040 a level that is presently regarded as the all-time high. Similarly, a break below the critical support point of $0.01 which is regarded as the all time low could be diabolical for $ZORA coin.
ZORA Price Data
The ZORA price today is $0.027767 USD with a 24-hour trading volume of $16,783,314 USD. ZORA is up 7.59% in the last 24 hours. The current CoinMarketCap ranking is #3155. The circulating supply is not available and a max. supply of 10,000,000,000 ZORA coins.