ZRO/USDT Breakout Watch – Ready to Rally After Being TrappedZRO is currently in a technically significant phase. After months of relentless selling pressure, the price action is now forming a classic Descending Triangle, and price is testing the upper boundary of this structure. A breakout from this zone could trigger a strong bullish reversal with multi-sta
#ZRO/USDT#ZRO
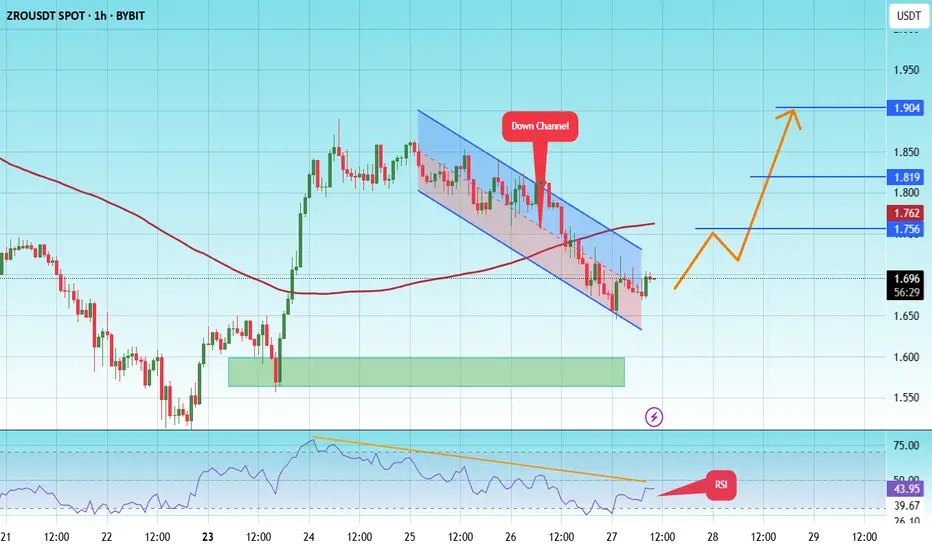
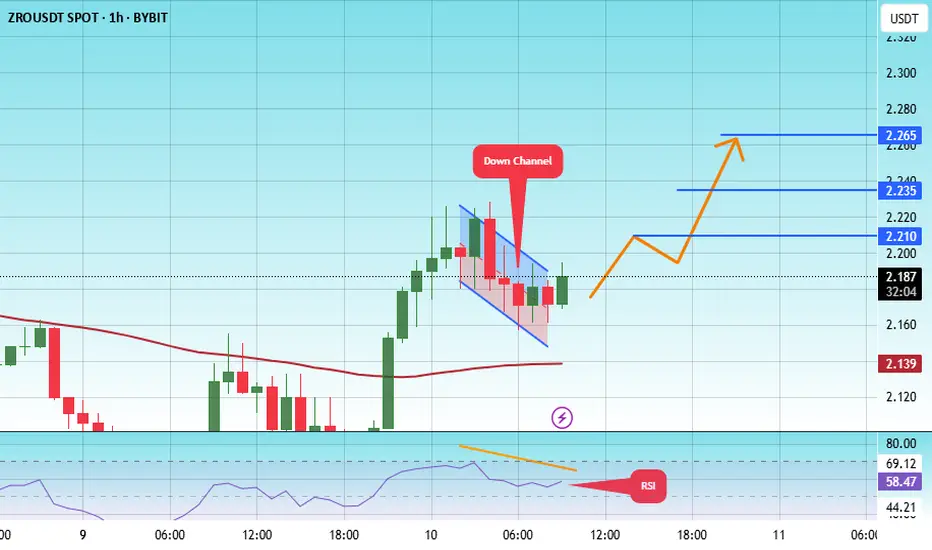
The price is moving within a descending channel on the 1-hour frame and is expected to break and continue upward.
We have a trend to stabilize above the 100 moving average once again.
We have a downtrend on the RSI indicator that supports the upward move with a breakout.
We have a support a
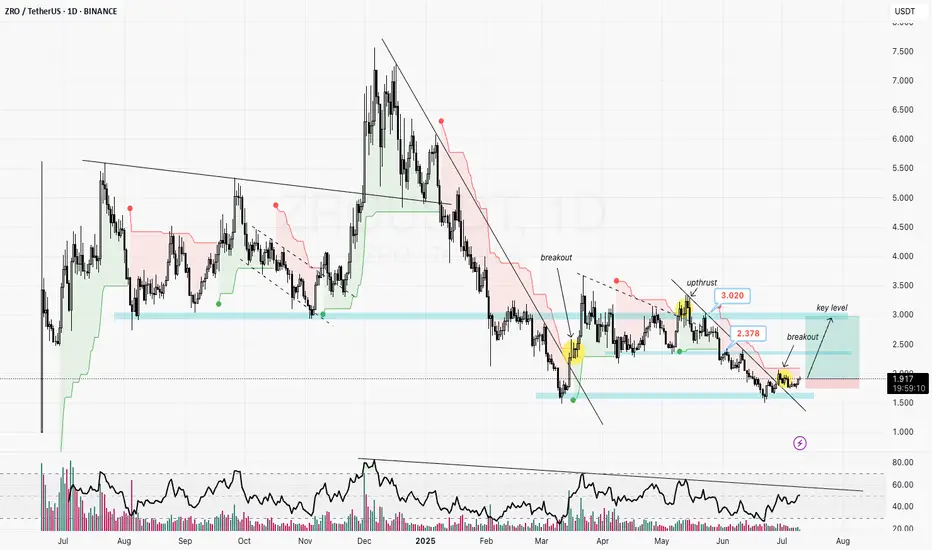
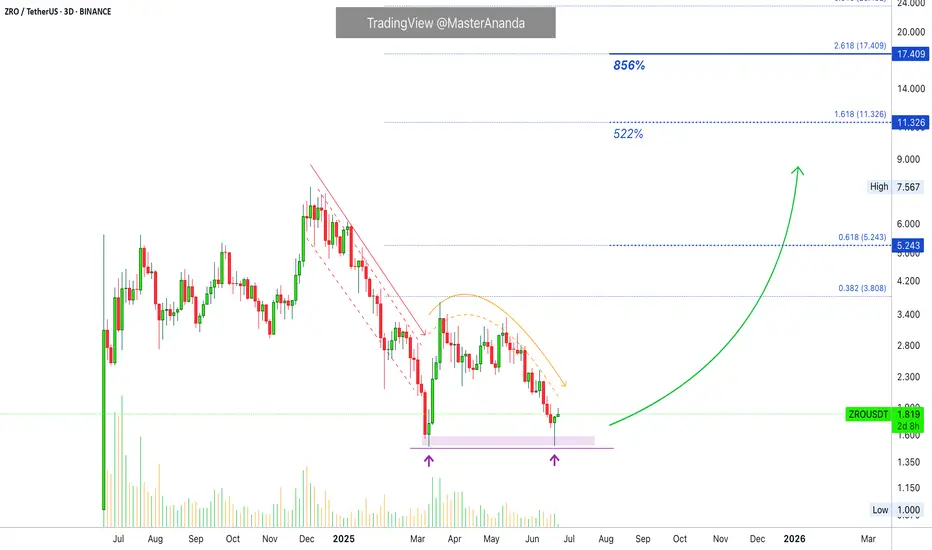
ZRO/USDT Wave AnalysisSince 2024, CSE:ZRO established a key level around $3. Moving into 2025, the price experienced a sharp decline, breaking below $3 and finding support near $1.5.
In mid-March, the long-term downtrend channel was decisively broken with a +140% move. However, the price failed to reclaim the $3 key l
#ZRO/USDT#ZRO
The price is moving within a descending channel on the 1-hour frame, adhering well to it, and is heading for a strong breakout and retest.
We have a bounce from the lower boundary of the descending channel, this support at 1.71.
We have a downtrend on the RSI that is about to be broken and r

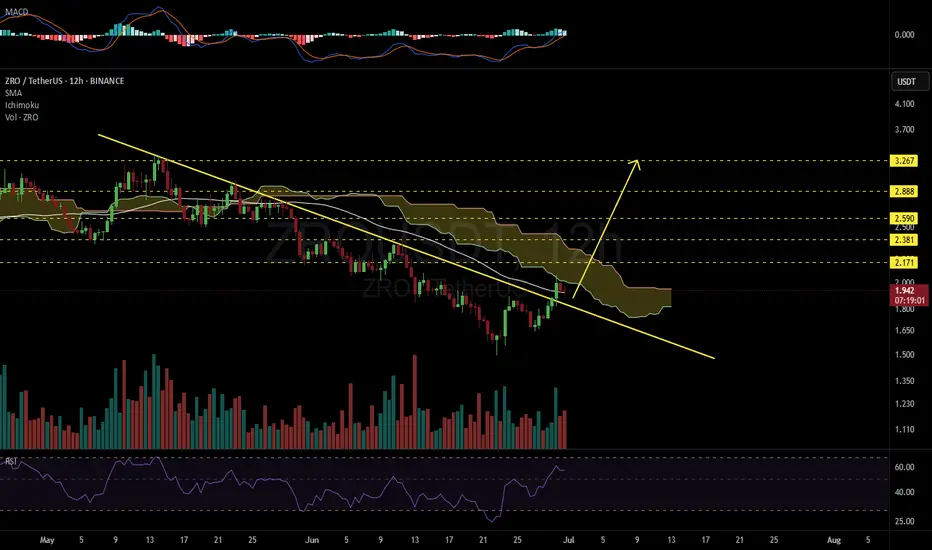
ZROUSDT 12H#ZRO has broken above the descending resistance on the 12H chart.
Price is currently facing rejection at the Ichimoku cloud, while the 12H SMA50 is providing dynamic support.
📌 If a successful bounce occurs, the next potential targets are:
🎯 $2.171
🎯 $2.381
🎯 $2.590
🎯 $2.888
🎯 $3.267
⚠️ As always
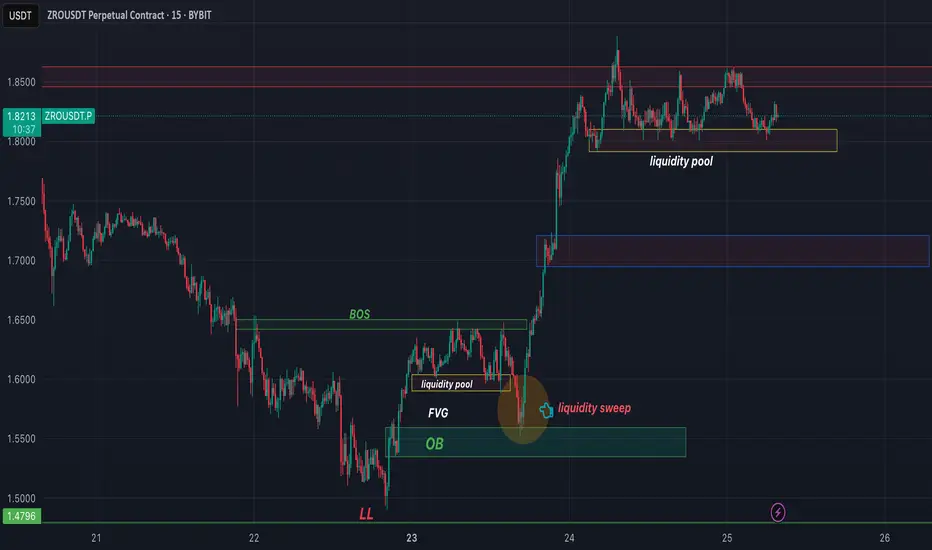
ZRO ZRO recently broke structure to the upside with strong momentum hinting at smart money involvement.
Price is now consolidating just above a key bullish OB a potential sign of reaccumulation.
Beneath this range, there’s a clear liquidity pool around 1.805 formed by multiple EQ L This area is a like
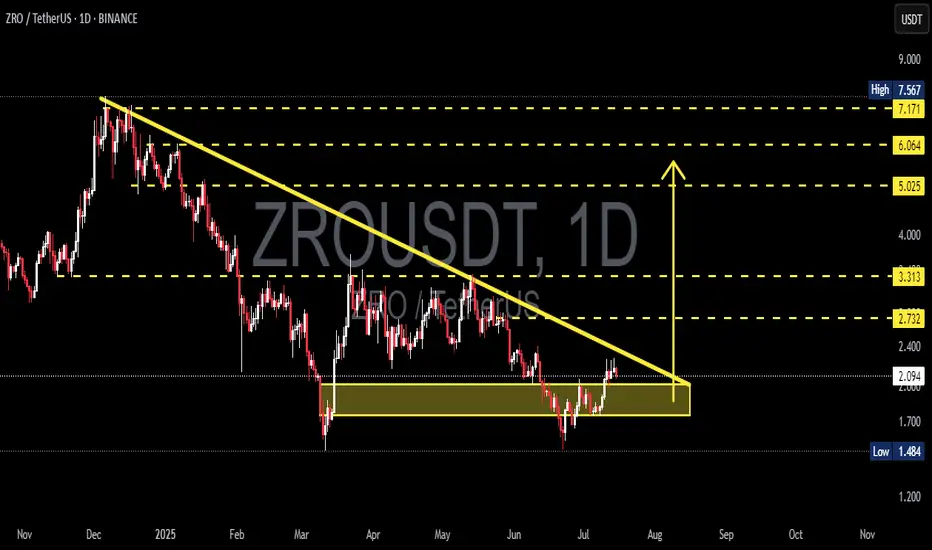
LayerZero, Exposing The Bottom, NEW Uptrend in The MakingNotice how a very steep decline suddenly becomes flat. The bottom that is. As ZROUSDT was crashing down from December 2024 we have lower lows. Then something changes; market dynamics, price action, the trend, instead of lower lows the bottom goes flat and yesterday we have a double-bottom. This mean
$ZROUSDT Descending channel 4h chart.$ZRO/USDT is trading near the bottom of a descending channel on the 4H chart.
If support holds, a bounce toward the upper channel could offer a 26.96% upside.
Watch for confirmation, but a breakdown below the channel may signal further downside.
DYRO, NFA

#ZRO/USDT#ZRO
The price is moving within a descending channel on the 1-hour frame, adhering well to it, and is heading towards a strong breakout and retest.
We are experiencing a rebound from the lower boundary of the descending channel, which is support at 2.10.
We are experiencing a downtrend on the RSI
See all ideas
Summarizing what the indicators are suggesting.
Oscillators
Neutral
SellBuy
Strong sellStrong buy
Strong sellSellNeutralBuyStrong buy
Oscillators
Neutral
SellBuy
Strong sellStrong buy
Strong sellSellNeutralBuyStrong buy
Summary
Neutral
SellBuy
Strong sellStrong buy
Strong sellSellNeutralBuyStrong buy
Summary
Neutral
SellBuy
Strong sellStrong buy
Strong sellSellNeutralBuyStrong buy
Summary
Neutral
SellBuy
Strong sellStrong buy
Strong sellSellNeutralBuyStrong buy
Moving Averages
Neutral
SellBuy
Strong sellStrong buy
Strong sellSellNeutralBuyStrong buy
Moving Averages
Neutral
SellBuy
Strong sellStrong buy
Strong sellSellNeutralBuyStrong buy
Displays a symbol's price movements over previous years to identify recurring trends.