0X New Bullish Impulse, New All-Time High Late 2025I see bullish market conditions with a long-term growing base. Each time there is a correction, or bear market, the end price of the move is higher compared to the previous cycle.
The all-time high remains in 2021. This never breaks. There has been some bullish waves but not enough to break the 202

#ZRX/USDT#ZRX
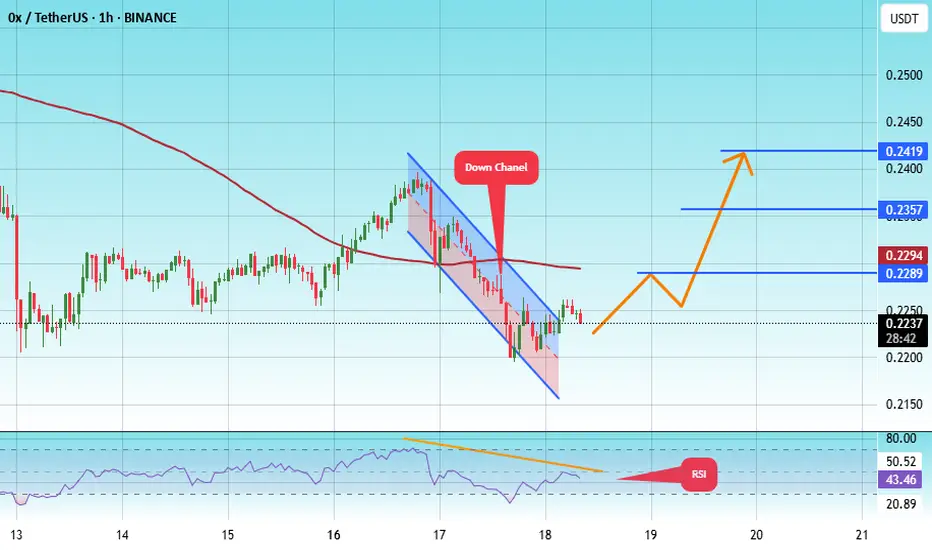
The price is moving within a descending channel on the 1-hour frame, adhering well to it, and is heading towards a strong breakout and retest.
We are experiencing a rebound from the lower boundary of the descending channel. This support is at 0.2175.
We are experiencing a downtrend on the RSI
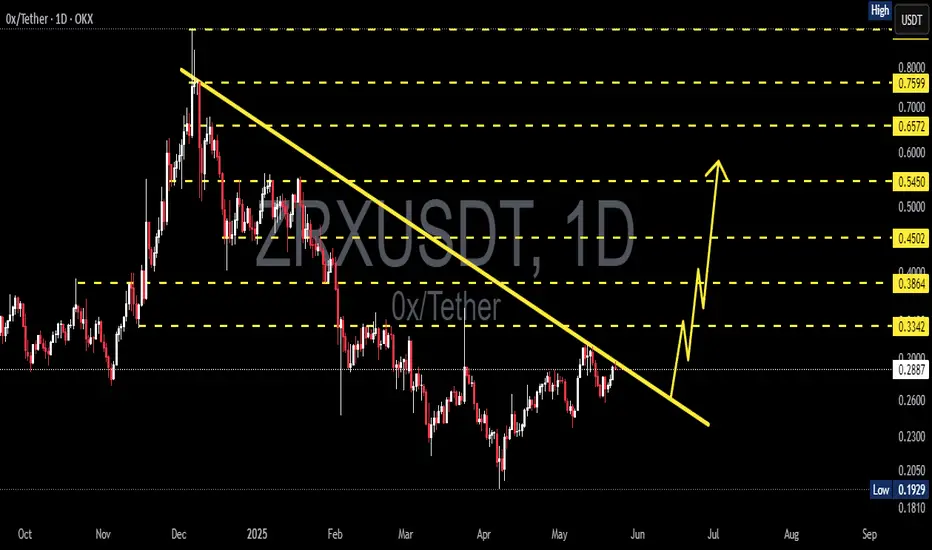
ZRXUSDT 1D AnalysisZRX ~ 1D Analysis
#ZRX Buy gradually after successfully breaking through this resistance line with a short-term target of at least 10%++.
#ZRX/USDT#ZRX
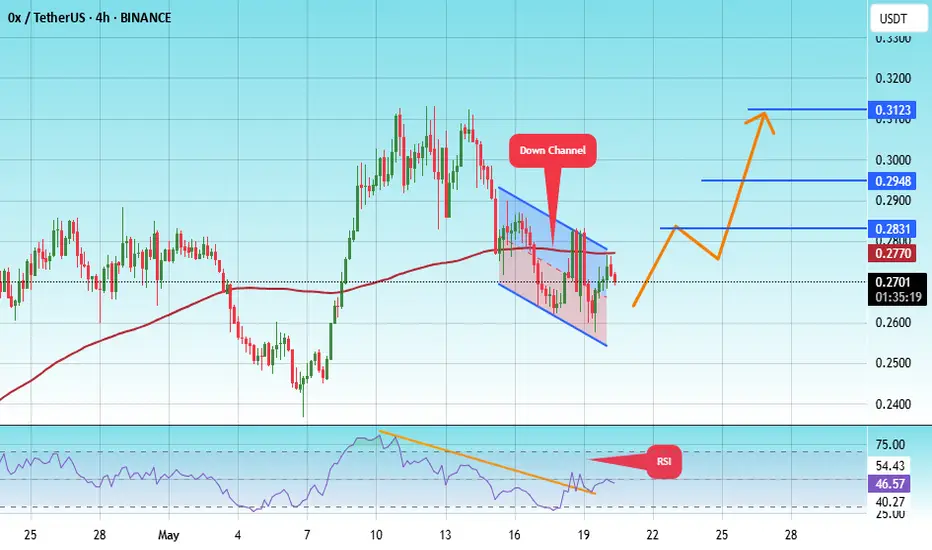
The price is moving within a descending channel on the 1-hour frame, adhering well to it, and is heading for a strong breakout and retest.
We are seeing a bounce from the lower boundary of the descending channel, which is support at 0.2586.
We have a downtrend on the RSI indicator that is abo
0x Idea speaks for itself.
We're currently in 'PROVEN BUY ZONE' with past returns well above 6x.
This is not financial advice nor any indicator or promise of future gains, however...
It's undeniable that within last 5.5 years this infrastructure protocol gave plenty of opportunities and there are no
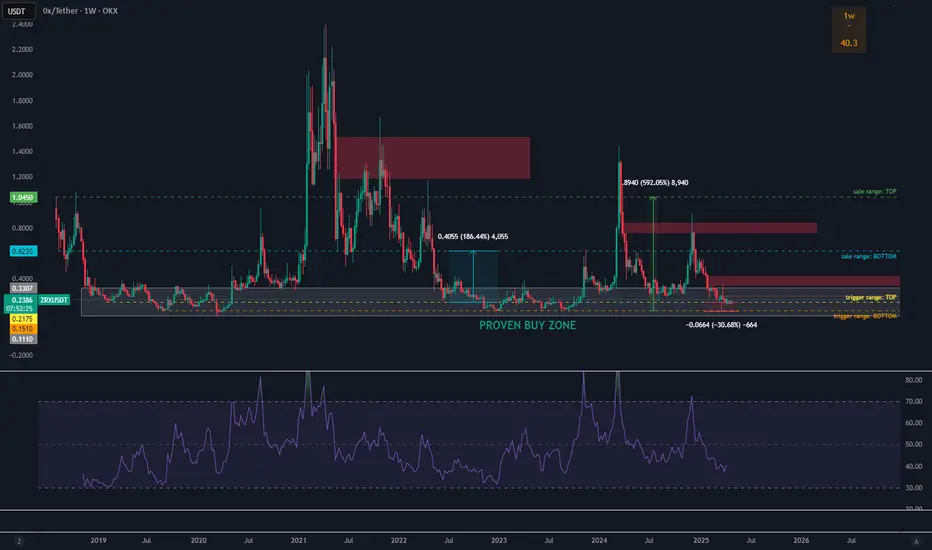
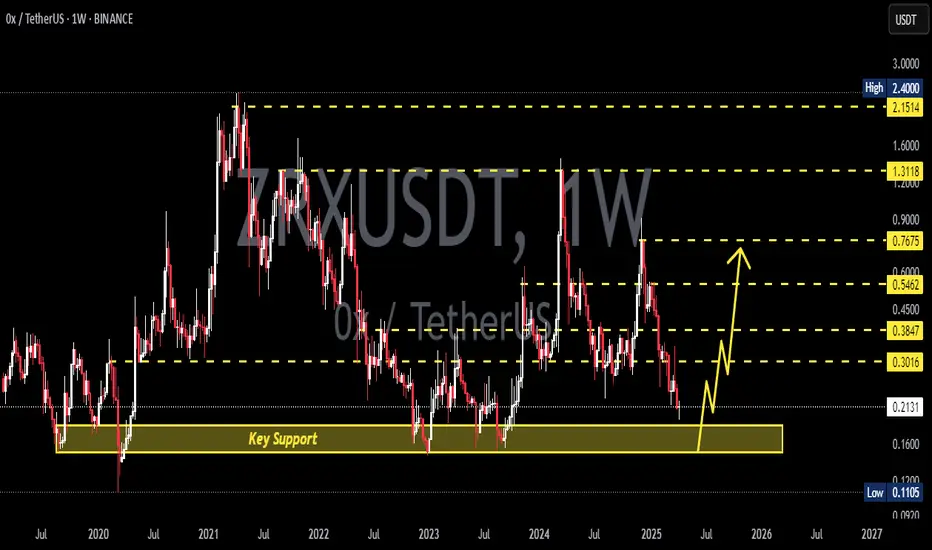
ZRXUSDT 1WZRX ~ 1W Analysis
#ZRX Buy gradually when re -testing this support with a short -term target of at least 20%+. from here.
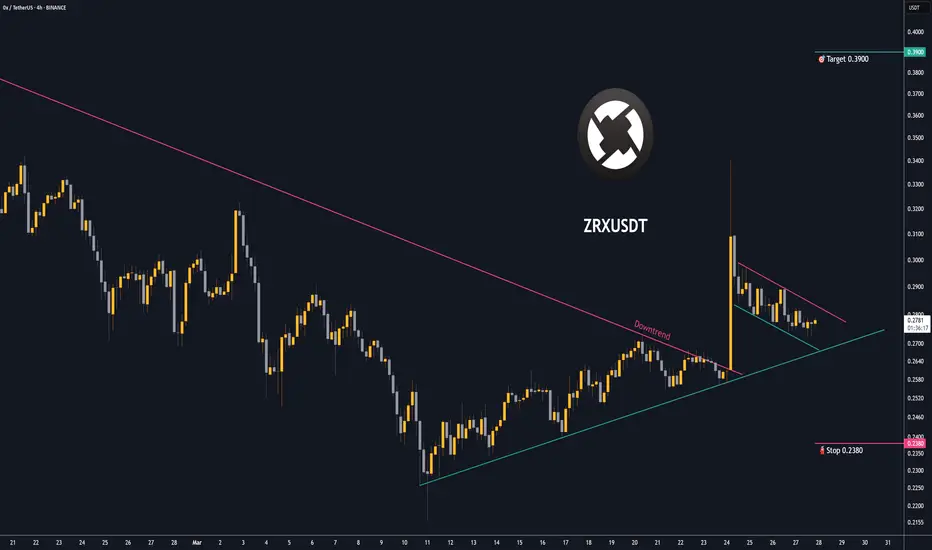
Trading opportunity for ZRXUSDTBased on technical factors there is a Buy position in :
📊 ZRXUSDT
🔵 Buy Now
🪫Stop loss 0.2380
🔋Target 0.3900
📏 R/R 2,7
💸RISK : 1%
We hope it is profitable for you ❤️
Please support our activity with your likes👍 and comments📝
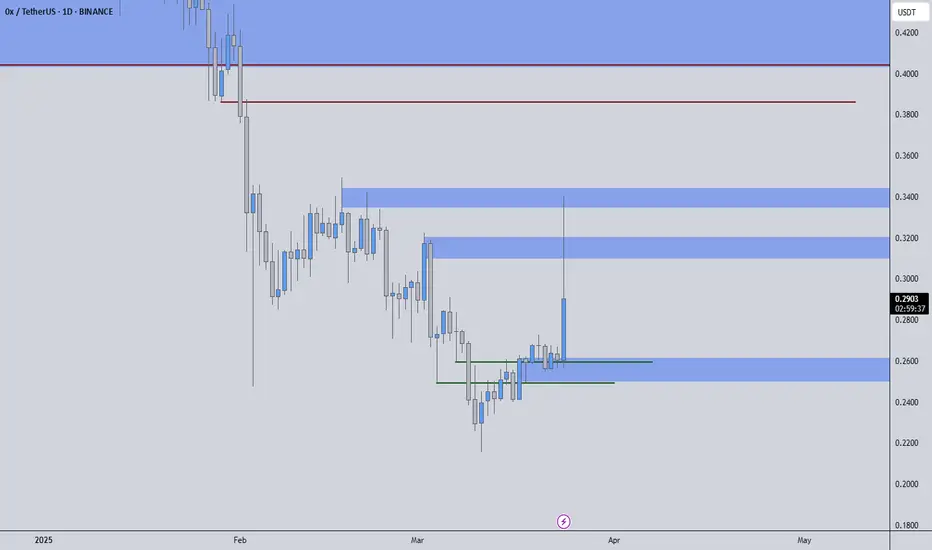
ZRXUSDT – Key Support & Resistance Zones Marked!I've outlined the critical price levels—where the market will decide its next move. Green lines = Strong Supports, Red lines = Major Resistances. But remember, we don’t gamble—we execute with precision.
📊 How I’m Trading This:
✅ Wait for LTF Confirmations – We don’t guess, we let the market speak.
ZRXUSDT 1WZRX ~ 1W Analysis
#ZRX High risk trading. Buy from here if you only have a Conviction on this coin with a short -term target of at least 20%+.

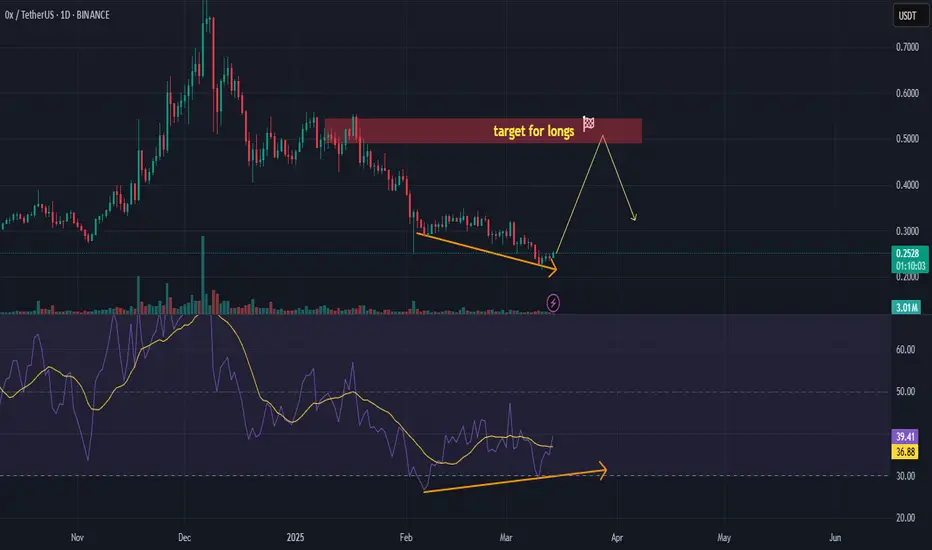
ZRXUSDT - bullish divergenceshi traders
There are bullish divergences on ZRXUSDT 1D chart.
We expect a 100% move from the current lows.
Don't get too excited as it may be just a dead cat bounce and after that the price may come back down and make new lows.
Very risky market but the edge for bulls is there so they have to step
See all ideas
Summarizing what the indicators are suggesting.
Oscillators
Neutral
SellBuy
Strong sellStrong buy
Strong sellSellNeutralBuyStrong buy
Oscillators
Neutral
SellBuy
Strong sellStrong buy
Strong sellSellNeutralBuyStrong buy
Summary
Neutral
SellBuy
Strong sellStrong buy
Strong sellSellNeutralBuyStrong buy
Summary
Neutral
SellBuy
Strong sellStrong buy
Strong sellSellNeutralBuyStrong buy
Summary
Neutral
SellBuy
Strong sellStrong buy
Strong sellSellNeutralBuyStrong buy
Moving Averages
Neutral
SellBuy
Strong sellStrong buy
Strong sellSellNeutralBuyStrong buy
Moving Averages
Neutral
SellBuy
Strong sellStrong buy
Strong sellSellNeutralBuyStrong buy
Displays a symbol's price movements over previous years to identify recurring trends.