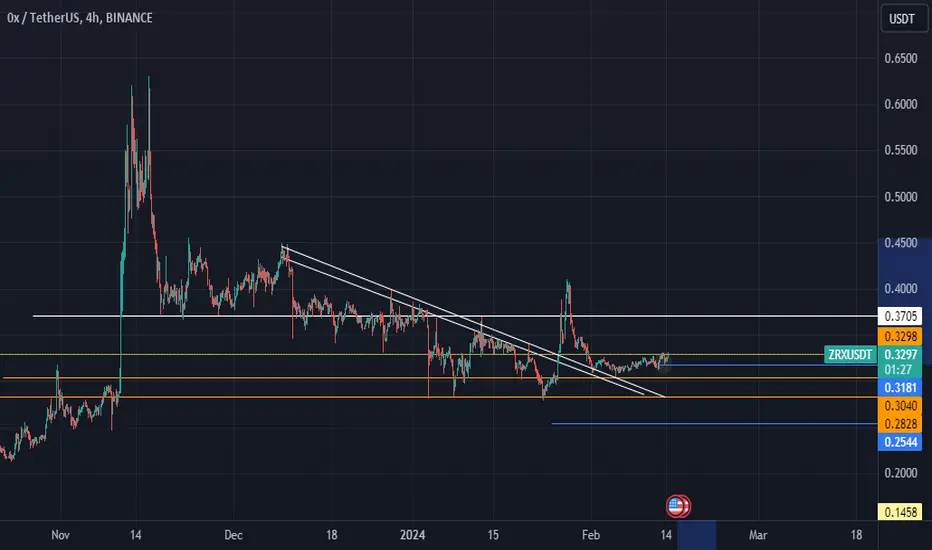
zrx ready for pumpi belive zrx is very bullish in weekaly time frame and now in 4H we are in a good place to buy.
goof target target in weekly time frame and good entry point in 4 h
DYOR
ZRXUSDT.PS trade ideas
ZRX Complete Pullback To Demand ZoneIf Price Stablize Up Demand Zone I Think Raising To Supply Zone
Just Money Manegment & Stop Loss Very Very Important Of Bread Of Night

ZRX IdeaIdea is simple, chart is self explanatory as always.
Big Flow is backing the movement.
Understand the big risk below, but look at the massive possible reward.
Be safe.

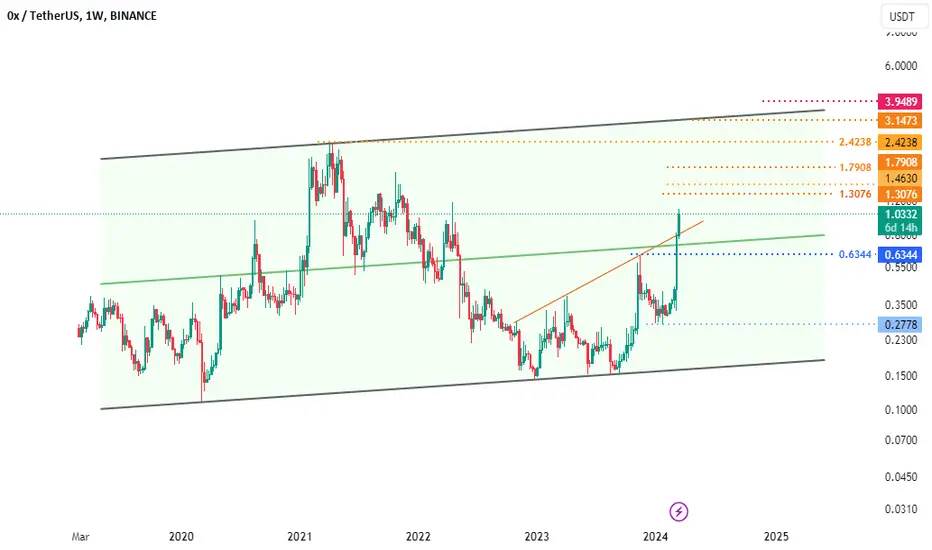
a channelA possible ascending channel with upcoming targets...
The middle line of the channel is broken with beautiful candles and
the hope is to grow up to the ceiling of the channel.
A possible pullback to the middle of the channel is also considered.
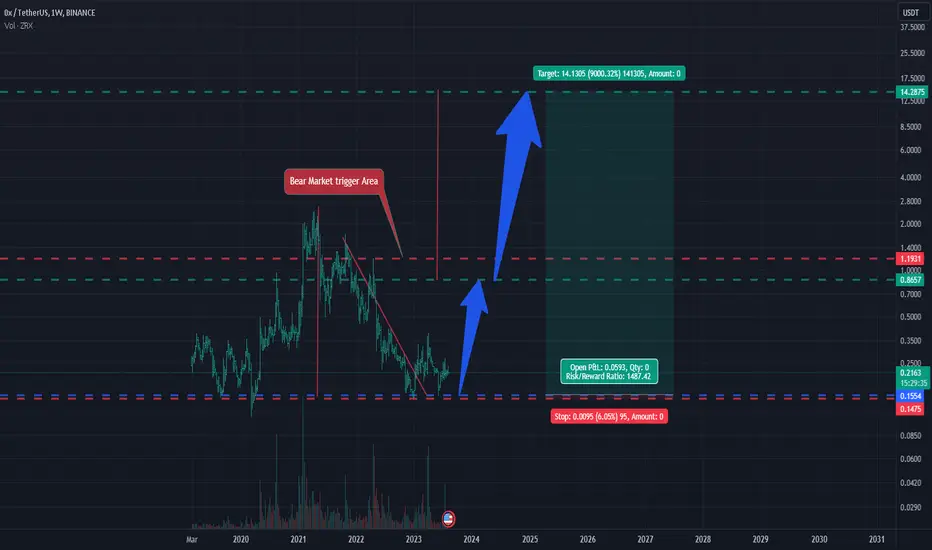
ZRX has a very good investment opportunity Hi Everyone;
today we have one of the best risk to reward Investment opportunity
it is more than 1480 times the risk and the chart is look very promising.
I expect breaking the previous bear market key point will clear the way to the final target
SOLID ZRX for spot buyers! ZRX tested multiple times on weekly candle at extreme demand zone, unable to break that level and break the neckline with bullish engulfing candle and retested the neckline back to back for two weeks.
Next station of resistance is at $0.93.
it may take 2-3 months to reach there but currently is at it best price!

#ZRX IMP Zone, If Holds 140% UP, If Not 41 % Retracement #ZRX IMP Zone, If Holds 140% UP, If Not 41 % Retracement
upside target is 1.20 $ and downside target 0.24 $.

Zrxusdt Buy opportunityZRXUSDT is exhibiting a robust rebound pattern subsequent to the formation of a pronounced double bottom. The breach of the neckline reinforces our bullish stance.
The strategy entails initiating long positions or accumulating within the vicinity of the neckline, adhering to the delineated stop-loss parameters, and aiming for the substantial target projected on the chart.
The targets specified for the short to medium term represent favorable zones for realizing profits.
We welcome and value your interaction through comments and likes. Thank you.

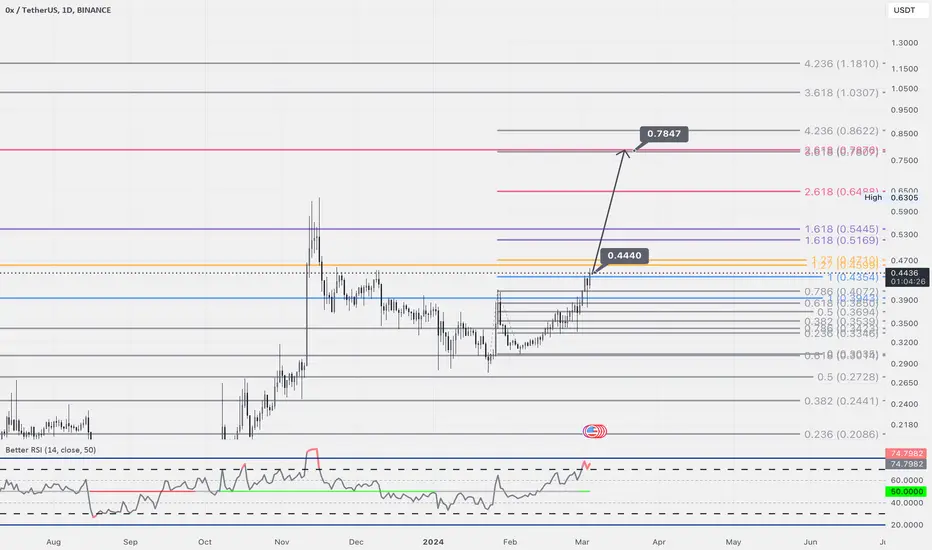
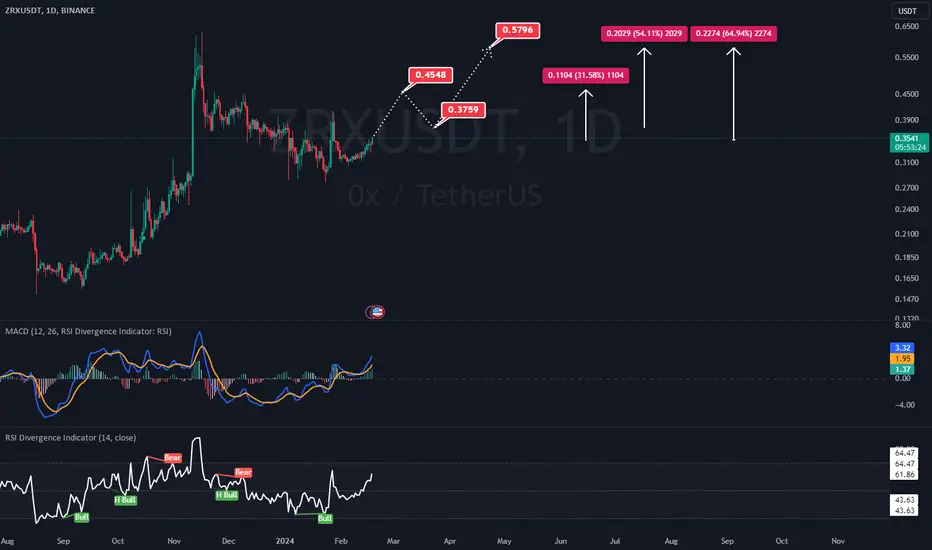
✴️ 0x Turns Long-Term Bullish (444% Potential Profits Or More)Here is another Altcoin trading pair that is looking great currently, this is a high probability setup.
0x (ZRXUSDT) is moving above MA200 to the upside for the first time since February 2021.
This is matched by the highest volume daily since February 2021.
The highest buy volume came in 8-October.
We have two really strong signals supporting each other:
➖ Break above MA200;
➖ Ultra-high buy volume at low prices.
The classic signals are also in place:
➖ Long-term higher low (Aug. '23 vs Dec. '22)
➖ RSI above 60.
➖ Bullish MACD.
Keeping it simple, this Altcoin is preparing for a major bull-run.
It will take time to develop, slow and sustained growth.
There will be retraces and corrections along the way, but the year when it all happens is 2024.
Namaste.

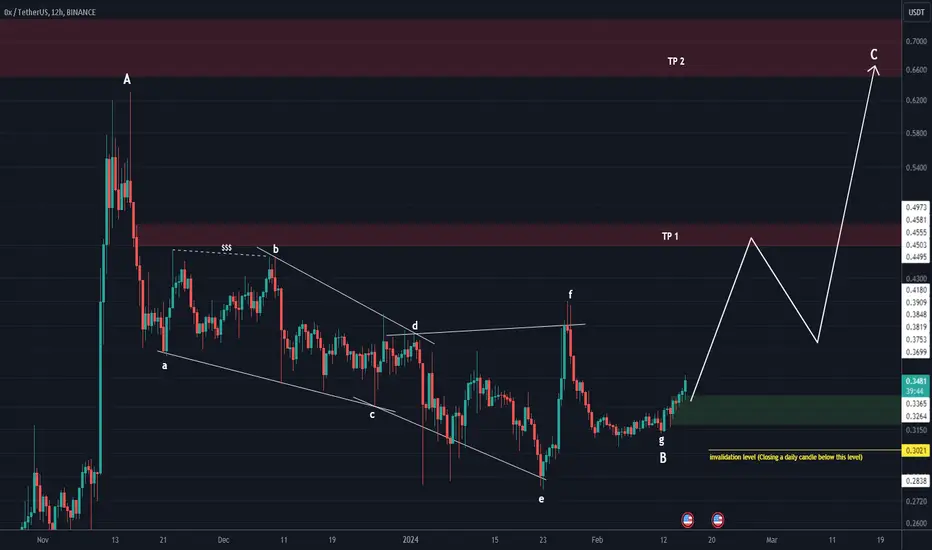
ZRX LOOKS BULLISHIt seems that we have 3 ABC waves, and wave B is a diametric one and it is over.
We should now be in a bullish wave C.
By maintaining the green range, it can move towards the TPs.
Closing a daily candle below the invalidation level will violate the analysis.
For risk management, please don't forget stop loss and capital management
Comment if you have any questions
Thank You
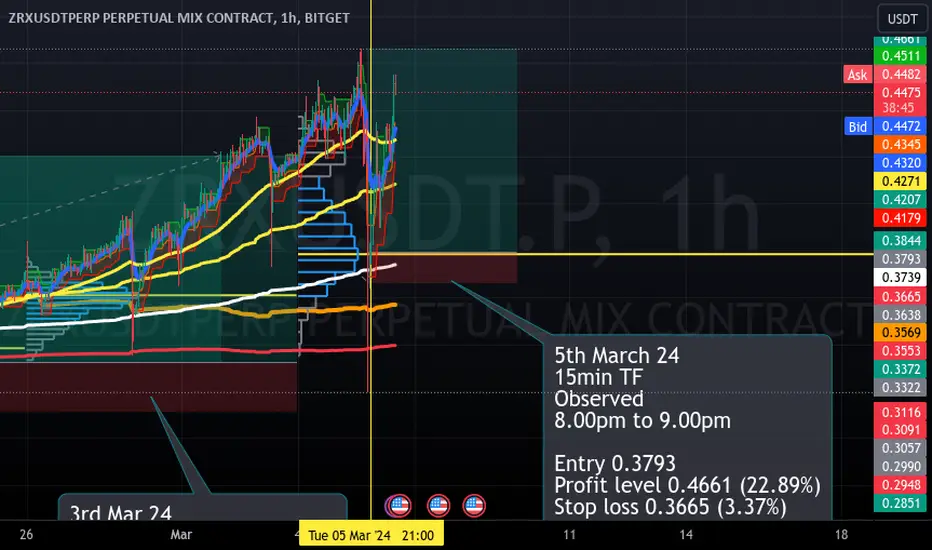
Long trade
Pair ZRXUSDT
5th March 24
15min TF
Observed
8.00pm to 9.00pm
Entry 0.3793
Profit level 0.4661 (22.89%)
Stop loss 0.3665 (3.37%)
$zrxusdt may pump by 80%hello everone,
I dont see nice and clean setup on this pair. however i dont wanna miss potential 80% rise.
Join me if you have some capital.
#ZRXUSDT#ZRX
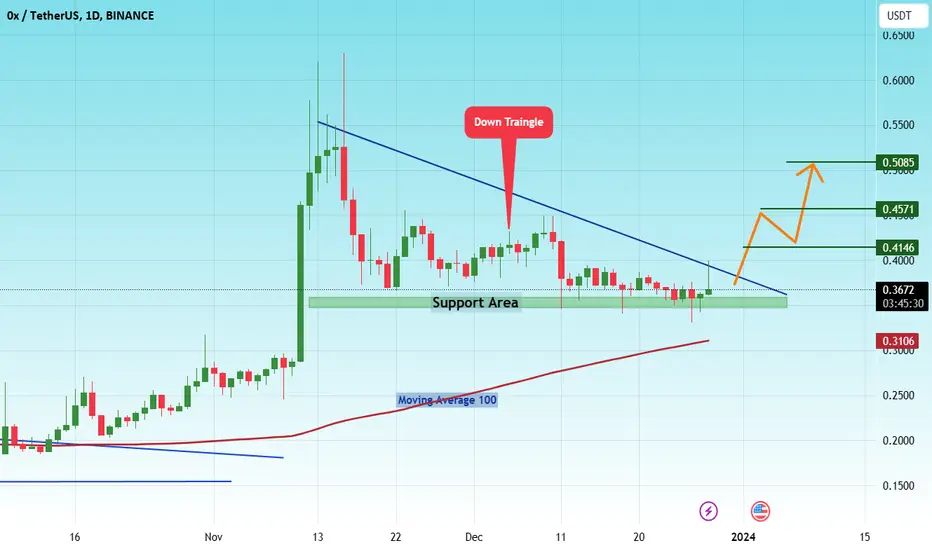
We are in a descending triangle since the last ascent, and it is about to break upward now
We have upward momentum and support from a good area
The price is expected to trade in an upward wave with price corrections
Current price 0.4146.
The first target is 0.4571.
The second goal 0.5085.
30% profit pending 0x0x can easily give 30% profit in the first target and 60% in the second target
current price : 0.35
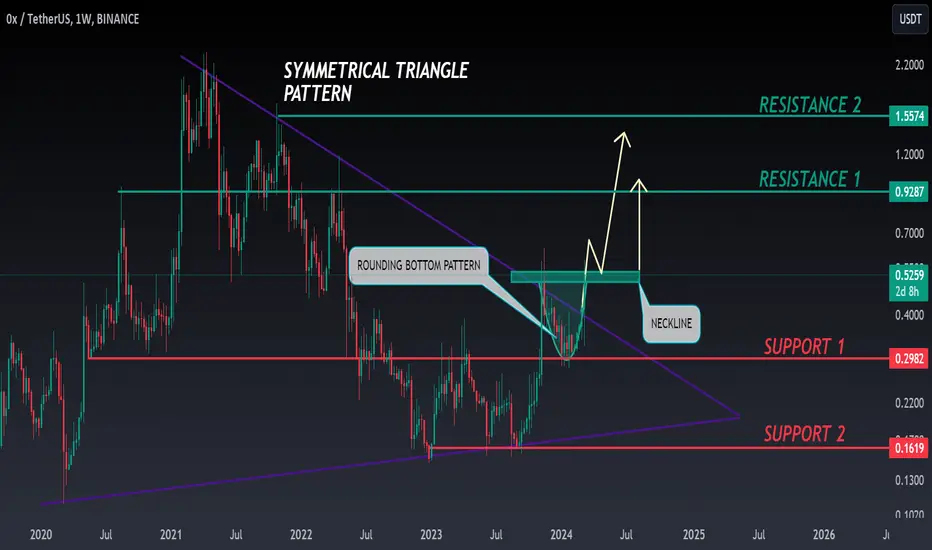
ZRX ANALYSIS🔮 #ZRX Analysis
🌟There was a breakout of Symmetrical Triangle Pattern in #ZRX with great volume. Currently #ZRX is trading in a small rounding bottom pattern and if it breakout the neckline then we will get a good bullish move of more than 50%🔥
🔖 Current Price: $0.5251
⏳️ Target Price: $0.9287
⁉️ What to do?
- We have marked crucial levels in the chart . We can trade according to the chart and make some profits. 🚀💸
#ZRX #Cryptocurrency #Breakout #DYOR
Zrx exploding soonDaily closing bullish candles
Weekly rsi looks pretty good
My Target is 0.41 retest
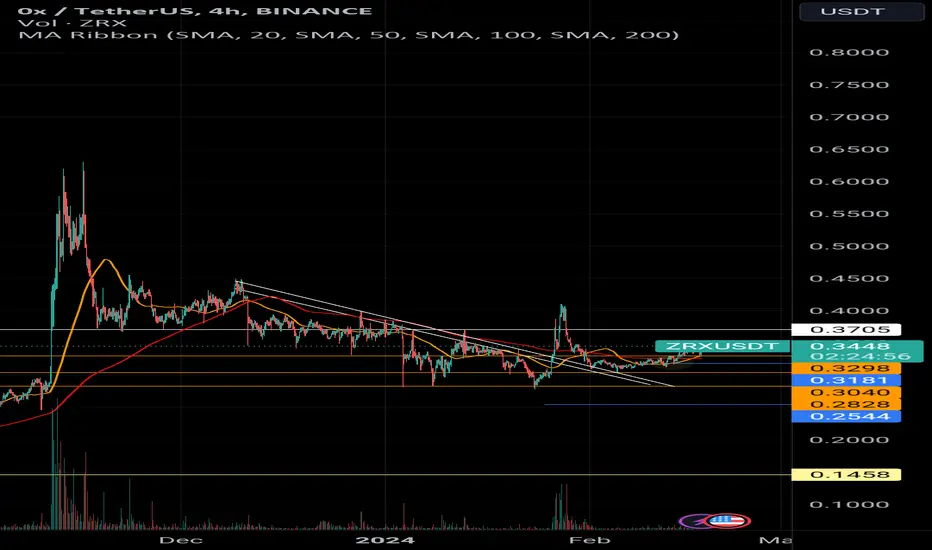
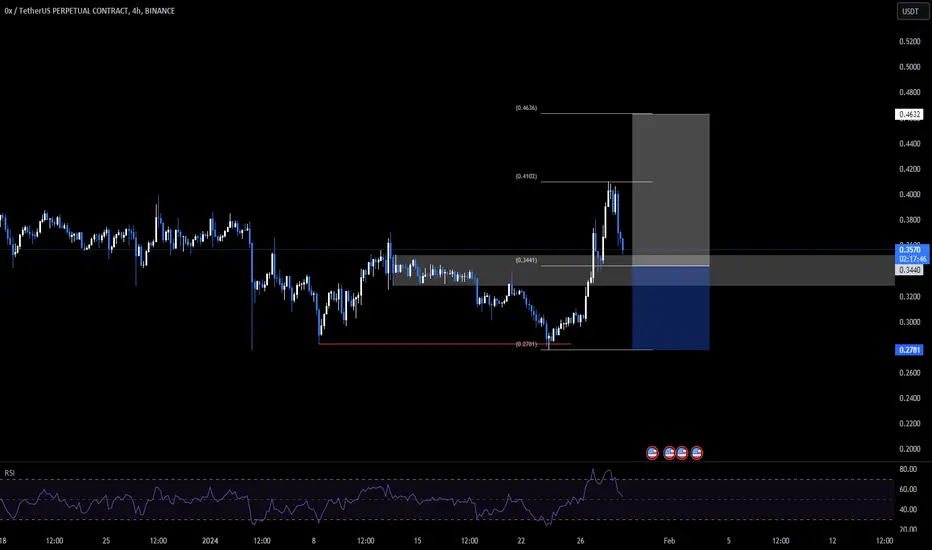
ZRX USDTZRX update.
After flipping the blue zone at 0.4143 there is a good opportunity to take an entry. All the targets are marked. Remember always use stop loss.

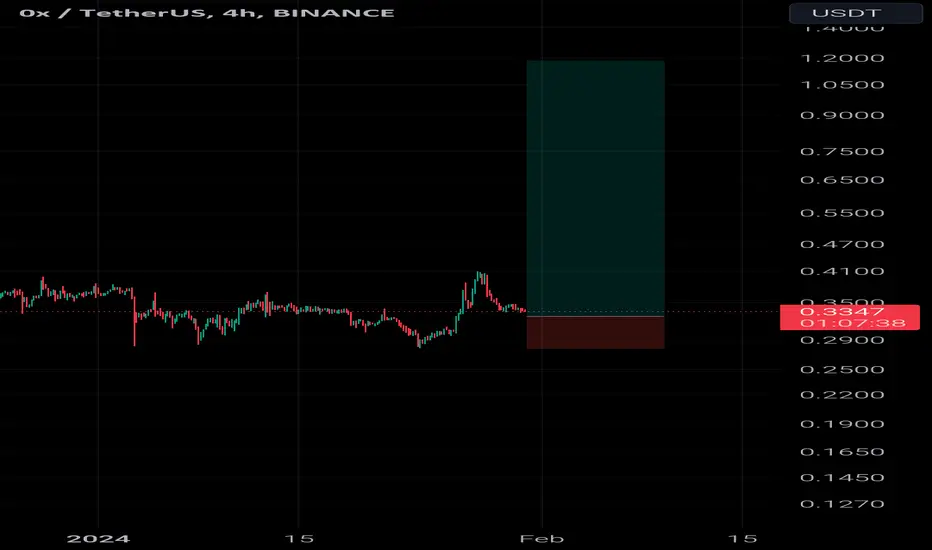
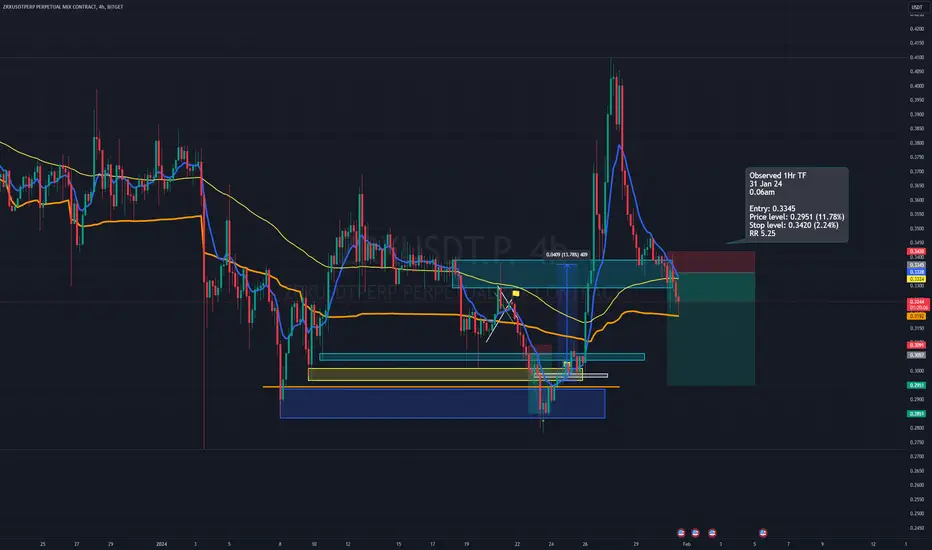
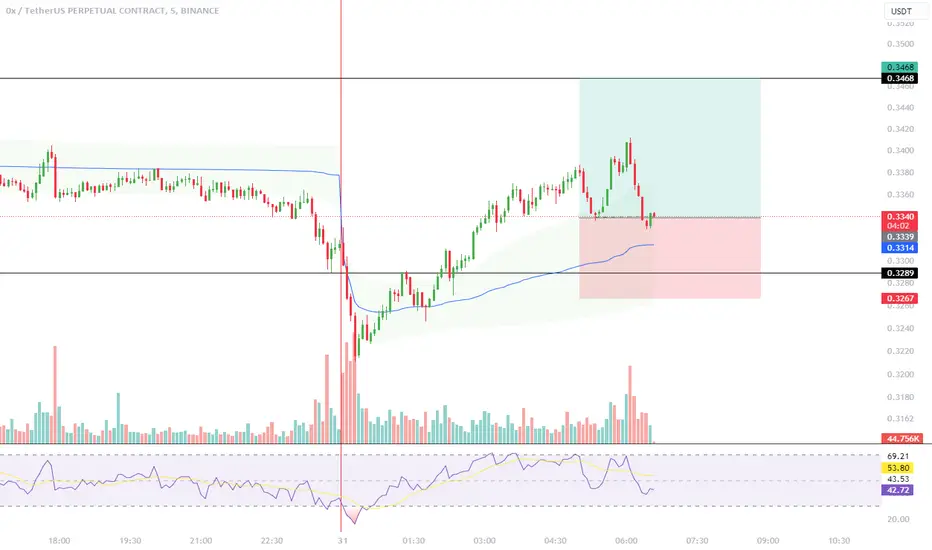
Short trade Observed 1Hr TF
Pair: ZRXUSDT
31 Jan 24
Time 0.06am
Entry: 0.3345
Price level: 0.2951 (11.78%)
Stop level: 0.3420 (2.24%)
RR 5.25
According to the Wyckoff method, I assume this is Phase E, trending outside the range.
Arbitrage of cryptocurrencies using indicators
Many have heard about P2P cryptocurrency arbitrage using bank cards and exchangers. With this, there are a number of problems and risks associated with blocking accounts, freezing money indefinitely or blocking accounts on the exchanges, since in order to effectively engage in this type of arbitration a trader must have not only his personal cards, but also drop cards (relatives, friends, etc.), and in the case of If there are any problems it becomes extremely difficult to solve them, as well as to explain to banks the origin of so many transfers from different persons.
The interexchange arbitration of cryptocurrencies is devoid of all these disadvantages, when transactions are made only on exchanges, and coins are sent only between exchanges and no third-party services, exchangers, P2P platforms and banks participate in the process of such arbitration.
How do I find and track such arbitration situations?
– situations when the exchange rate for a certain asset on one exchange is lower than on another. This will be helped by a set of indicators that track exchange rate differences for the selected asset on different exchanges. Using these indicators a trader can track how the size of the spread (exchange rate difference) has changed over time, what were the extreme values of this spread and how often it occurs at all.
Currently, there are three versions of this indicator.
1️⃣
The first version – the lightest in terms of the load on the hardware – allows you to track arbitrage situations for one selected trading pair. It provides a chart of the spread itself, the definition of extreme spread values, as well as a counter for the number of arbitrage situations in three time intervals.
2️⃣
The second version of the indicator has the same functionality on board, but for three trading pairs. That is, using one indicator you can track the spread on three assets at the same time.
3️⃣
The third version is essentially an arbitrage dashboard showing and tracking 12 trading pairs at the same time.
As the authors of these indicators and arbitrage screeners, we use a combination of the 2nd and 3rd versions of the indicator in our work. If this is too heavy for your system you can use the 1st and 3rd, or some one. In the large dashboard version (3rd), we track 12 of the most interesting assets at a time, and in the version with the spread chart (1st or 2nd), we are already looking at a more detailed picture of those of them that are of the greatest interest for further work.
What else?
In all the presented indicators, you can configure:
✅ threshold values at which additional tinting of the spread chart will occur for a better visual representation of the nature of the movement.
✅ threshold values at which the spread value in its extreme values will be displayed on the chart. Since the charts are located in TradingView price zones other than the actual spread values, this option allows you to quickly understand the real historical spread values that were in the past.
✅ threshold values at which alerts from the indicator will be received through the built-in TradingView alerts function. All you need to do is set the threshold value in the indicator, and then add an alert from the indicator in the TradingView alert settings. It is important to understand that the threshold value for all trading pairs selected in the indicator is the same, so alerts will be sent as soon as the spread value exceeds the threshold value for any of them.
✅ time intervals of the counter for the number of arbitration situations. There are three of them. That is, when analyzing a particular trading pair you can see how many times the spread value exceeded the threshold. For example, in the last 5 minutes, an hour and a day. This will give an understanding of the prospects of tracking the selected trading pair in the future.
All that remains to be done is to buy the coin at the price indicated in the Buy row on the corresponding exchange and sell it at the price from the Sell row on the second exchange.

#ZRXIn a short upstream channel there is a move that can have a climb to the first resistance area and move to the second area if the first area fails. If the backup area is broken, it will be removed from the trader of the suffering and will continue to continue the correction phase.

ZRX longZRX rejected pervious support with bullishness and it is far above trading from VWAP on 5mins timeframe.
it's looking good for long from here!
ZRX - HTF Market Structue Shift, Forming a Breaker OB Price is at the downtrend and it forms a short run of the swing lows and then makes an MSS(Market structure shift), confluence with the HTF Support level, looking to getting in a long position at the 50% fib and see what happens.