AllyPipsExpert
PremiumChart Type & Timeframe Ticker: SPY (SPDR S&P 500 ETF TRUST) Exchange: NYSE Arca Timeframe: 15-minute chart Date: August 1, 2025 Tools used: Ichimoku Cloud, Volume Profile (Visible Range), Price Action 📌 Key Observations 1. Price Structure & Trend Overall trend: Strong bullish uptrend from early May to late July. Current structure: Minor correction from...
📈 FIGMA INC – Bullish Continuation Setup (30m Timeframe) Current Price: $117.25 Previous Close: $109.59 Intraday Move: +6.99% --- 🔍 Technical Breakdown: Massive Bullish Surge: FIGMA recently witnessed a strong breakout with a long bullish candle, indicating aggressive buying and possible news or earnings catalyst. Support Zone: The initial rejection and...
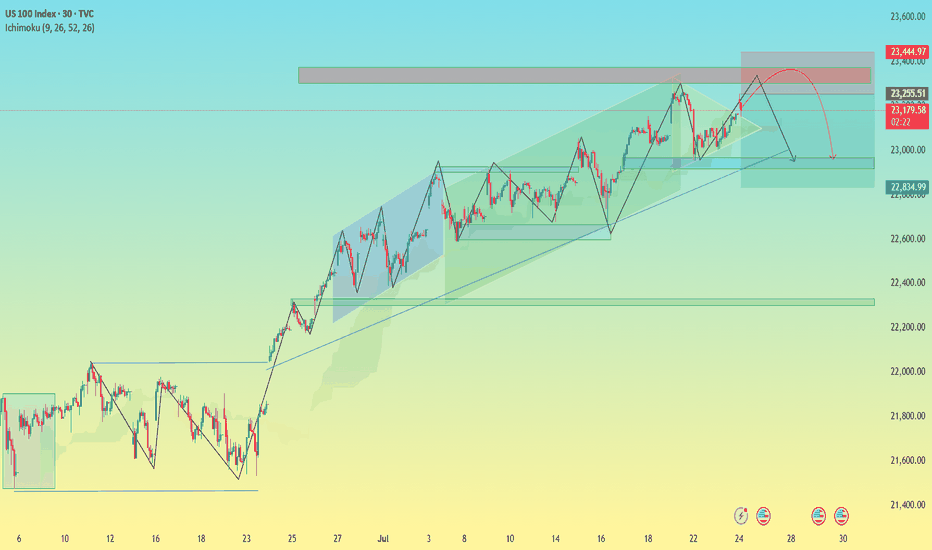
🧠 US100 Index – Potential Bearish Reversal in Key Resistance Zone Timeframe: 30-Minute | Chart Published: July 24, 2025 --- 🔍 Overview The US100 (NASDAQ) has been trading in a well-structured ascending channel, forming higher highs and higher lows. However, recent price action suggests that the index is testing a critical supply zone near 23,400, with signs...
🧠 BTC/USD – Bearish Pressure Eases, Potential Bullish Breakout Ahead? ⏰ 1H Chart | Date: July 31, 2025 📊 Market Structure Overview: Current Price: $118,053 Recent Trend: Price was moving within a descending channel (red), but bullish signs are emerging. Support Zone: ~$115,200–$116,000 (multiple bullish rejections visible). Resistance Zone: ~$120,000–$121,500...
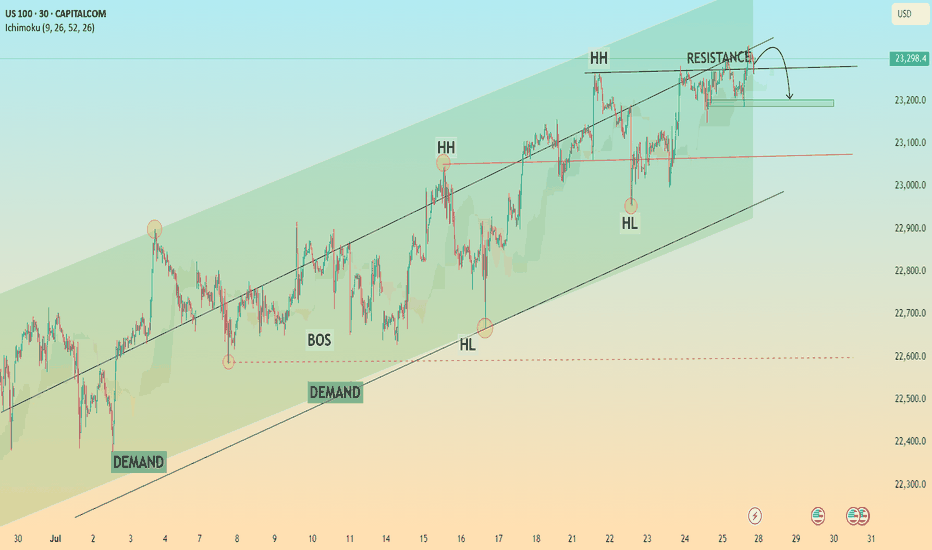
US100 (NASDAQ) 30-minute chart as of July 26, 2025, with technical insights based on the visible elements. 🔍 1. Trend Analysis Primary Trend: Uptrend (bullish structure) The price has been respecting a rising parallel channel, marked by: Ascending support (lower boundary) Ascending resistance (upper boundary) Market structure shows: Higher Highs (HH) Higher...
Microsoft (MSFT) Price Action Outlook – July 31, 2025 🧩 Technical Breakdown: 🔷 Trend Structure: MSFT has been trading within a well-defined ascending channel, reflecting a strong bullish trend. Two clean Breaks of Structure (BOS) along the trend confirm consistent higher highs and higher lows. 🔷 Support & Consolidation: Price found solid support at the lower...
US100 (Nasdaq) Price Action Breakdown – July 31, 2025 🧩 Technical Analysis Summary: 📌 Market Structure: Bullish Structure: The chart has maintained a consistent bullish channel across multiple sessions, confirmed by higher highs and higher lows. Break of Structure (BOS): Multiple BOS points indicate strength in upward moves and validation of bullish trend...
Market Structure Analysis Trend Overview: The market initially moved bullishly, breaking structure to the upside (noted by BOS near the mid-chart). This was followed by a Change of Character (CHoCH), suggesting a potential shift in momentum from bullish to bearish. The price then moved into a clear downtrend, confirmed by successive Breaks of Structure (BOS) to...
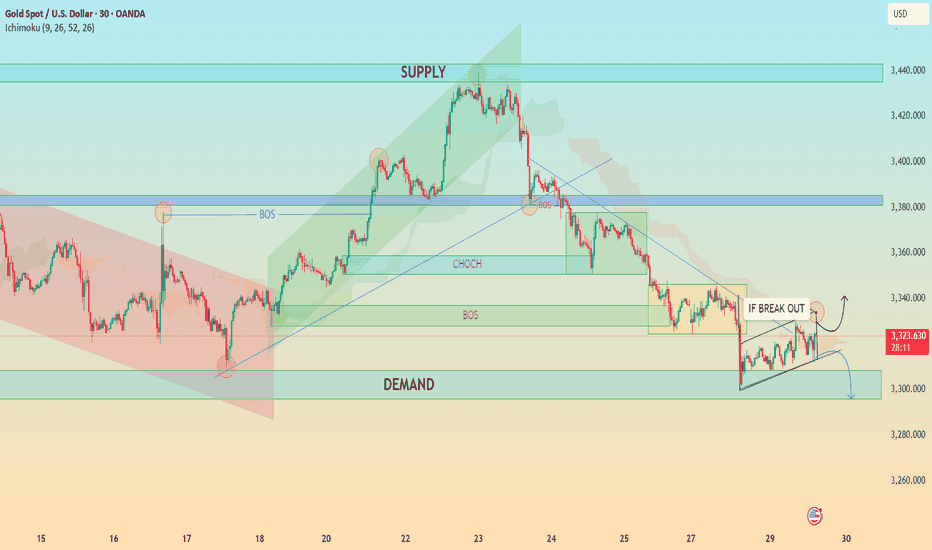
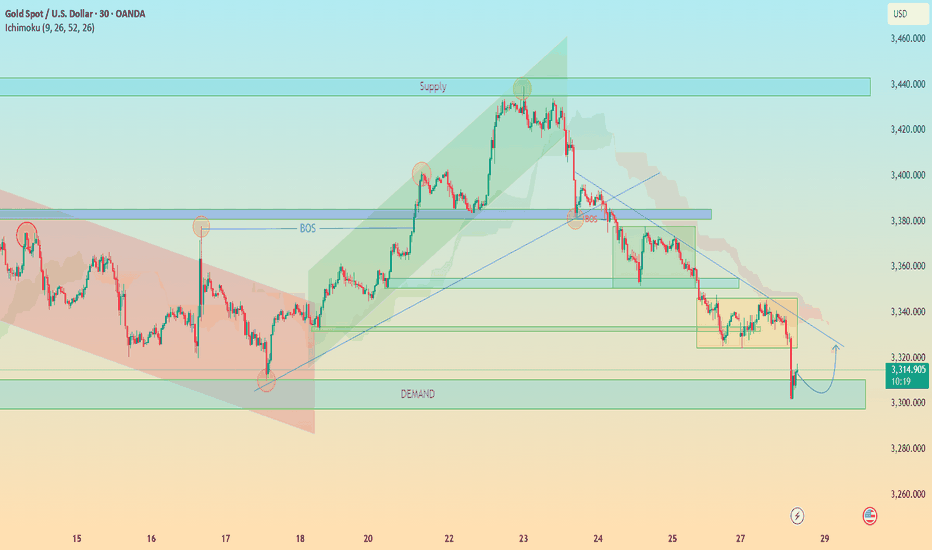
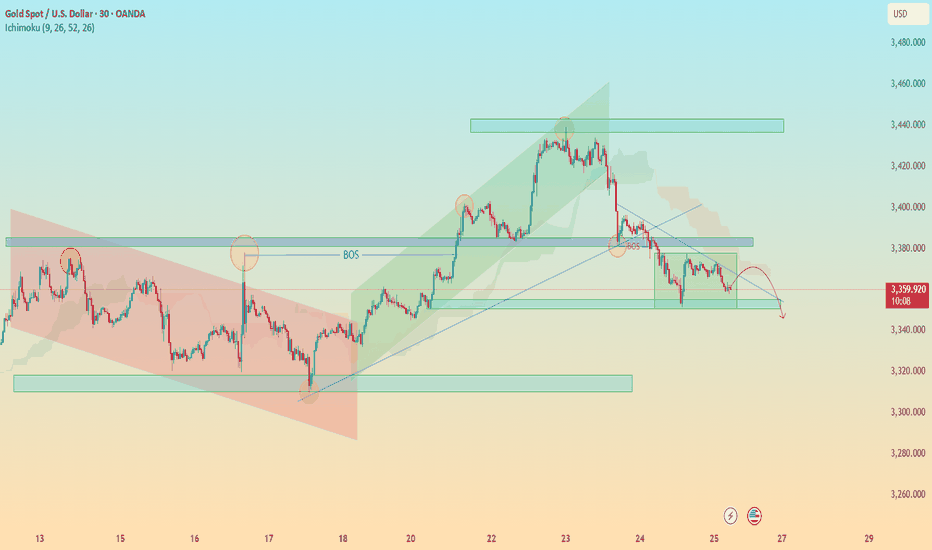
📈 XAU/USD Analysis – Critical Breakout Zone Approaching (30-Minute Chart) 🔍 Technical Overview: Chart Type: 30-minutes Indicators: Ichimoku Cloud Key Structures: Supply & Demand Zones, CHoCH, BOS, Trendlines, Triangle Formation 🔑 Key Market Observations: 🟢 Demand Zone (Support) ~ $3,300 – $3,310 This area has been tested multiple times and has shown strength in...
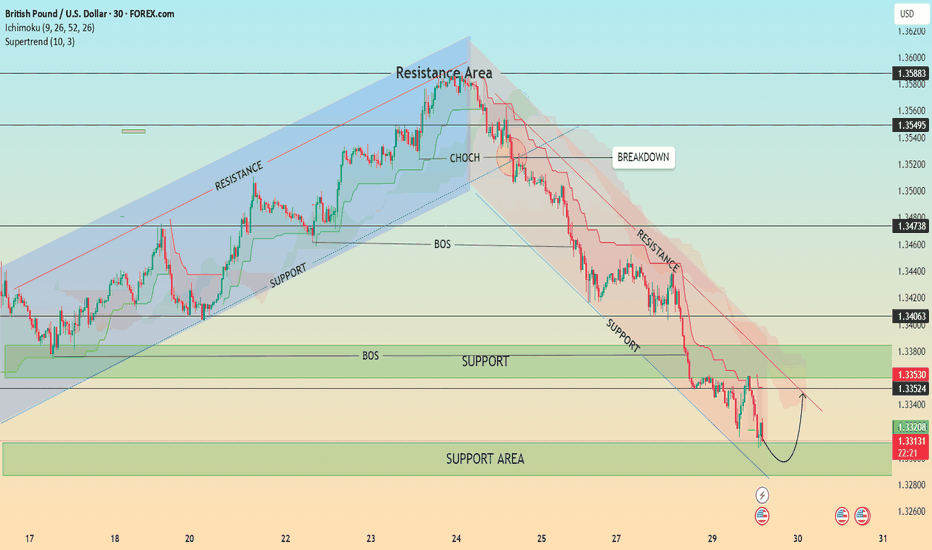
📊 GBP/USD – Bearish Structure with Possible Short-Term Pullback Timeframe: 30-Minute | Date: July 29, 2025 Price action recently broke down from a well-respected ascending channel, confirming a shift in market structure with a Change of Character (CHOCH) followed by a Break of Structure (BOS). Since then, GBP/USD has been respecting a descending trend channel,...
Chart Analysis Breakdown (30m TF – Gold/USD) 1. Market Structure Overview Bearish Trend Dominance: The price has shifted into a bearish structure after a Break of Structure (BOS) to the downside, indicating bearish control after failing to sustain higher highs. Lower Highs & Lower Lows: A consistent formation of LHs and LLs confirms bearish momentum. 2. Key...
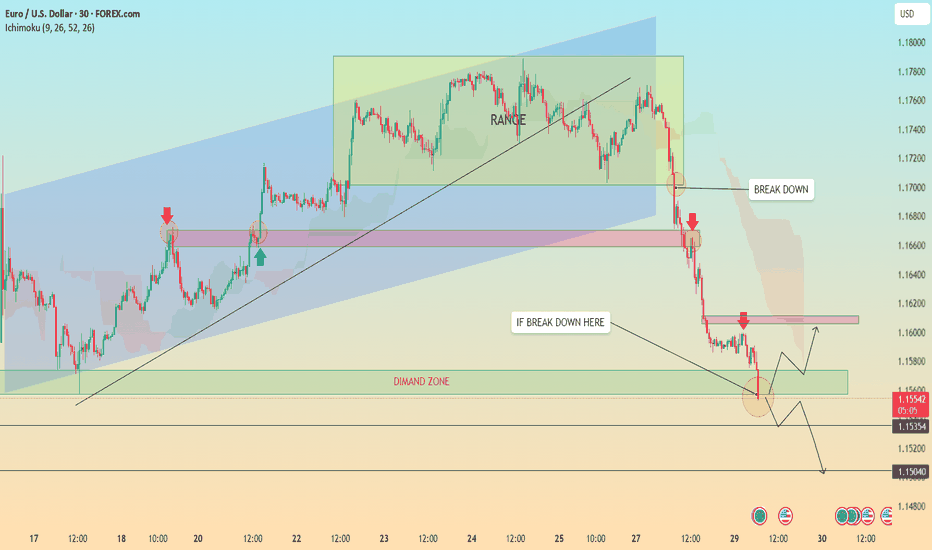
🔍 Chart Breakdown: EUR/USD (30-min TF) Trend Overview: Previous Trend: Bullish channel structure (highlighted in blue). Current Momentum: Strong bearish breakdown following a clear range phase. The chart shifted from consolidation → breakdown → aggressive bearish continuation. 🧱 Key Technical Highlights: 1. Bearish Breakout: Price broke below the ascending...
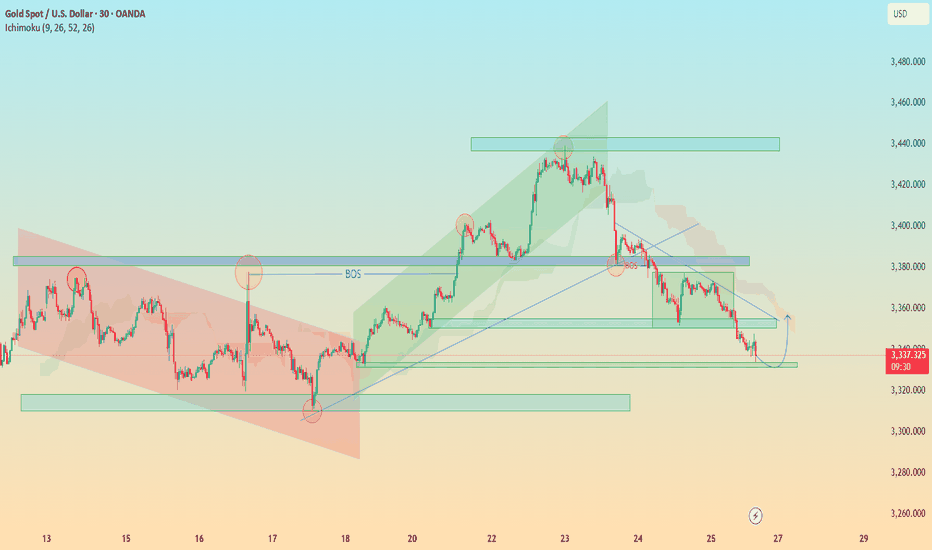
🟡 XAU/USD (Gold) – Demand Zone Rejection in Play | Bullish Correction Ahead? Timeframe: 30-Minute | Date: July 25, 2025 Created by: AllyPipsExpert Indicators: Ichimoku Cloud, BOS (Break of Structure), Dynamic S/R, Trendlines --- 🔍 Technical Analysis & Key Insights: 🔸 1. Market Recap – Distribution & Downtrend Confirmation: After the Break of Structure (BOS)...
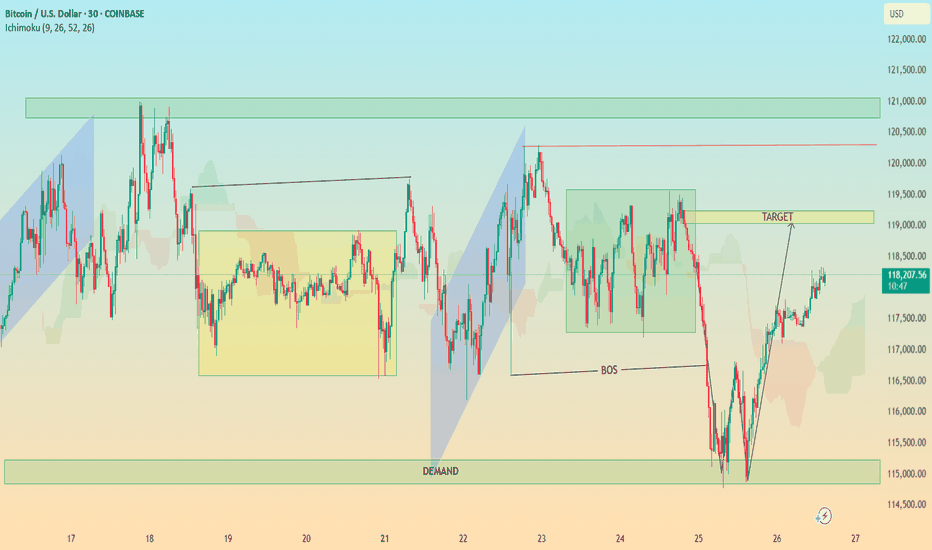
🔍 In-Depth Technical Analysis: BTC/USD (30-Min Chart) 🟩 1. Demand Zone Reaction Location: ~$114,500 – $115,500 Significance: Price sharply reversed after a strong move into this demand zone. This zone coincides with a liquidity grab below previous lows — textbook Smart Money trap. Volume (if checked) would likely spike here, indicating institutional...
🔍 XAU/USD (Gold) – Bearish Reversal Outlook Timeframe: 30-Minute Date: July 25, 2025 Indicators Used: Ichimoku Cloud, BOS (Break of Structure), Trendlines, Support & Resistance Zones --- ⚙ Technical Breakdown: 1. Previous Market Structure – Accumulation to Expansion: Descending Channel (Red Box): Market moved within a bearish channel until the breakout...


