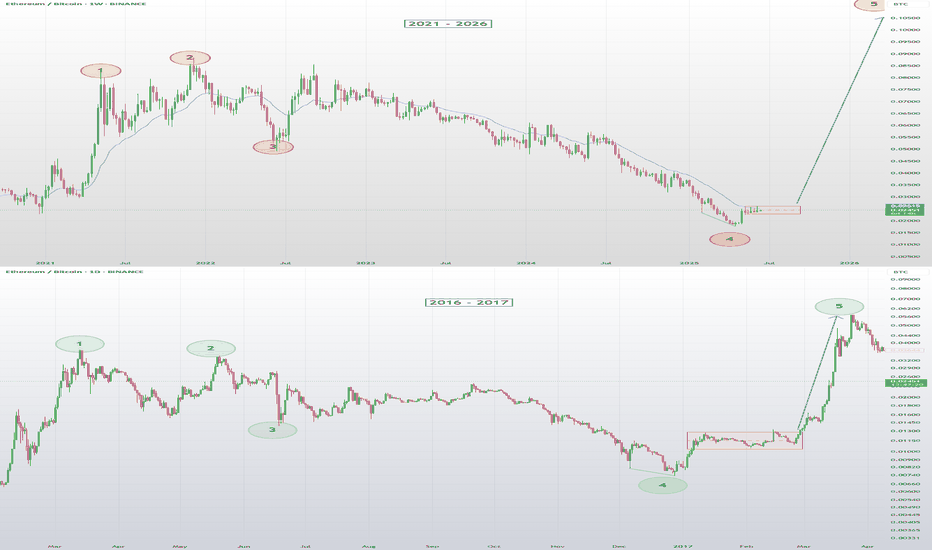
ETH is has been following the same steps as it did in 2016 cycles. Which means ETH is in a final stage of acculation, it's highlited as square box with number 5. Final Shakeout, Final Opportunity The last time ETHBTC looked like this, it went vertical. This box represents peak boredom for maximum breakout. This may be the last cheap ETH in BTC terms before...
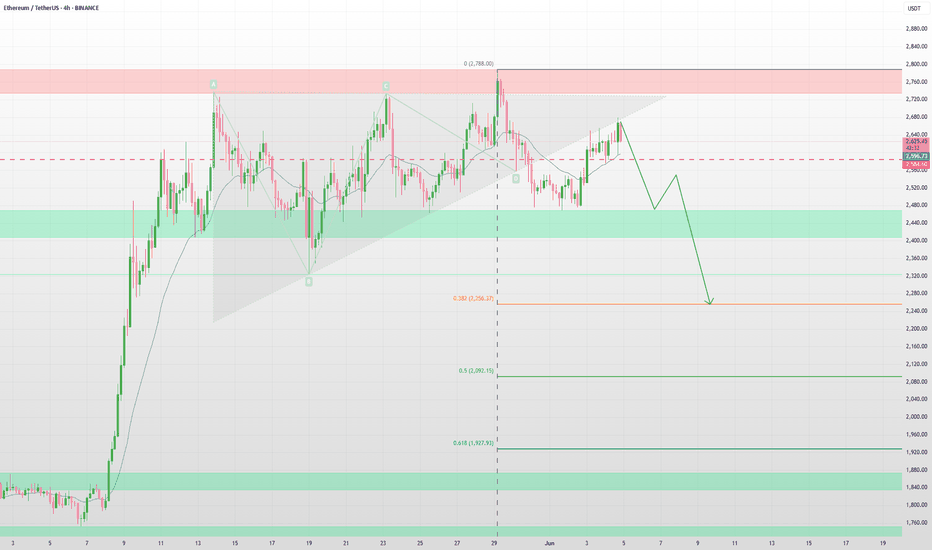
🧱 Breakdown Retest Structure The triangle/wedge was broken to the downside around May 28–30. After the breakdown, price has rallied back and is now hovering around the lower boundary of the broken triangle—classic bearish retest behavior. This structure often plays out as: Breakdown → retest of support as resistance → continuation down. 🔴 Confluence...
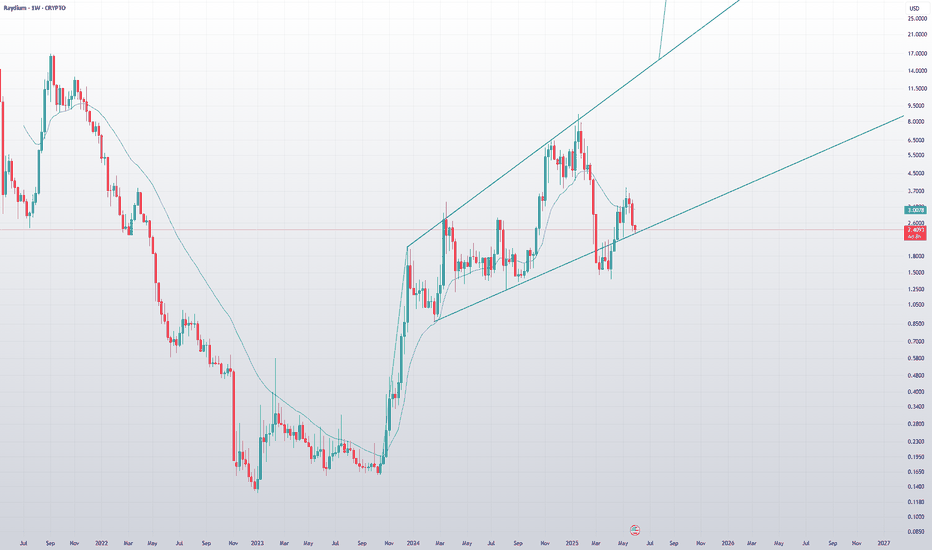
Raydium is currently trading within a well-defined ascending channel, respecting both support and resistance since early 2024. After a healthy pullback to the lower trendline, price has shown a bounce, suggesting renewed buying interest at this key level. 🔍 Pattern Observations: Price is holding the channel support strongly, confirming it for the third time. ...
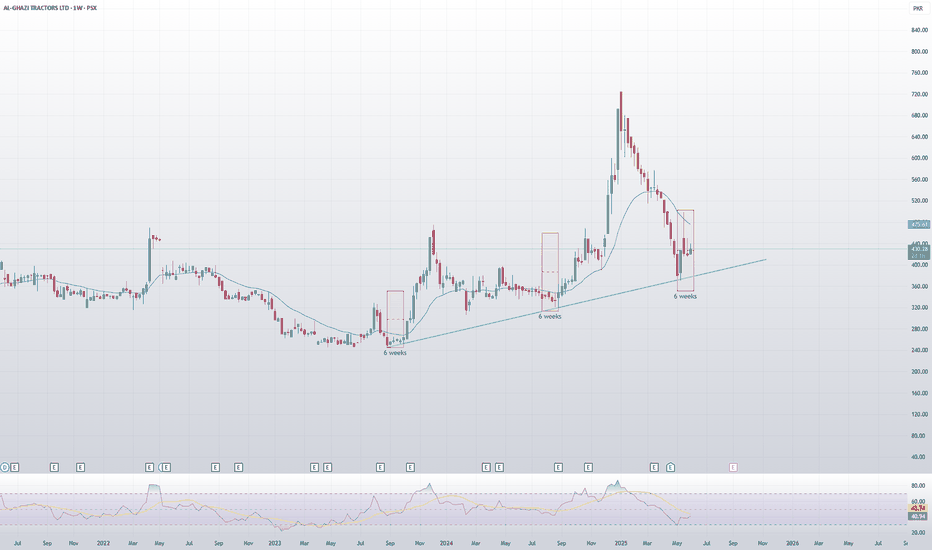
🟢 Consistent Bullish Reaction from Trendline Support Trendline Support: Price is respecting a strong ascending trendline that has been tested multiple times since 2023. Key Observation: Each time price touches the trendline, it consolidates for exactly 6 weeks. After this 6-week consolidation, AGTL typically enters a strong bullish rally. 🔁 Repeating...
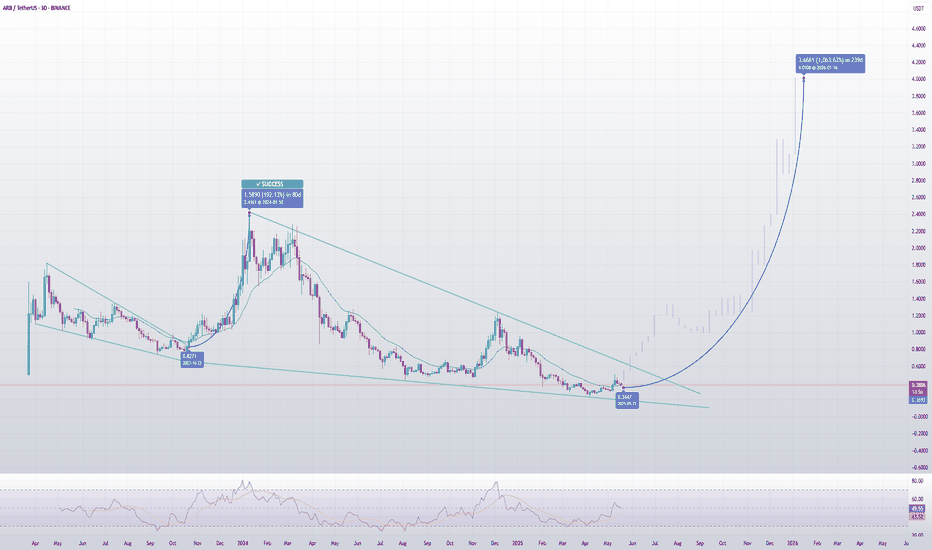
The chart illustrates a macro falling wedge pattern on the 3-day timeframe — a bullish reversal structure commonly found at the end of a downtrend. A similar pattern previously played out in mid-2023, resulting in a sharp bullish breakout and a 2x price rally. 🟢 First Falling Wedge (2023) Pattern: A falling wedge formed mid-2023. Breakout: Price broke...
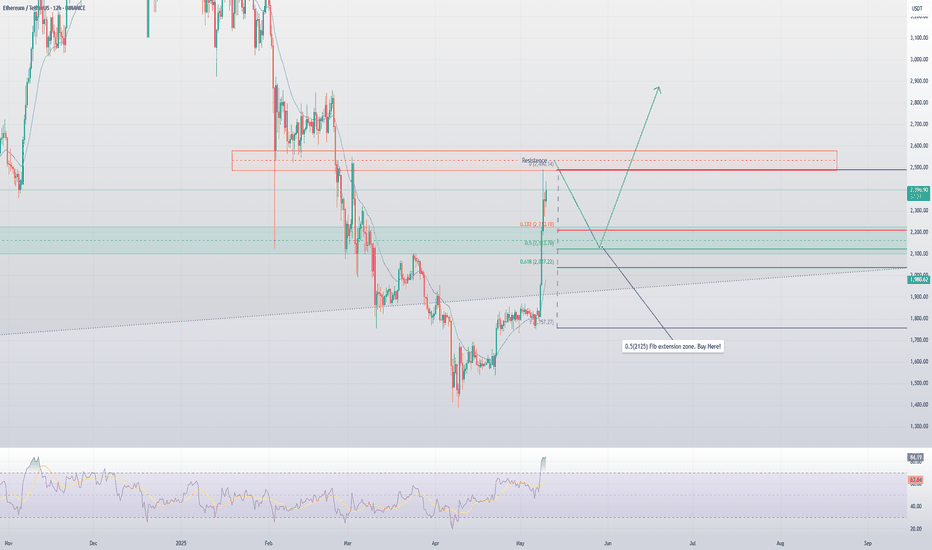
Ethereum has shown a strong impulsive rally from the $1,750 zone, breaking through key resistance levels. Now, price is approaching a major supply zone and resistance between $2,450–$2,600, suggesting a potential pullback. 🔹 Technical Highlights: The current move is a clean vertical impulse leg with little consolidation — a retracement is likely before...
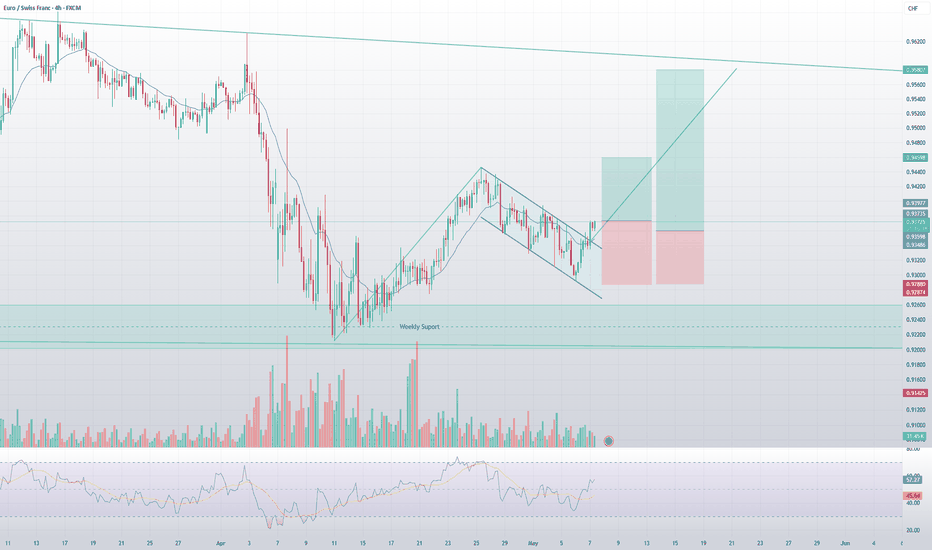
EUR/CHF is showing strong bullish potential on the 4H timeframe, having just broken out of a bullish flag formation after a clean bounce from a weekly support zone. 🔹 Technical Highlights: The pair formed a downward-sloping consolidation channel (flag) following a sharp impulsive move upward – classic bullish flag behavior. Price broke above flag resistance...
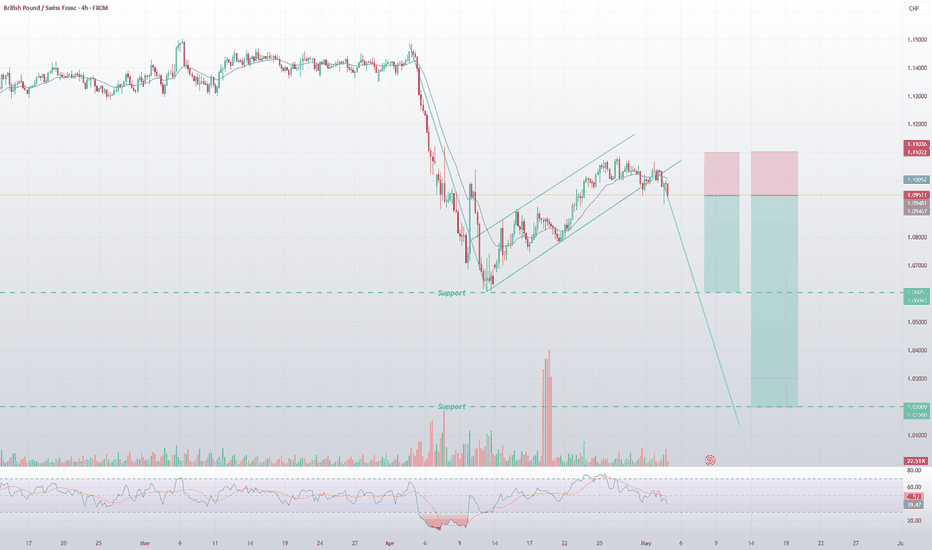
The pair has completed a textbook bearish flag pattern on the 4H timeframe, signaling a continuation of the strong downward move that started in early April. The recent consolidation channel (flag) has broken to the downside, confirming bearish momentum. 🔻 Technical Breakdown: Price rallied in a corrective upward-sloping channel (bearish flag) following a steep...
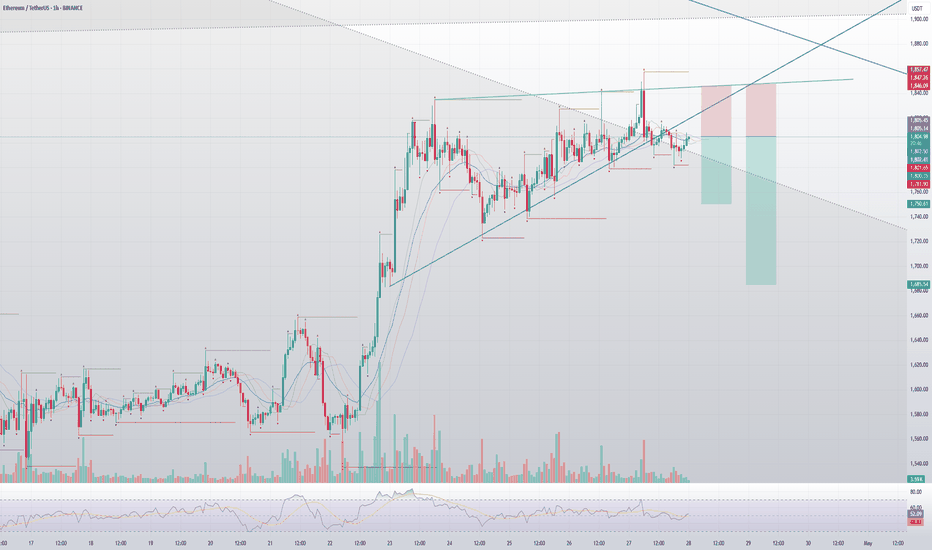
Ethereum has officially broken down from the rising wedge pattern on the 1-hour chart, confirming a bearish reversal. The wedge breakdown was accompanied by a clear bearish divergence between price and RSI, where price made higher highs but RSI formed lower highs — a strong early warning of weakening bullish momentum. 🔻 The price action has now closed below the...
USD/CAD is currently forming a bullish reversal setup on the weekly timeframe, suggesting a potential longer-term move to the upside. Right now, the price is rebounding from a long-term ascending trendline, which has acted as dynamic support since 2021. This level also aligns with a prior resistance-turned-support zone, adding confluence. Volume has spiked...
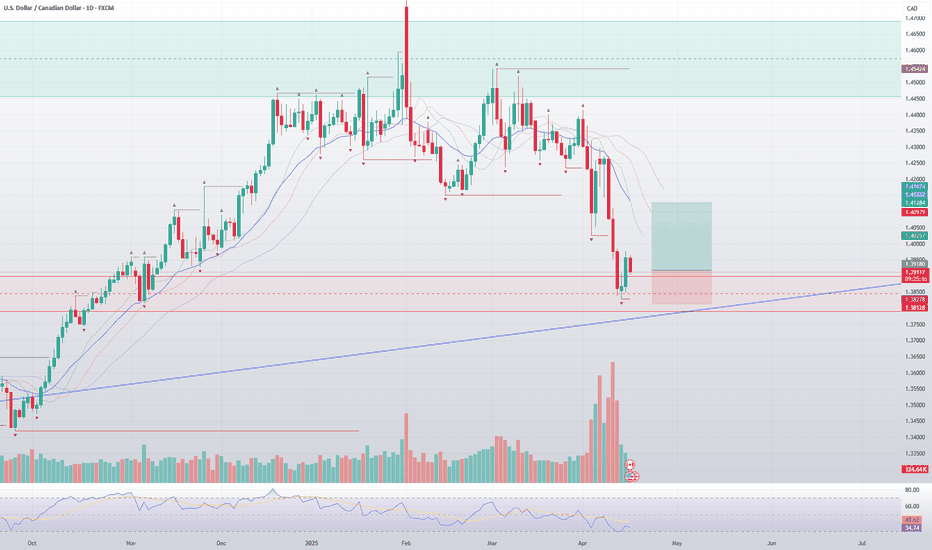
USD/CAD is currently forming a bullish reversal setup, which often signals a potential upside move. Right now, the price is testing a key support and a historical demand zone, while also printing a Morning Star candlestick pattern on the daily timeframe, which is a classic bullish reversal signal. ⚠️ If buyers hold the trendline and we see a breakout above the...
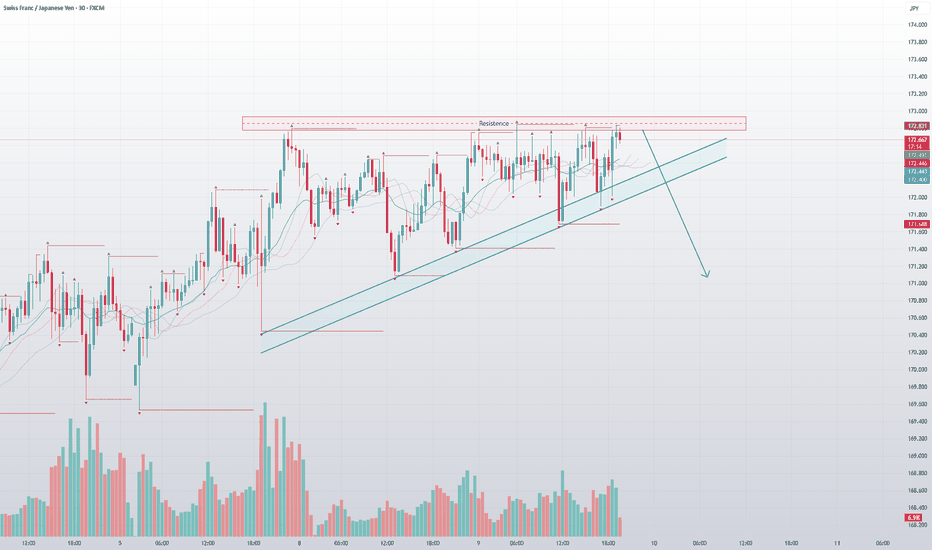
CHFJPY is currently trading within a rising wedge pattern — a classic bearish setup! 📐 Right now, it's facing strong resistance around the 172.860 level. This could be a great short opportunity if bearish momentum kicks in. 🚨 A confirmed breakdown below the wedge could trigger a sharp drop toward 171.102. 🔻 Two Trade Setups to Consider: 1️⃣ Short from Current...
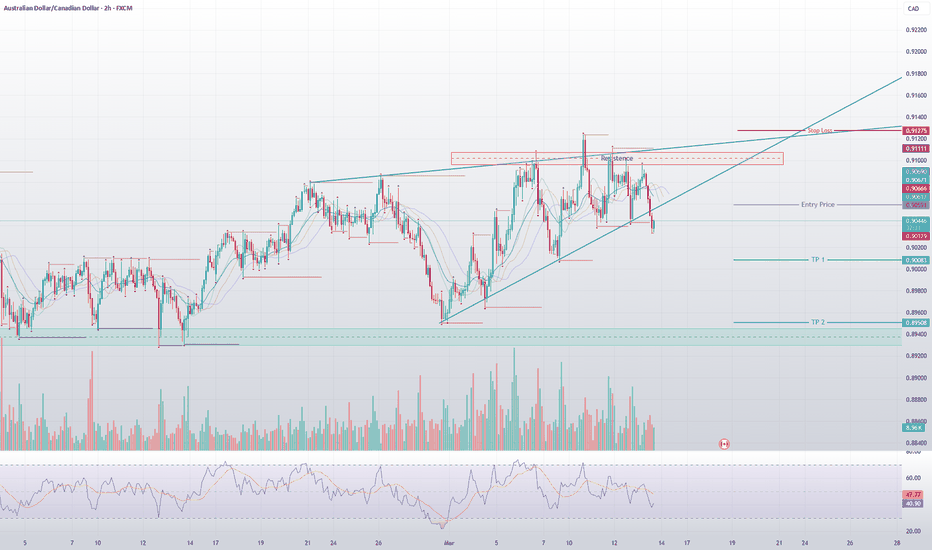
📉 AUDCAD has broken down from a rising wedge pattern, signaling potential bearish momentum. A confirmed breakout below support suggests further downside. Targeting key support levels with a tight stop-loss above the wedge resistance. 🔎 #AUDCAD #Forex #Trading #RisingWedge #PriceAction #TechnicalAnalysis #ForexSignals
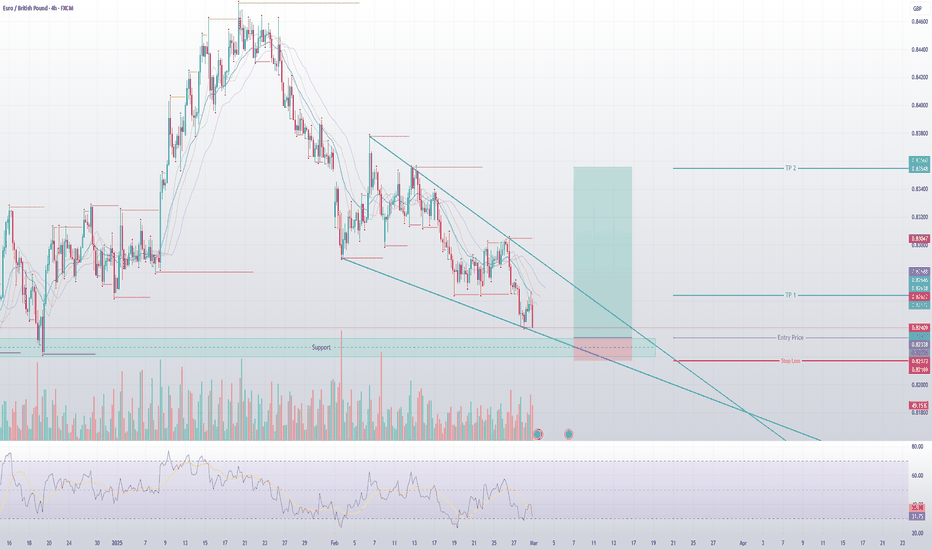
EURGBP is trading in a Falling Wedge Pattern which is Bullish indication. It is recommended to look for a buying oppurtunity near the Support zone at 0.82339 . Stop losse should be below the support zone at 0.82170 #EURGBP #Forex
The GBP/USD pair has formed a bearish AB=CD pattern on the daily chart, signaling a potential trend reversal. After completing the C-leg retracement, price is expected to decline towards the D-point, aligning with key support levels. A confirmed rejection at resistance strengthens the bearish outlook, Stop loss: 1.2823 Profit targets: 1.2150 and 1.1814. This...
Gold (XAU/USD) is testing a strong support zone after a bearish move. This level has historically acted as a demand zone, making it a high-probability buying opportunity. Entry: Near the support zone around $2,880-$2,885 Stop Loss: Below the support at $2,862 to manage risk Take Profit 1: $2,920 – Previous resistance level Take Profit 2: $2,953-$2,964 – Upper...
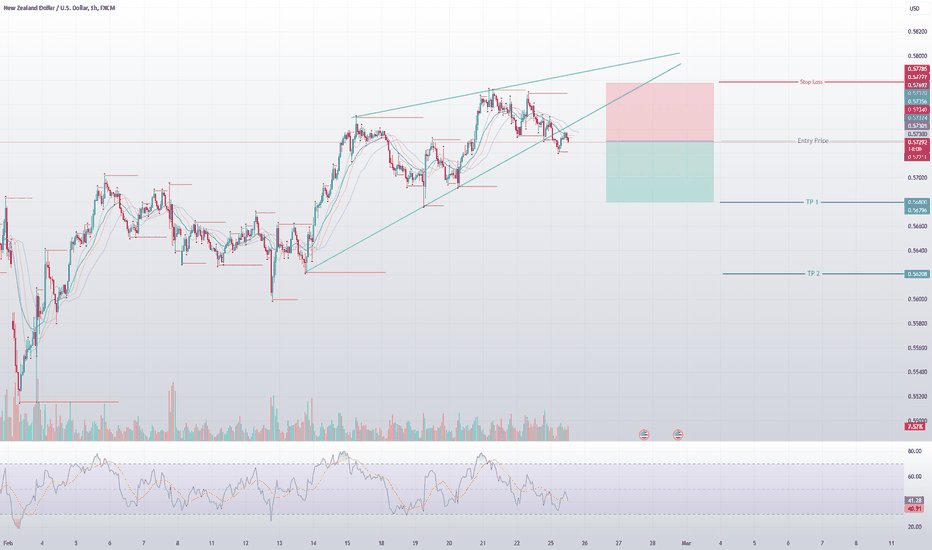
NZDUSD has broken out of a Rising Wedge pattern, signaling a potential bearish move. Rising wedges typically indicate weakening bullish momentum, and a breakout to the downside suggests that sellers are taking control. #NZDUSD #Forex #Breakout #PriceAction #SellSignal 🚀
