ChartPathik
PremiumChart Pattern Identification: The chart illustrates a Cup & Handle pattern validated on the 15-minute Nifty 50 Index. Pattern Validation: Pattern forms when price carves a rounded cup, retraces slightly to form the handle, and then breaks out above the neckline (24,750 zone here). Pattern Invalidation: The setup fails if price closes and sustains below the...
NSE:BANKNIFTY Here is a comprehensive intraday analysis for Bank Nifty based on the provided 15-minute chart for September 3, 2025. Trade Bias Bank Nifty ended the session in red, signaling continued downside pressure, especially with price closing below key support zones and hovering close to the Zero Line at 53,661. This reflects a bearish-to-neutral bias...
Welcome! Here is the intraday analysis for the Nifty 50 Index on September 3, 2025, blending key technical perspectives and practical trade strategy for the day. Trade Bias Nifty 50 closed in red, indicating continued bearish momentum and a follow-up of the prior higher pullback. The overall intraday bias is neutral-to-bearish unless the index decisively...
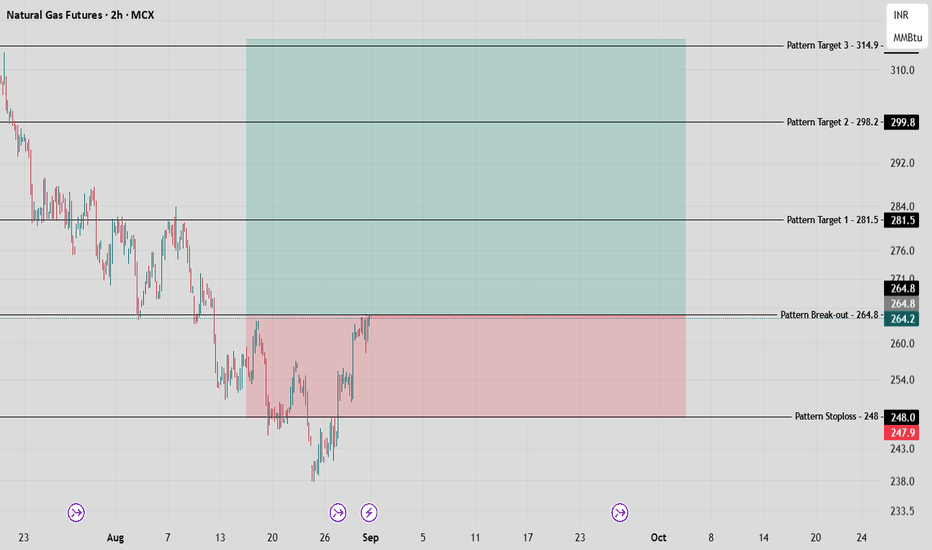
MCX:NATURALGAS1! Natural Gas Futures have printed a strong bullish engulfing pattern on the weekly chart, emerging after a prolonged downtrend—a classic sign that momentum may be shifting in favor of the bulls. Pattern & Setup Analysis The appearance of a large green candle fully engulfing the previous week's red candle signals growing buying pressure and...
MCX:CRUDEOIL1! For positional and swing traders in Crude Oil MCX Futures, weekly levels provide a clear directional blueprint for the week ahead. Weekly Key Levels Zero Line: 5654 — This is the pivotal level dividing bullish and bearish sentiment for the entire week. Any 1 hour candle closed before or above with a high or low break, is a bias hint for the week!...
NSE:NIFTY The Nifty 50 Index has shown a narrow recovery after testing support levels, and several key levels are providing actionable insights for intraday traders based on the chart. Nifty 50 Intraday Strategy — Key Levels to Watch Nifty 50 is currently resisting downside momentum and holding above the Zero Line at 24,427. Bulls should closely monitor the...
NSE:NIFTY Date: 28 August 2025 Trade Summary: The directional bias remains negative with preference for selling on rise until 24,920 is crossed. Short trades are favored below 24,777 with momentum confirmation once the zero line at 24,712 is broken. Long trades are possible only as a counter move above 24,805–24,832 but are not the primary strategy. Trade...
Here is my Natural Gas Futures (MCX, 1H) chart classic—candlesticks analysis. Pattern Identification: The Bearish Pennant I’ve spotted a textbook bearish pennant. Here’s how it forms and functions: The pattern starts with a pronounced downward thrust (the flagpole), reflecting strong selling momentum. Price action then contracts into a symmetrical triangle,...
Nifty 50 Index Chart Pattern Analysis - 19th Aug., 2025. As a technical chart analyst, I’ve identified a classic symmetrical triangle breakout on the Nifty 50 Index’s 15-minute chart. This pattern forms when price action moves into a tightening range, and both buyers and sellers hesitate, creating converging trend lines. This signals a buildup of momentum that...


