CryptocurrencyWatchGroup
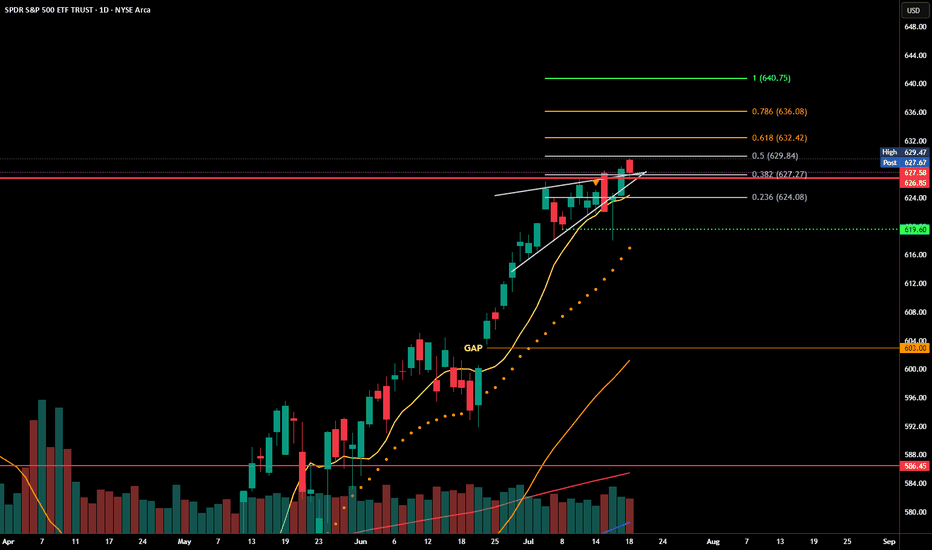
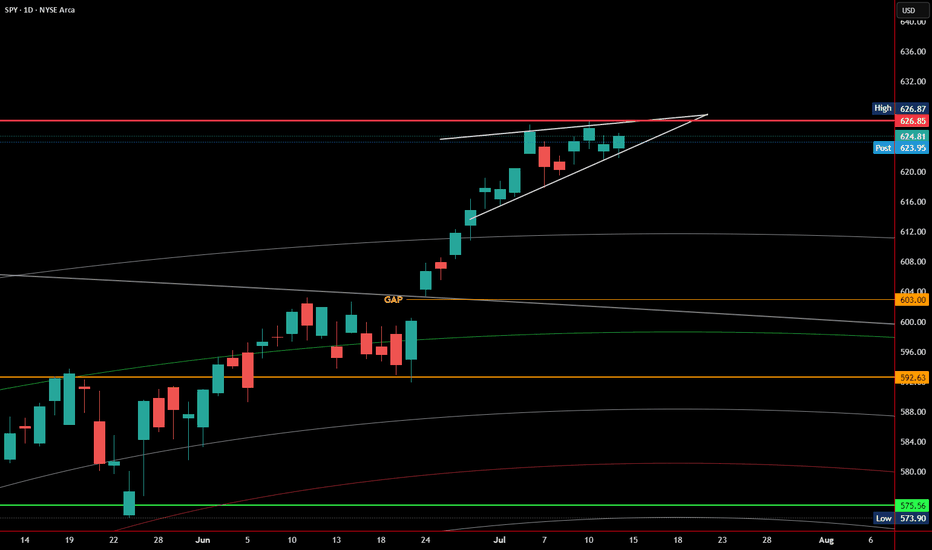
PremiumSPY dropped below its rising wedge earlier this week, but that move may have been a bear trap. Price quickly reversed, reclaiming the wedge trendline and closing just below a key Fibonacci level at 629.84. Buyers stepped in aggressively near the 0.382 and 0.236 retracement zones, defending short-term support. The bounce came on increased volume, signaling...
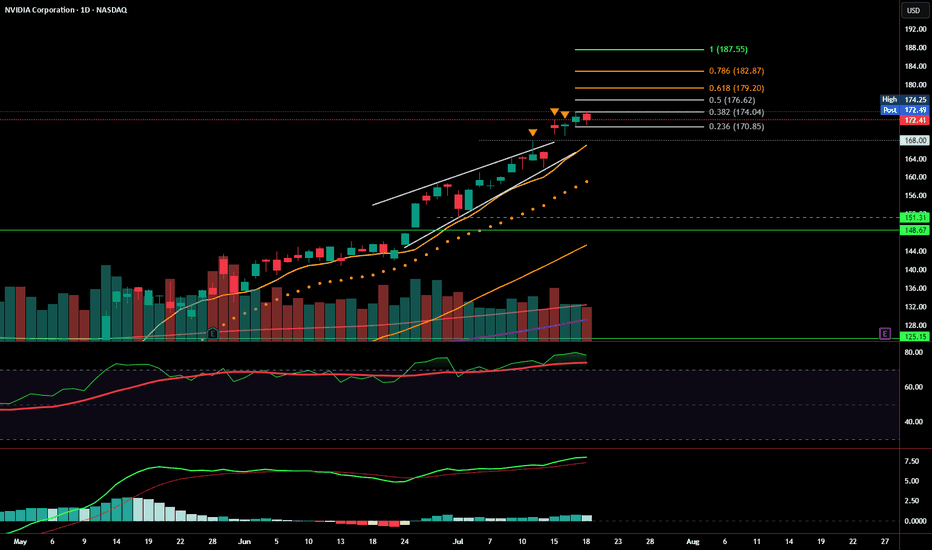
NVDA closed the week at $172.41, just under short-term resistance and holding well above the prior rising wedge structure. Price action remains technically bullish, with a healthy consolidation forming just below the 0.382 Fibonacci retracement at $174.04. That said, momentum is beginning to cool, and the next few sessions will be key. 📊 Current Read:...
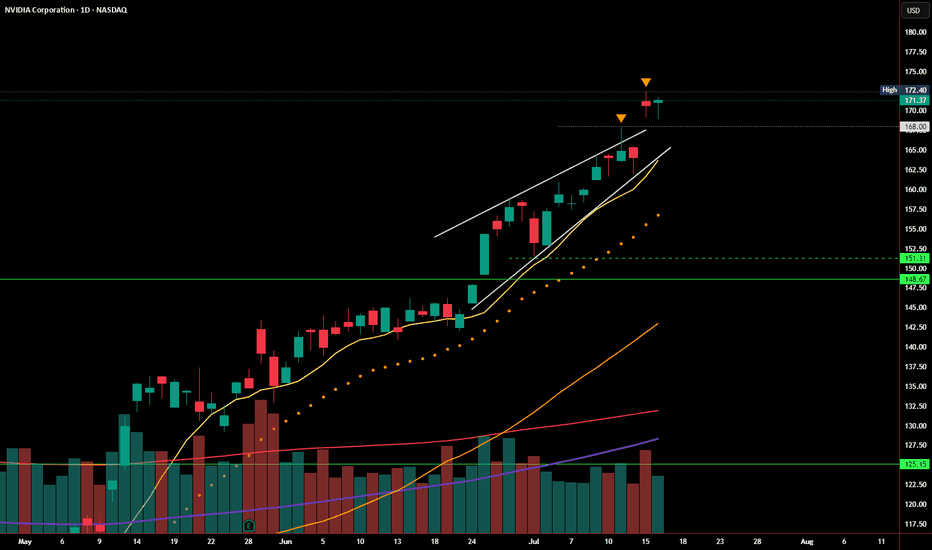
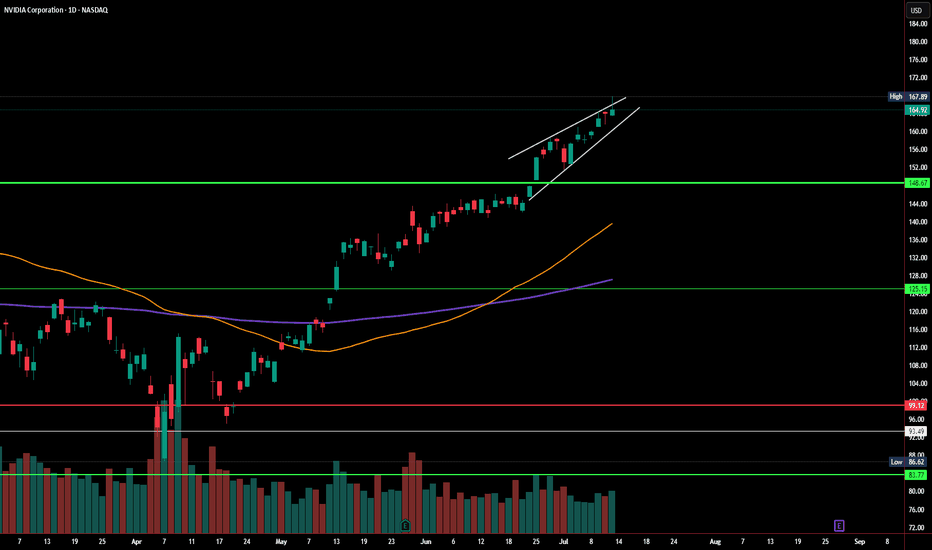
In yesterday’s post, I highlighted the rising wedge pattern and noted that a breakout above $168 needed strong follow-through to confirm. Today, NVDA managed to hold above that level, closing at $171.37, just beneath the recent high of $172.40. So far, the breakout attempt is intact — but not yet convincing. 🔹 Volume came in lighter, suggesting buyers aren’t...
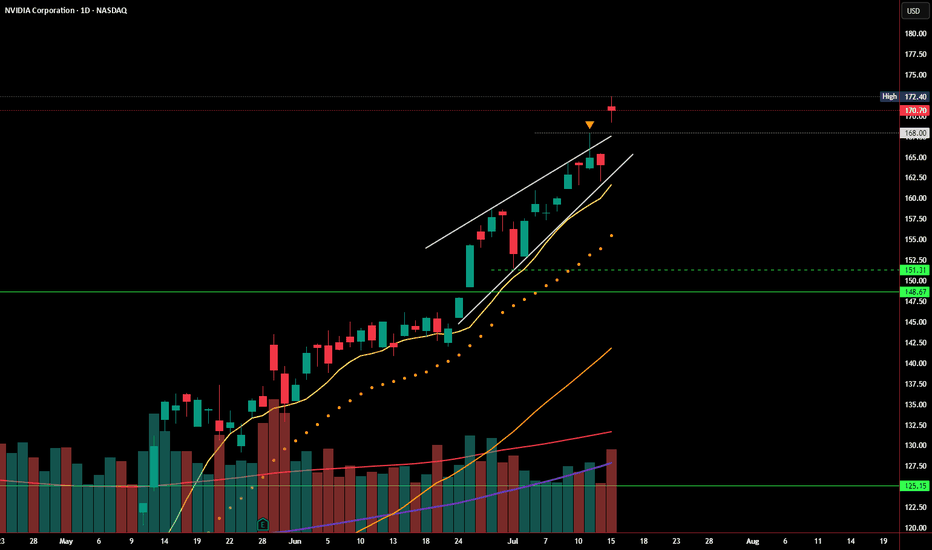
In my last post, I highlighted the rising wedge pattern forming at the top of NVDA’s strong rally. Price briefly pushed above the upper wedge resistance and tagged $172.40, but today’s session printed a bearish close at $170.70 — just above the breakout level, but with no real follow-through. Volume came in higher, but price action failed to extend the breakout,...
SPY continues to push higher, but today's candle reinforces a cautious tone as we approach a key inflection point. The chart is currently forming a rising wedge pattern — historically a bearish structure that often precedes downside breaks, especially when forming after a strong upside move. Price is hugging the upper boundary of the wedge, with multiple failed...
Just analyzed this NVDA setup. We’re seeing a clear rising wedge forming near the top of a strong run-up — typically a bearish reversal pattern. Price tagged $167.89 and pulled back slightly, closing at $164.92. If this breaks down, watch the $148.67 - 151.31 area, and below that $125 as a key level. Bulls want to see a strong hold and breakout above $168 to...
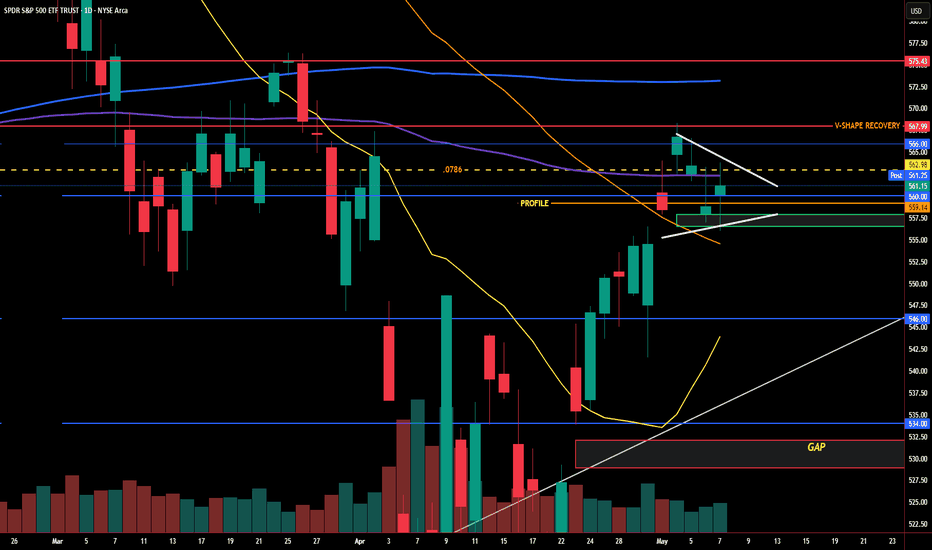
The SPDR S&P 500 ETF Trust (SPY) is exhibiting a classic technical setup that may lead to a significant price move. As of early May 2025, SPY is consolidating within a symmetrical triangle, a pattern commonly associated with periods of indecision and coiled momentum. The Technical Setup A symmetrical triangle forms when the price creates lower highs and higher...
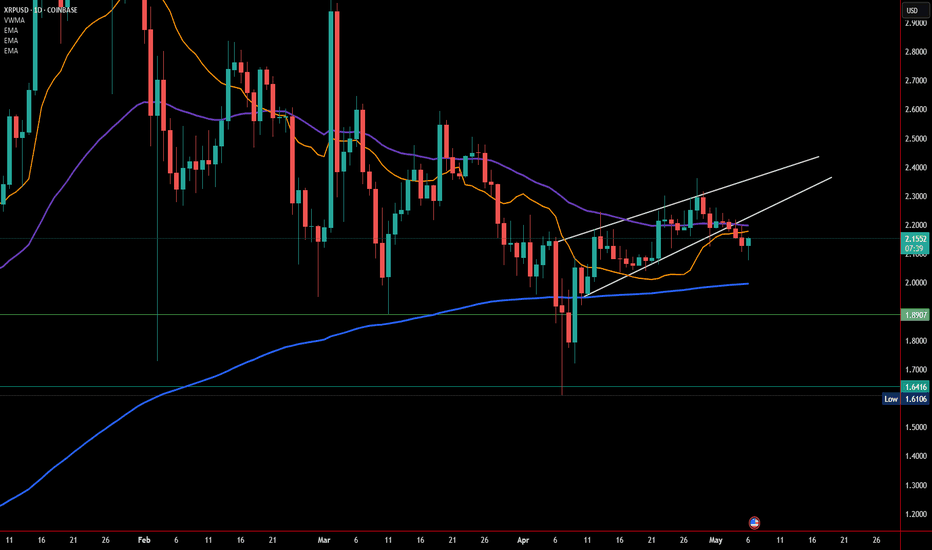
XRP has officially broken down from a rising wedge pattern on the daily chart, closing below its lower trendline support. This could signal the beginning of a short-term bearish phase unless key support levels hold up. Chart Breakdown On the daily timeframe, XRP was trading within a rising wedge—a pattern typically considered bearish when it breaks to the...
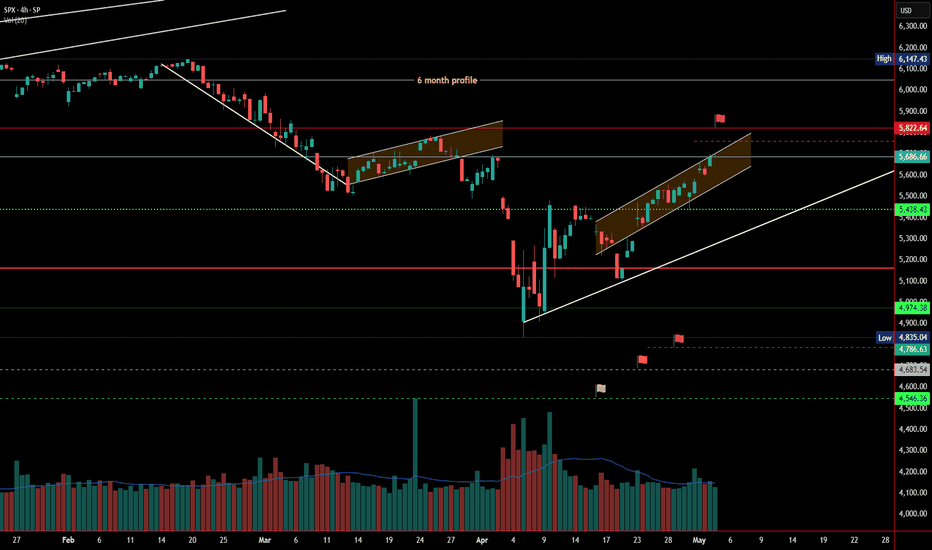
The SPX is currently trading within a rising wedge a bearish pattern that typically signals exhaustion of upward momentum. Price has now stalled right at the 200 EMA, a key dynamic resistance level, and today's close came just beneath it. If this rising wedge breaks to the downside especially with a confirmed rejection from the 200 EMA we could see accelerated...
On March 27, 2025, I published an analysis identifying the potential for a major bottom forming in the S&P 500 near 4,790.57: Original chart and analysis At that time, the index was consolidating just above key support, with growing downside pressure ahead of major economic reports. Despite broad caution in the market, the technical setup signaled a potential...
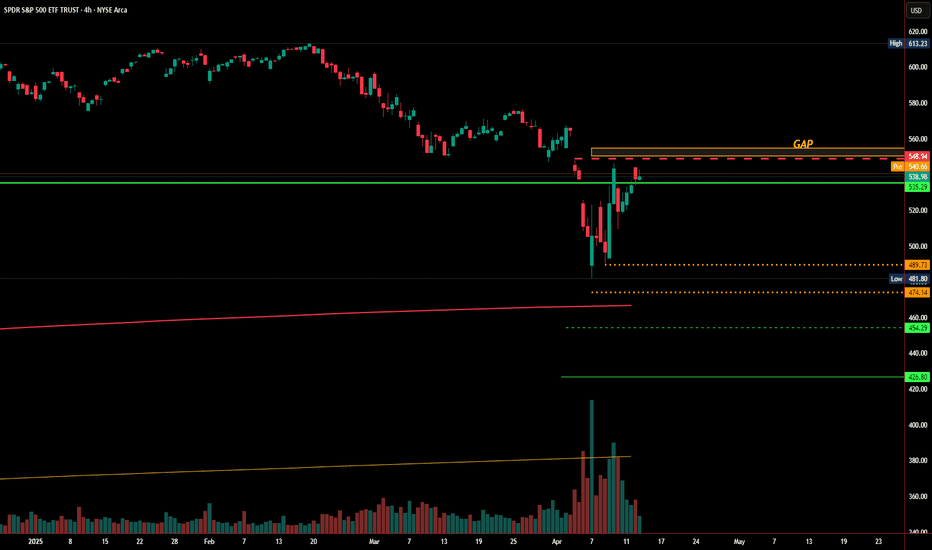
SPY has rallied sharply from its recent low, but it's now pressing into a critical resistance zone. Price is currently sitting just below a major unfilled gap between $539.54 and $548.94. Until this gap is filled and the market closes decisively above it, the broader downtrend remains intact and risk of a reversal is elevated. Current Price Action: SPY has...
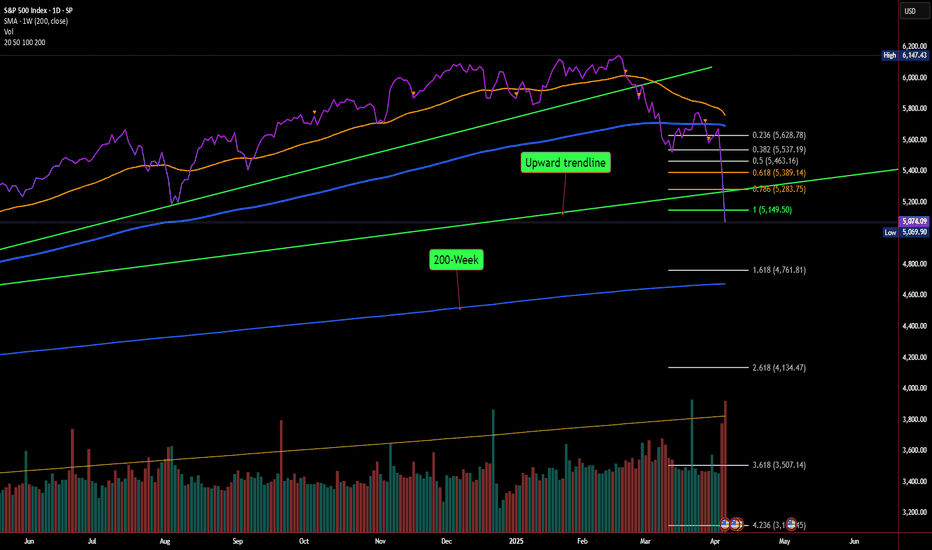
Last week, I warned in this post that if sentiment worsened, the S&P 500 could head toward 4,790 as a worst-case scenario. Fast forward to today, and the index has officially lost the 5,149 support level, opening the door for further downside. What Just Happened? 📉 Key Support Broken: The market just lost 5,149 (1.0 Fib retracement), which was a major line in...
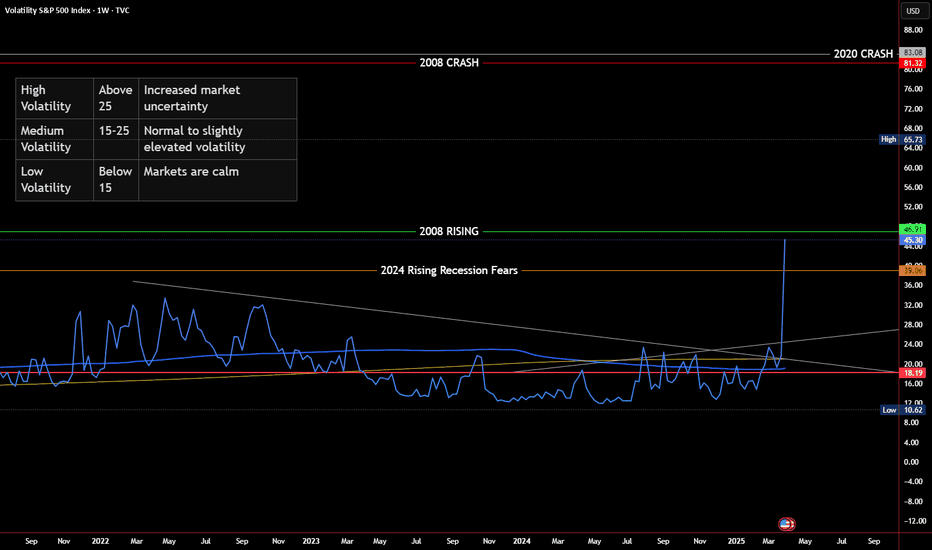
The Volatility Index (VIX) just skyrocketed 50.90% to 45.30! This is one of the largest single-day spikes in recent history, signaling extreme fear in the markets. Historically, VIX levels this high have only occurred during major financial crises like: ✅ 2008 Financial Crisis ✅ COVID Crash (2020) So, what’s driving this surge in volatility? 📊 Understanding the...
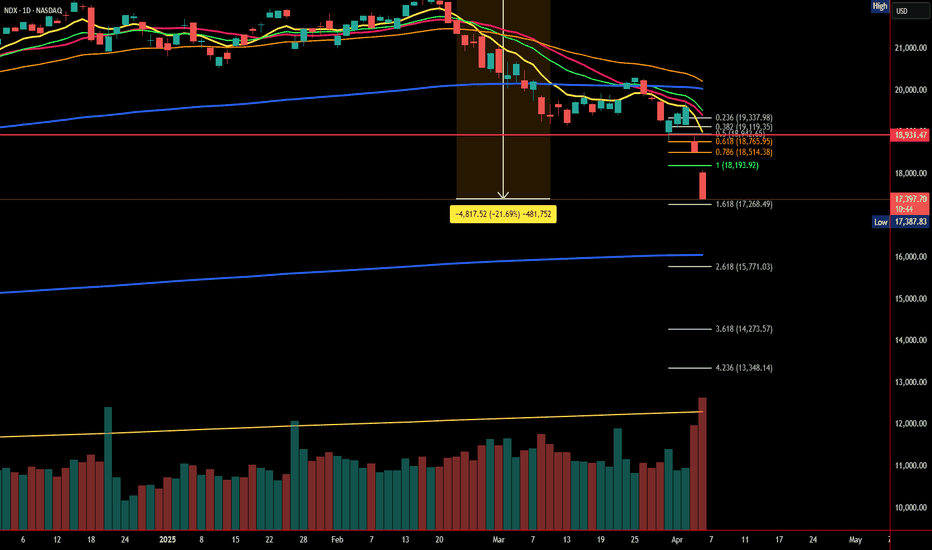
The NASDAQ 100 (NDX) just took a huge dive, dropping 21.69% from its recent highs. That officially meets the definition of a bear market (a decline of 20% or more). The question is: Are we going lower, or is a reversal coming? Let’s analyze the moving averages, Fibonacci levels, and key market signals to figure out what’s next. 📊 Moving Averages Breakdown: A...
Looking at this SPX Daily Chart, we’re seeing some clear signs of weakness in the market. 🔹 Breakdown from the Rising Channel – After months of uptrend, SPX has broken below its previous rising channel, signaling potential downside ahead. 🔹 Failed Recovery Attempt – The recent bounce formed a bear flag (highlighted in brown), but today’s sharp drop indicates...
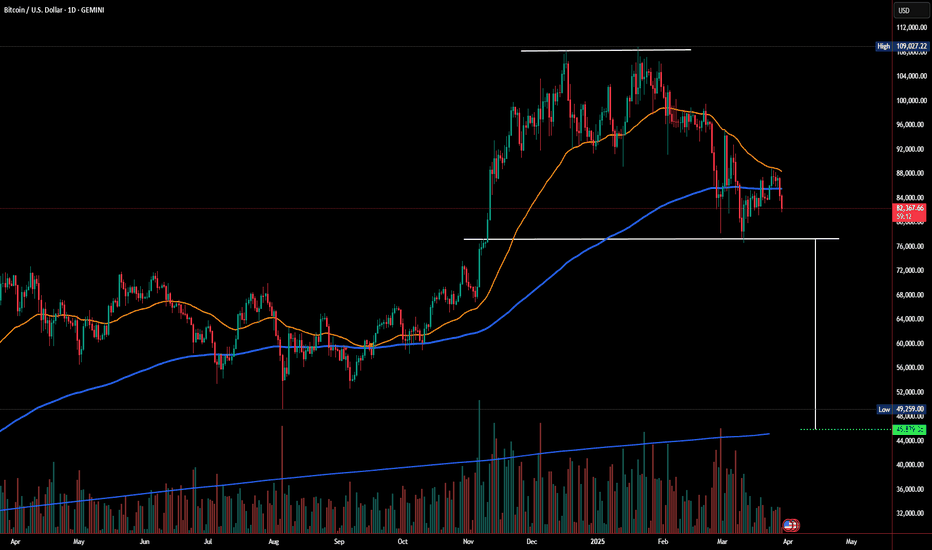
This daily BTC/USD chart is showing a potential Head & Shoulders pattern, which is a classic bearish reversal structure. But that’s not all Bitcoin is also at risk of forming a Death Cross, signaling deeper downside potential. Here’s what stands out: 🛑 Key Bearish Signals: 🔻 Head & Shoulders Formation: The pattern consists of a peak (head) with two lower...
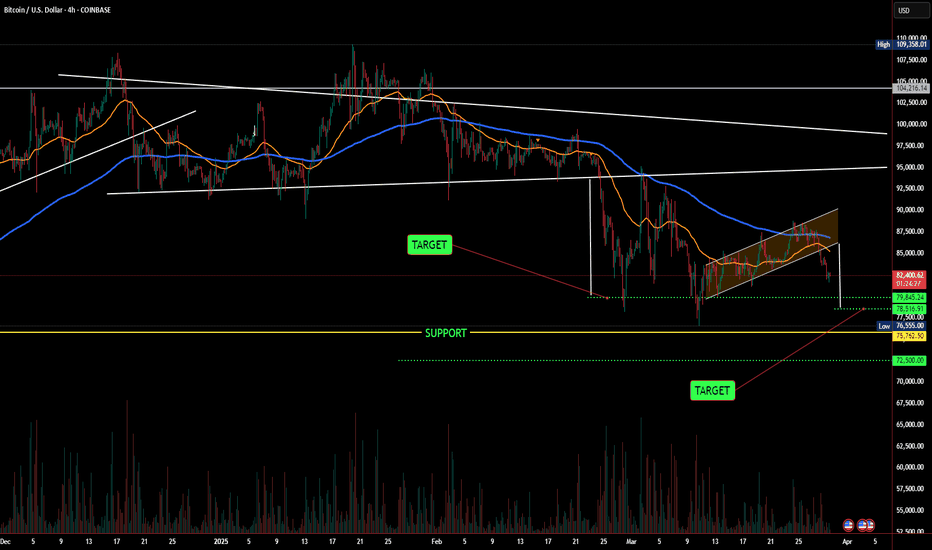
Bitcoin is showing clear signs of a breakdown from a rising wedge pattern, a classic bearish reversal structure. The chart suggests that BTC failed to sustain momentum above key moving averages and is now heading toward critical support zones. Key Observations: 🔹 Rising Wedge Breakdown: BTC recently broke below a rising wedge, indicating potential further...
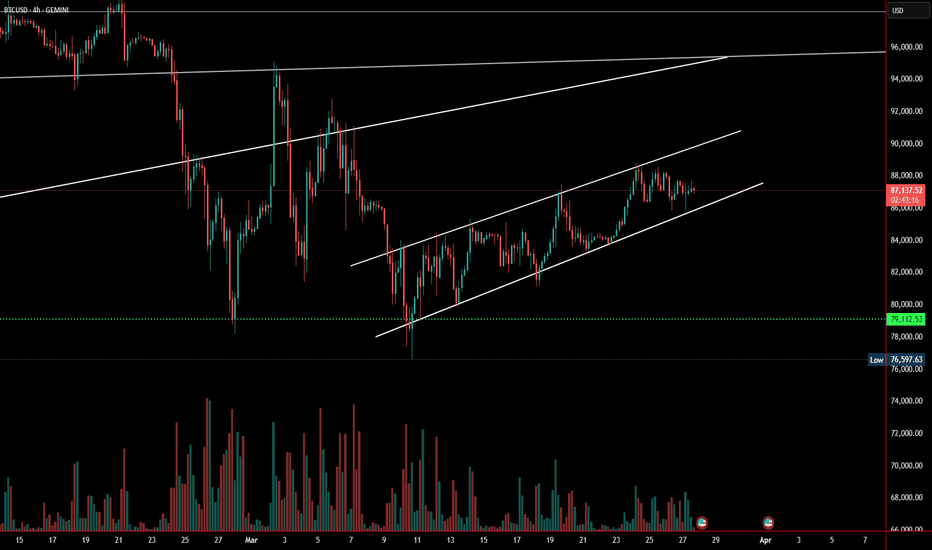
Bitcoin is currently trading at $87,201 on the 4-hour chart, consolidating within an ascending channel. Price action suggests that bulls are maintaining control, but a breakout in either direction could dictate the next major move. Key Observations Bitcoin remains in a short-term uptrend, forming higher highs and higher lows within the ascending...
