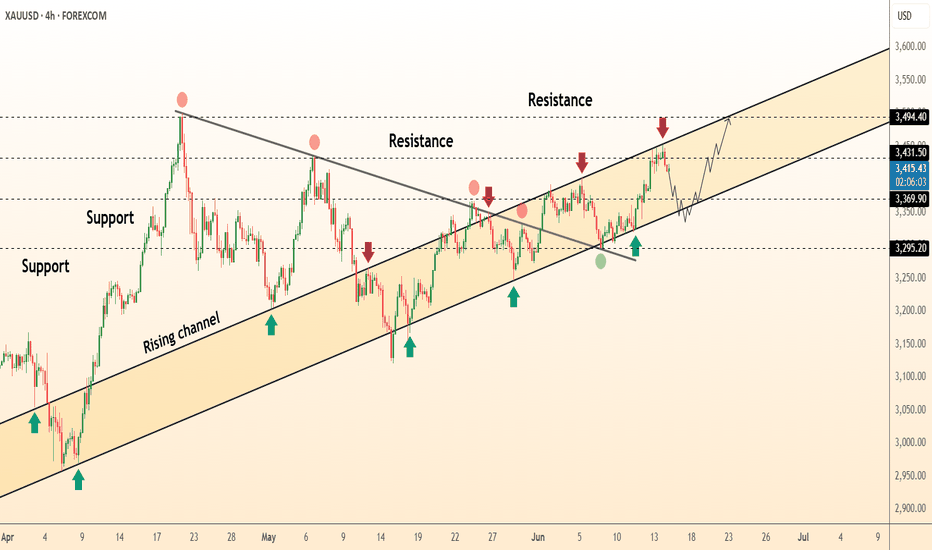
📊 Technical Analysis ● Price rejected the channel roof near 3 435 again, carving a small evening-star and slipping back under the May trend-median 3 370 — a repeat of April/May fades. ● Bearish RSI divergence plus a break of the micro up-sloper (last three sessions) tips for a rotation toward the lower rail/3 295 support; loss of that opens the April pivot at 3...
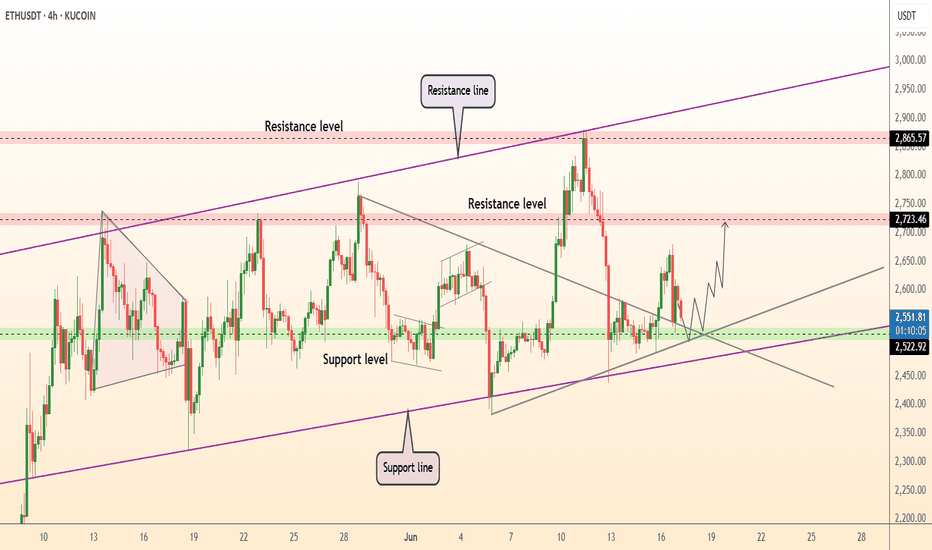
📊 Technical Analysis ● Price just printed a long-tailed rebound on the 4-month purple up-trend and the 2 520-2 560 demand strip, also reclaiming a broken pennant base—confirming a fake breakdown and locking the zone as fresh support. ● A higher-low sequence is compressing against the descending 2 650 trend cap; a 4 h close above it activates the 2 723 horizontal...
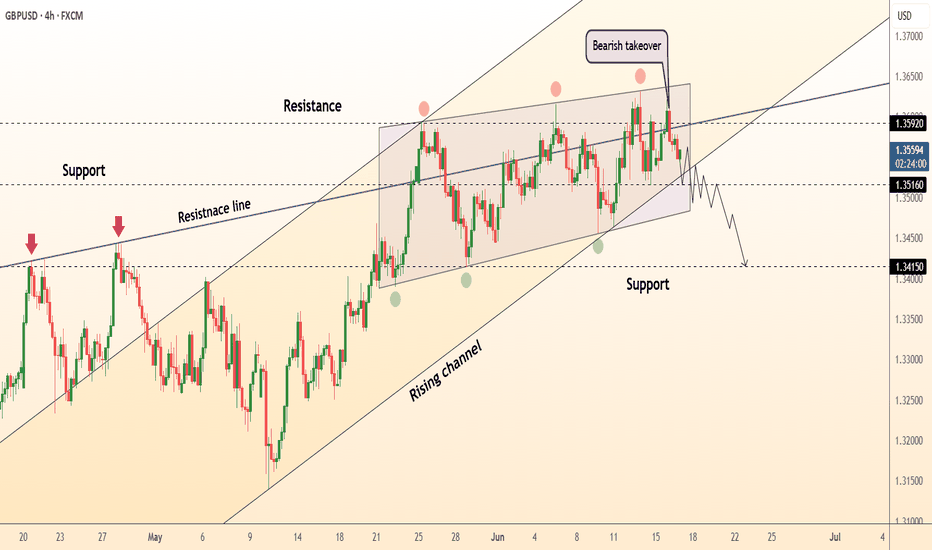
📊 Technical Analysis ● A five-week rectangle at the channel top has broken south after a bearish engulfing, turning 1.3550 into fresh supply; the break also pierces the inner purple resistance line that capped every rally since April. ● Momentum now points to the channel mid-band/May swing low at 1.3516; loss of that neckline activates the measured move toward...
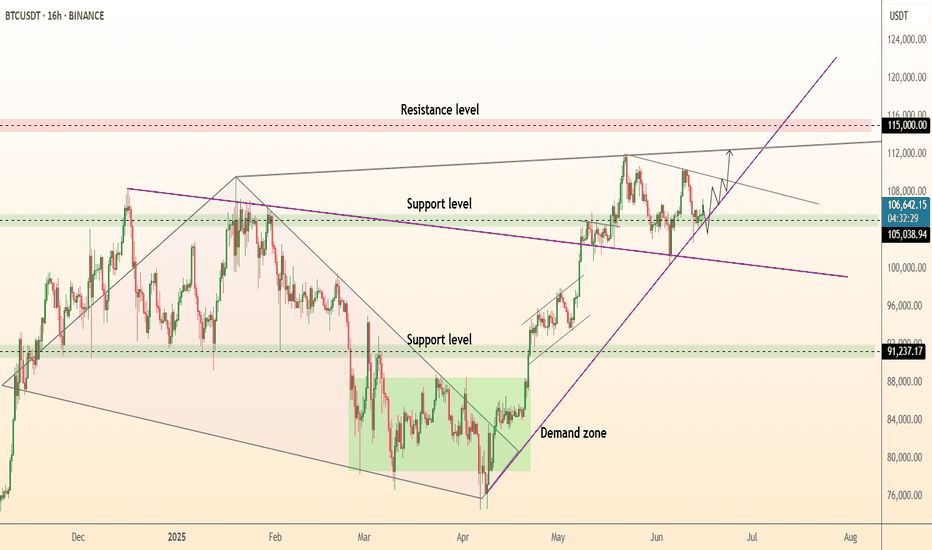
📊 Technical Analysis ● BTC rebounded exactly at the purple long-term trend-line and green 102.5-104 k demand, reclaiming the 105-106 k support band; the old wedge cap is now acting as a floor. ● Price is coiling in a 16-h bull flag beneath 108 k; its 1.618 projection intersects the channel roof/ red supply at 111.6-115 k, while rising lows keep momentum pointed...
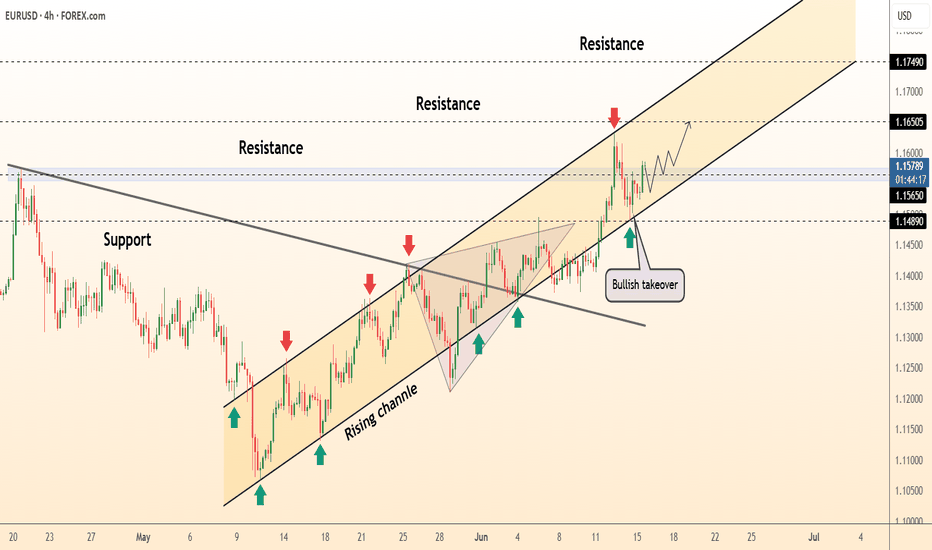
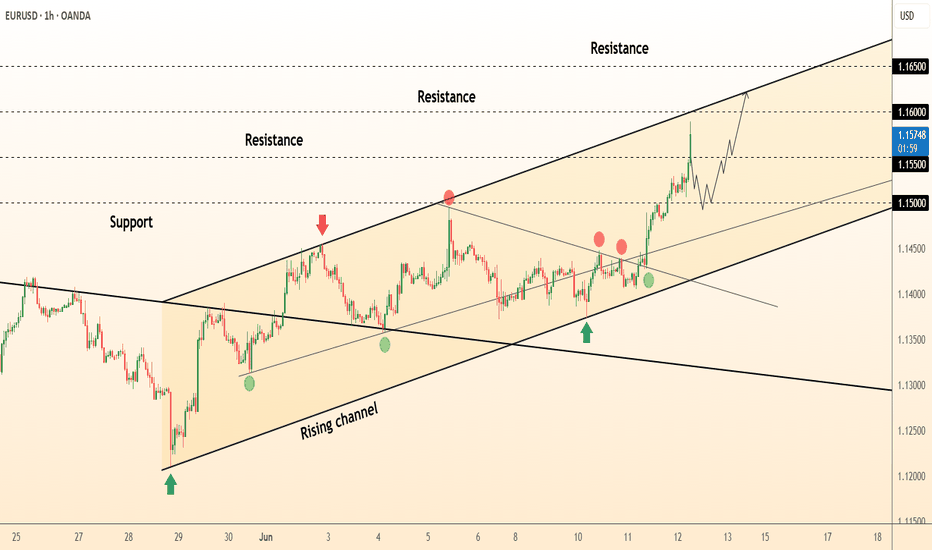
📊 Technical Analysis ● Euro keeps stair-stepping along the inner trend-line of the 2-month rising channel; each dip to the line (green arrows) is met with higher lows, confirming firm demand around 1.1485-1.1500. ● Friday’s break back above the former wedge cap turned 1.1550 into support; clearing the last swing high at 1.1605 would expose the channel median /...
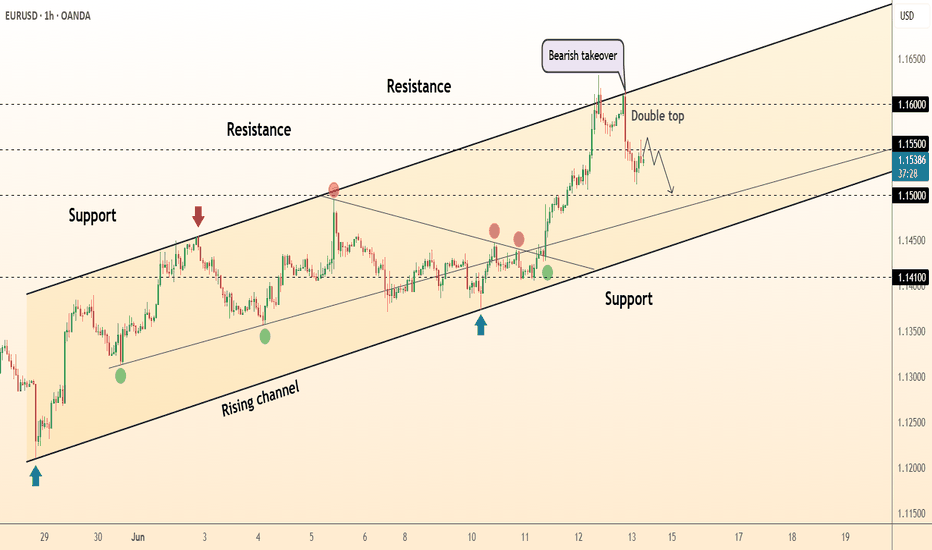
📊 Technical Analysis ● A double-top printed at the channel roof (≈ 1.1600) and a bearish engulfing candle signal exhaustion; price is slipping back inside last week’s inner trend-median, turning 1.1550 into fresh resistance. ● Hourly RSI diverged lower and the grey return line from 1 June has broken; pattern depth points to 1.1500 support, with the channel...
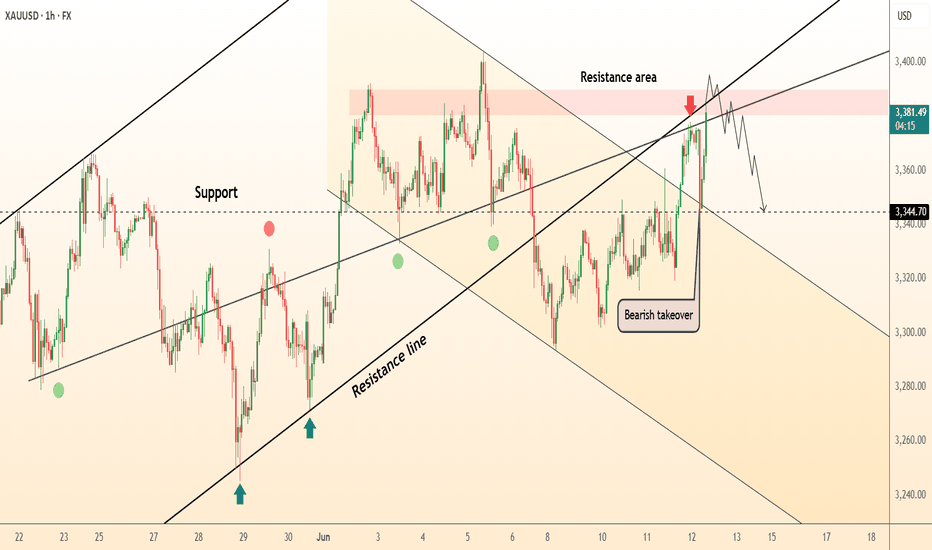
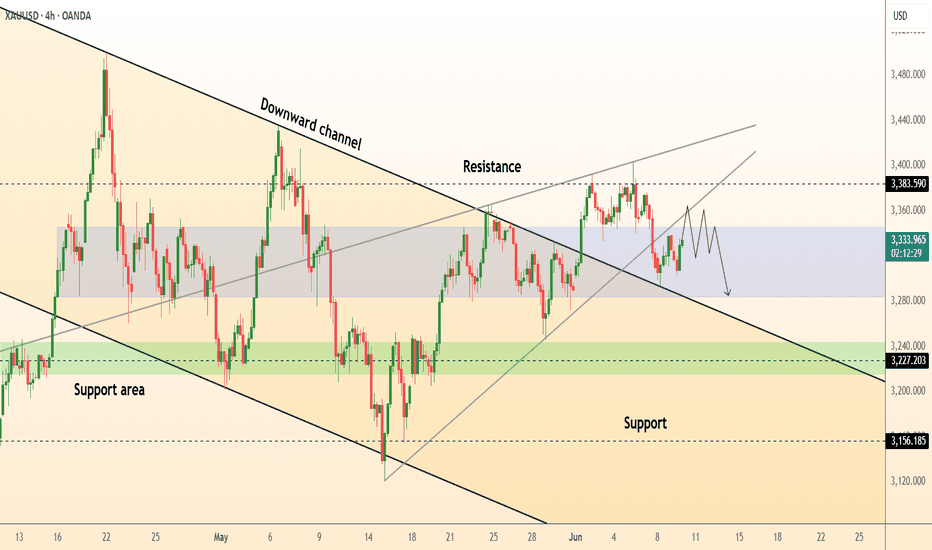
📊 Technical Analysis ● Third rejection of the H1 descending-channel roof (≈3 382) printed a bearish engulfing and confirmed the prior “false-break” spike; price is now back under the purple retest line that acted as supply all month. ● An intraday rising wedge has cracked; its measured leg aligns with the grey targets at 3 344 (minor support) and the 3 289...
📊 Technical Analysis ● Price has reclaimed the rising-channel median at ≈106.8 k and immediately made a higher-high on expanding volume; hourly RSI also pierced its two-week bear trend, flagging fresh upside energy. ● An ascending triangle is forming between 107 k support and a 109.5 k ceiling; its measured move coincides with the red supply/upper rail at...
📊 Technical Analysis ● Hourly close above 1.1500 completed a small ascending triangle; price is now hugging the rising-channel’s upper rail after a chain of higher-lows, pointing toward the 1.1600 objective. ● Triangle top and channel mid-line overlap at 1.1500-1.1520; while candles stay above, risk : reward favours a push to the next fib / upper parallel near...
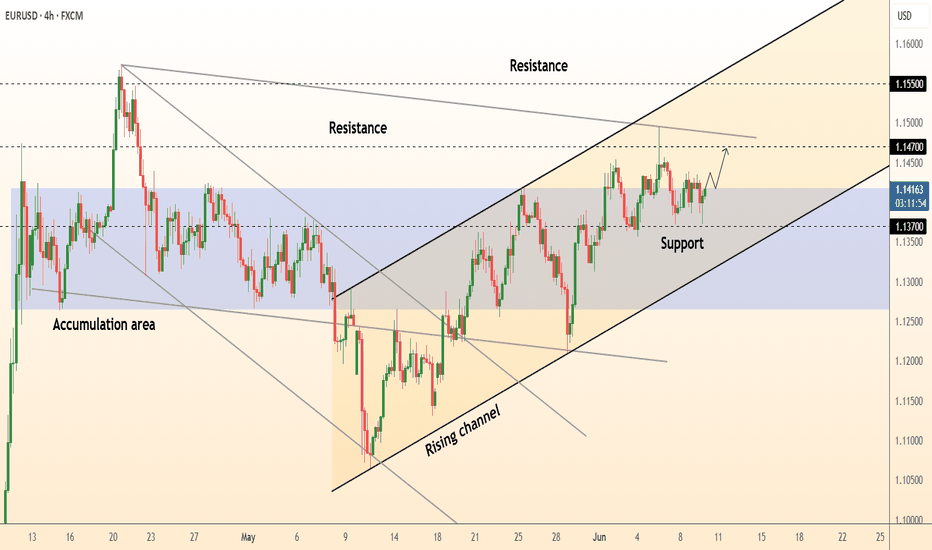
📊 Technical Analysis ● Euro holds above 1.137 – 1.140, where the channel’s mid-line meets the old wedge roof, printing a fresh higher-low (green arrow). ● Price is compressing inside a pennant capped at 1.142; flag height projects to 1.156 – 1.160 at the rising-channel median once 1.142 gives way. 💡 Fundamental Analysis ● After the ECB’s “one-and-pause” cut,...
📊 Technical Analysis ● Price still respects the former channel roof (now support) at 3 315-3 320; every dip to this line (green arrows) printed a higher low, preserving the rising-wedge structure. ● A break of the local wedge cap at 3 350 would reopen the April supply/median target at 3 435; failure to pierce keeps the pull-back window open toward the lower grey...
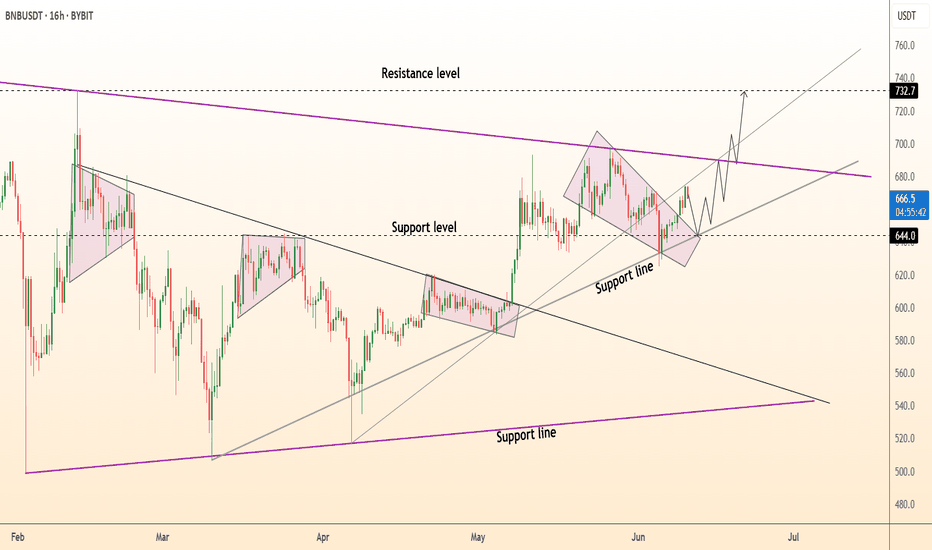
📊 Technical Analysis ● Price is respecting a fresh up-sloping channel; the last pull-back halted exactly at $644 support & the inner grey trend-line, printing a higher low and confirming the former wedge top as demand. ● Inside the channel price is carving a bullish pennant whose 1.618 swing meets the red $730-$735 resistance band and the long-term purple...
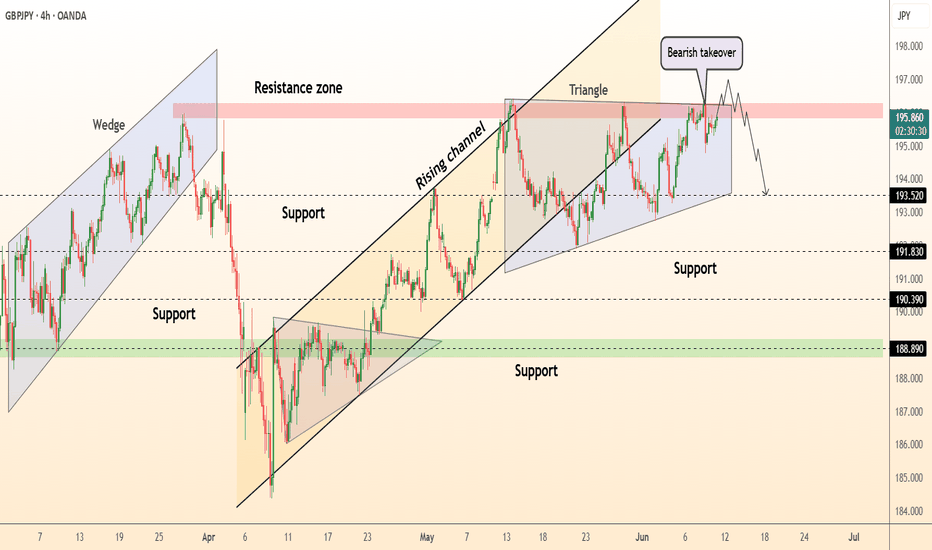
📊 Technical Analysis ● Price stalled in the 195.5-196.0 red resistance zone and printed a bearish engulfing (labelled “bearish take-over”) after repeatedly failing at the channel roof; the pattern completes a rising-wedge false break. ● Candle has slipped back under the mid-support band 194.0-194.3 and the wedge base; sustained trade below it opens a drop toward...
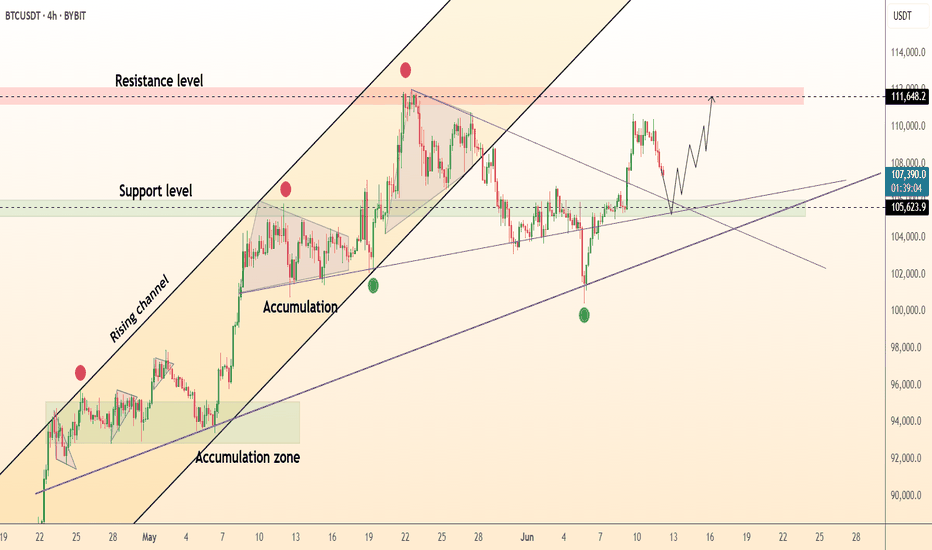
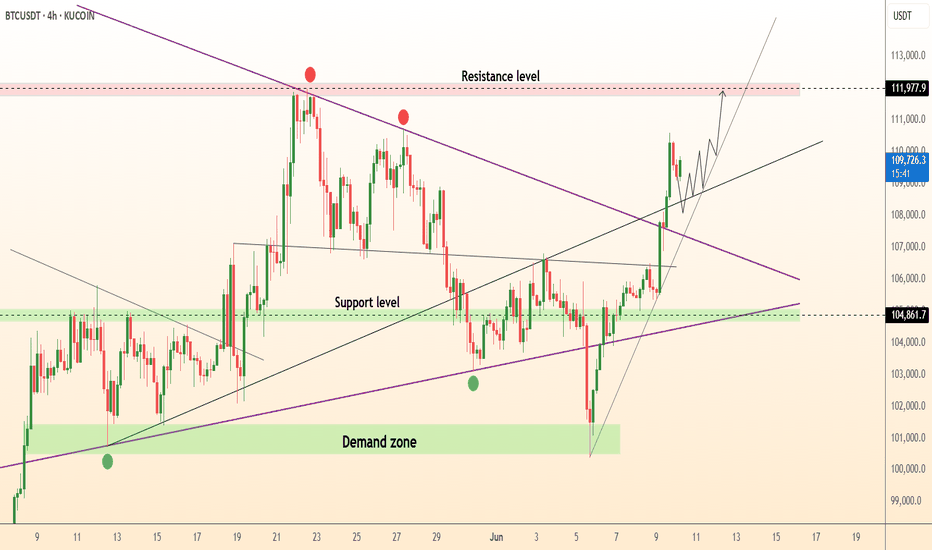
📊 Technical Analysis ● Bulls pierced the descending purple trend-line and closed two candles above the 106 k pivot, confirming a pennant breakout and resetting higher-lows along the black mid-channel. ● Re-test of 104.8 k demand (green band) held as support; the new up-sloping flag projects to the 111.8 k-112 k red supply at the channel roof, with dynamic backup...
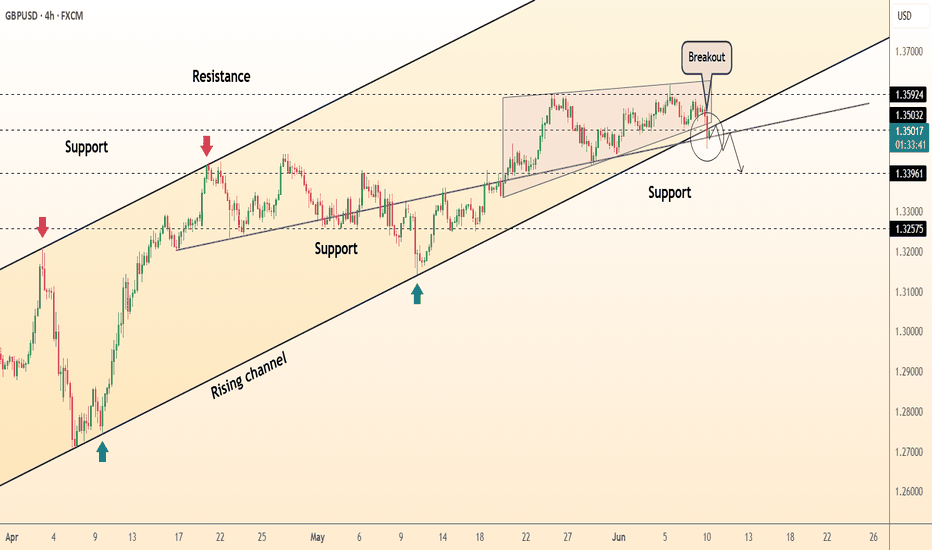
📊 Technical Analysis ● Pullback stalled exactly on the purple trend-support (≈1.348) and the channel mid-line after a false break of the upper wedge, preserving the sequence of higher-lows since May. ● Price is basing inside the 1.337-1.353 support strip; reclaim of 1.3530 would invalidate the bearish trap and open the next channel-median / April swing at...
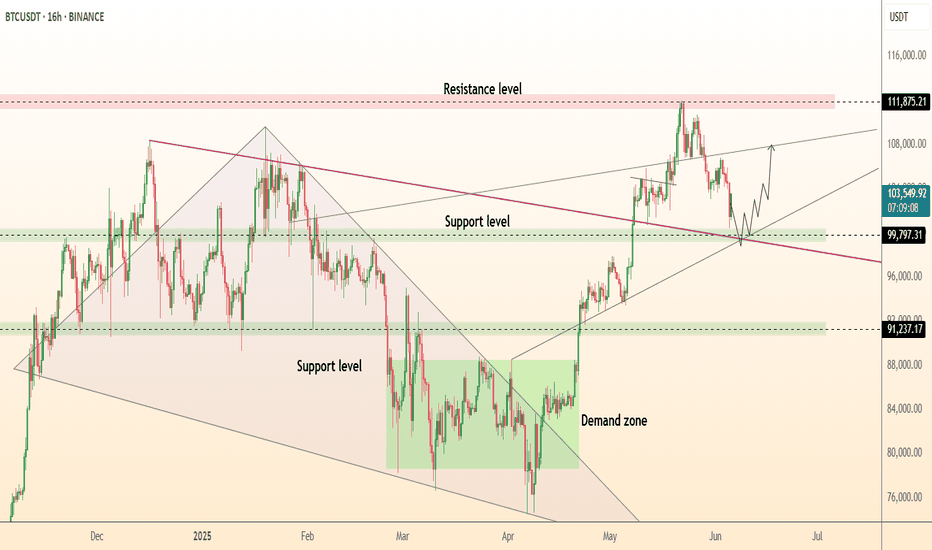
📊 Technical Analysis ● Bounce from 99.8-100 k confluence (violet trend-line + former wedge top + horizontal demand) confirms the zone as fresh support. ● Price coils in a tight pennant under 106 k; 1.618 target of the pattern meets the rising-channel roof and red supply at 111-112 k, while RSI prints higher lows, flagging hidden bullish momentum. 💡 Fundamental...
📊 Technical Analysis ● Four consecutive higher-lows off 140.9 have carved a rising flag that presses the channel roof (144.8); flag depth projects to the April swing-top/ Fib cluster at 147.8 once 145 is cleared. ● Daily RSI holds above 50 and price is now trading back above the broken wedge-cap (142.9), confirming it as demand and tilting risk toward the 150.9...
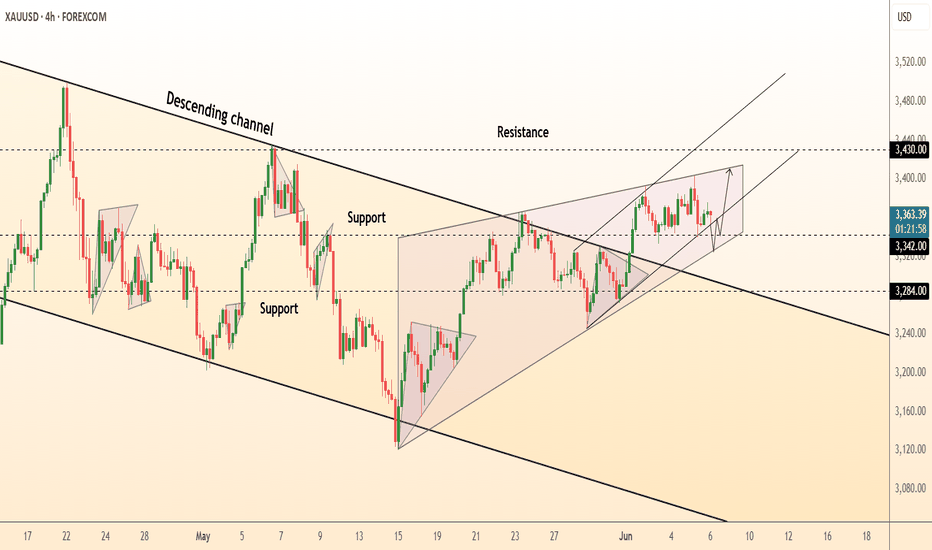
📊 Technical Analysis ● Price is coiling inside an ascending flag that is riding the new support line at 3 342; flag range compression after each pull-back signals energy for a thrust. ● The pattern sits above the old channel roof, turning the former resistance into a launch pad; measured move of the flag points to the next confluence at 3 435. 💡 Fundamental...
