Fx_Faiza
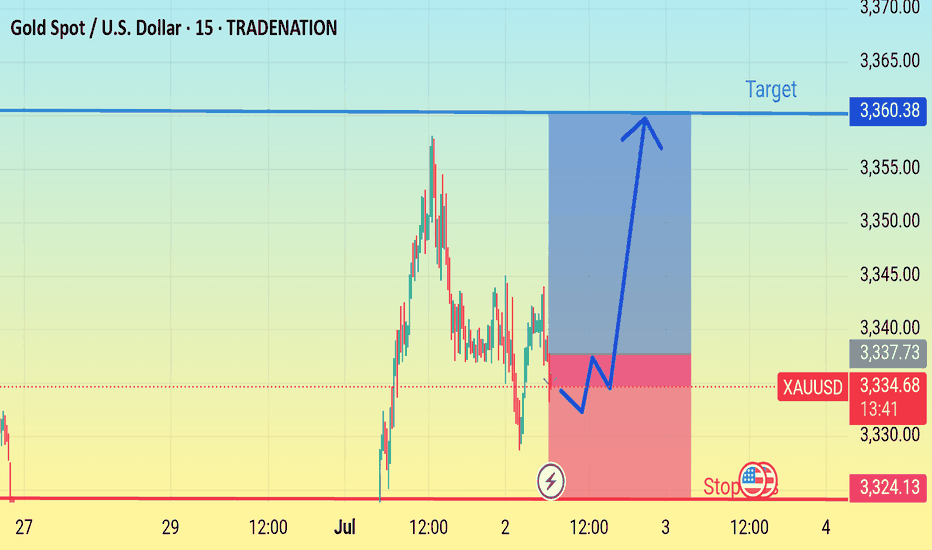
PremiumGold buy now entry point 3335 Target 3360 Stop loss 3324
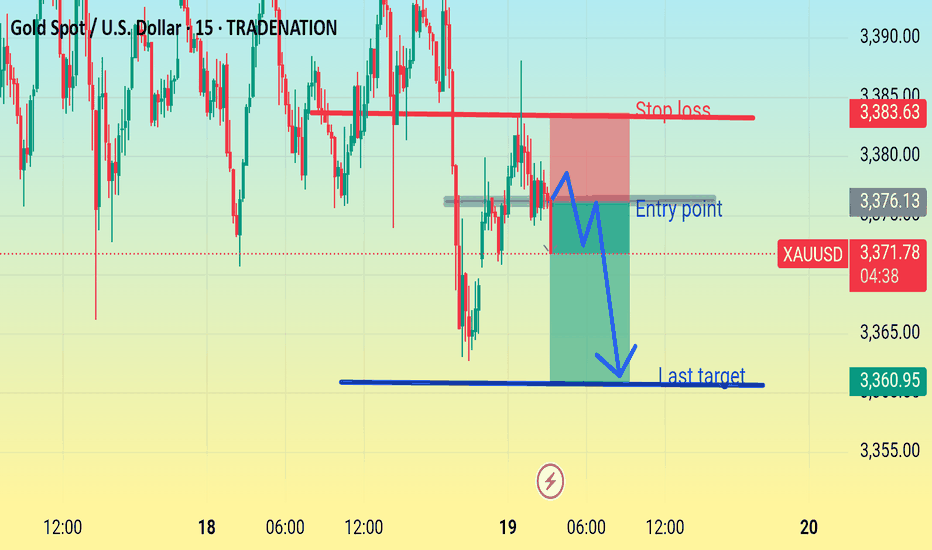
Sell (Short) Trade Setup: Instrument: Gold Spot / U.S. Dollar (XAU/USD) Timeframe: 15 Minutes Entry Point: 3,331.19 Stop Loss (SL): 3,340.20 Target (Take Profit): 3,310.77 / 3,310.92 --- 🔍 Trade Logic: Chart par bearish candle formation dikha raha hai. Entry ke baad price ka short-term bounce expected hai (as shown by blue zigzag arrow).
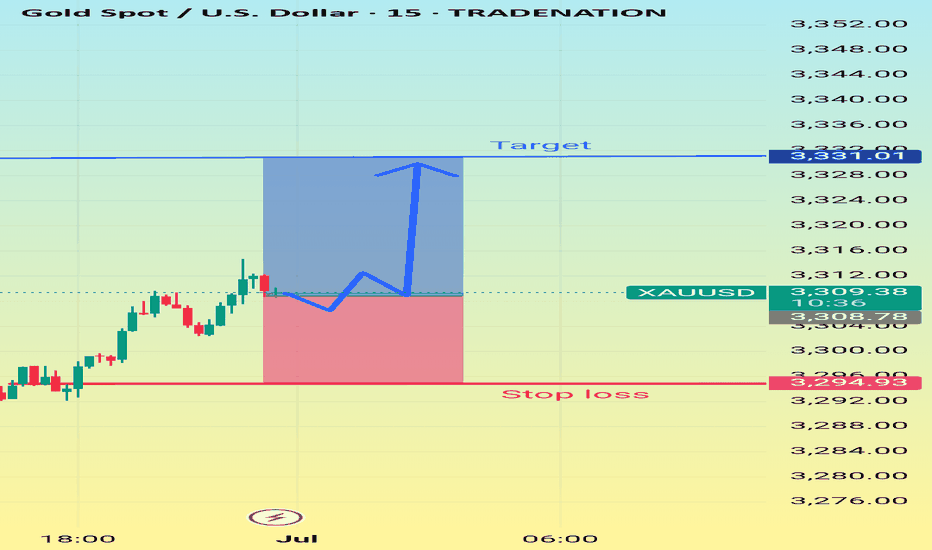
Instrument: Gold (XAU/USD) Timeframe: 15 minutes Entry Price Area: Around $3,312.94 Target (Take Profit): $3,330.27 Stop Loss: $3,298.74 Risk-Reward Ratio: Looks favorable (approx. 1:1.5 or better) 📈 Trade Idea: The chart suggests a long (buy) position with: A potential reversal (indicated by the blue zigzag arrow) after a minor pullback.
Guys, I have given a sale target, don't miss it and keep the up trade on hold until the last
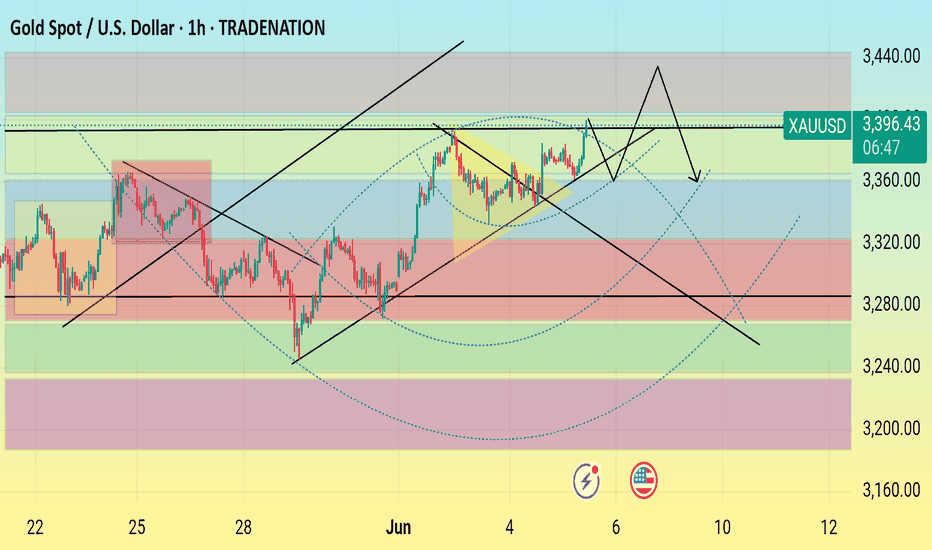
🟢 Big Picture – What’s Happening on the Chart? This is a 1-hour chart of XAU/USD (Gold), showing the recent trend, key levels, and a forecasted movement. At a glance, you can see that Gold has been in a bullish recovery since the drop on May 29. The market is currently testing a key resistance zone (around $3,400), which aligns with the upper boundary of the...
15-Minute Chart (Intraday View) Trend Structure: Price has been trading within a small ascending channel after a prior consolidation. Breakout Anticipation: The recent rejection at the top of the channel followed by a pullback to near the lower trendline suggests a potential bullish continuation. The dashed blue arrow implies a forecast for a bounce off the...
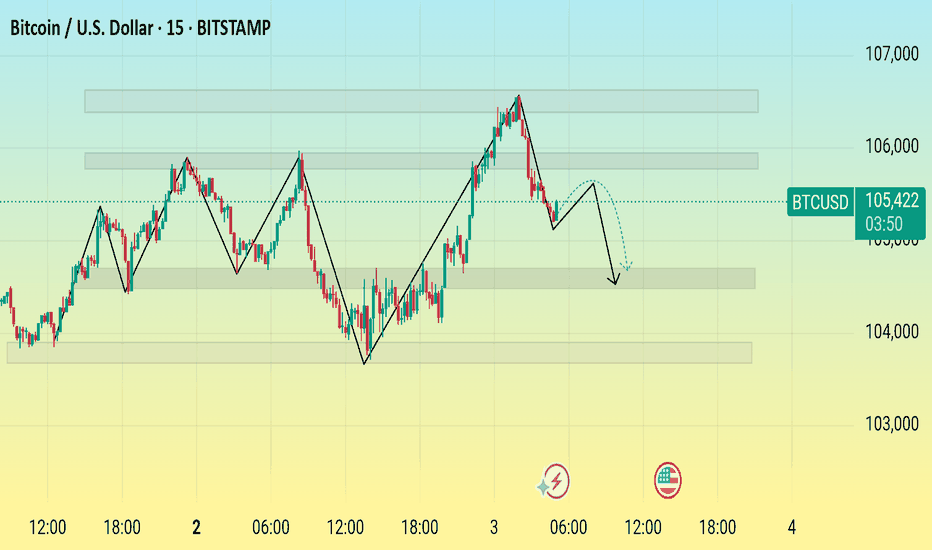
Recent market structure and a potential bearish move. After a peak near 107,000, Bitcoin has started a downward trend. The projection suggests a minor pullback before continuing lower toward the 104,000–103,500 support zones. Traders may watch for confirmations before entering positions.
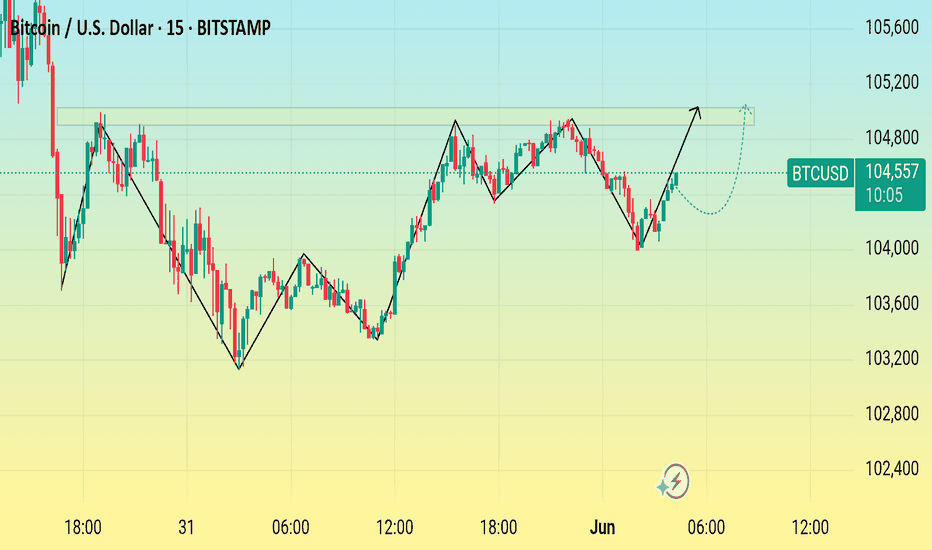
Bitcoin currently trading at $104,496. The chart includes a bullish projection, suggesting a possible short-term upward move toward the $105,000 resistance level. If this level is reached and broken, a continuation of the uptrend could follow. The black and blue arrows indicate potential bullish momentum and consolidation phases.
Chart Overview: Instrument: (XAU/USD) Timeframe: 15-minute Current Price: $3,341.07 Price Action: Market recently exited a rising channel and is currently consolidating near the upper zone of a prior accumulation range. --- Key Technical Observations: 1. Rising Channel (Bullish Trend Continuation): A rising channel broke down recently, suggesting...
Market Context & Structure: Sideways Range Movement: The chart shows two primary consolidation (range-bound) zones marked with green shaded rectangles. BTC has been trading within these horizontal zones for a considerable period, suggesting indecision or accumulation/distribution phases. Current Breakdown: Recently, BTC broke down from the upper consolidation...
Gold Price Analysis (15-Minute Chart) Current Price: $3,356.31 Date: May 24, 2025 --- What Happened: 1. Gold was going down before May 23. 2. Then it broke out of the downtrend and started going up (this is called a trend breakout). 3. After the breakout, gold moved up strongly and reached around $3,360. --- What Might Happen Next (Prediction): The...
reflects key technical developments and potential breakout scenarios: Description and Analysis: 1. Previous Uptrend (Left Section): The chart begins with a strong bullish trend forming a rising channel. Candles within the channel show consistent higher highs and higher lows, reflecting strong buying momentum up to the peak near $112,000. 2. Range-Bound...
Trend Analysis Uptrend Channel (Green lines): Price was previously moving upward within a rising channel. Breakdown: Price broke below the channel, indicating a trend reversal or weakening bullish momentum. --- Current Situation Price: Currently around $3,294.98, down by 0.61%. Trendline Resistance: A downward sloping trendline (green line) is acting as...
Gold’s price often goes up when it hits the green area and falls when it hits the red area. Right now, it’s in the green area again, so it might go up soon. The blue line and arrow show a possible path the price could take – first a small rise, then a small drop, and then a bigger rise. If the price breaks above the red resistance zone, it may continue rising.
1. Trend Analysis: Current Trend: Uptrend. The price is moving within an ascending channel (marked in light blue). Higher highs and higher lows are visible, indicating bullish momentum. --- 2. Key Support and Resistance Zones: Support Zones (Yellow boxes): Several horizontal yellow rectangles show strong historical demand zones. Price bounced multiple...
technical analysis setup that highlights price action, support/resistance zones, and a probable price projection. Key Observations: 1. Resistance and Support Zones: Yellow boxes represent supply and demand zones: Upper box (3325–3320) is a resistance zone where price repeatedly reversed. Lower box (3290–3285) is a support zone where price found buying...
Gold next move to 3315 if tred line break next target 3350
