GoldenZoneFX
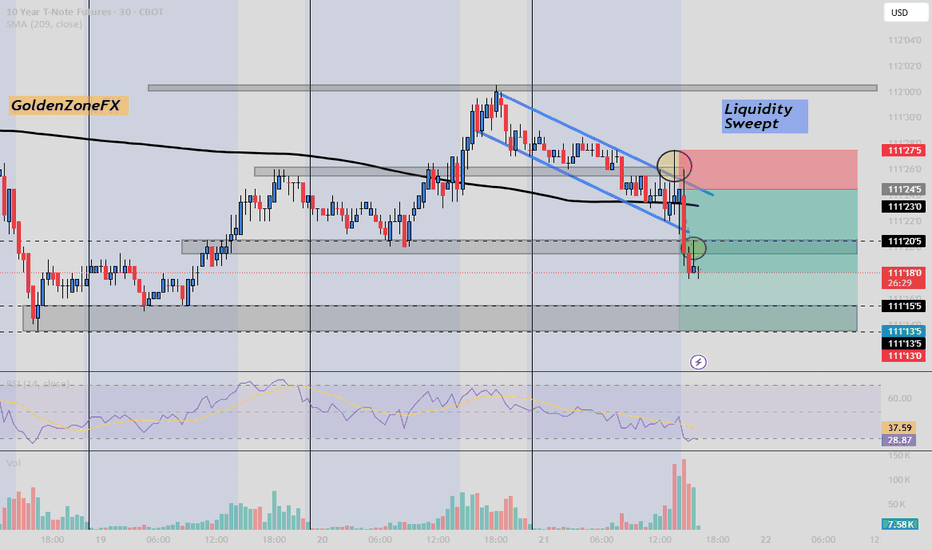
After the breakout and the liquidity that has been sweept the price performed a small pullback which confirms the short position setup. Follow @GoldenZoneFX for more content and valuable insights.
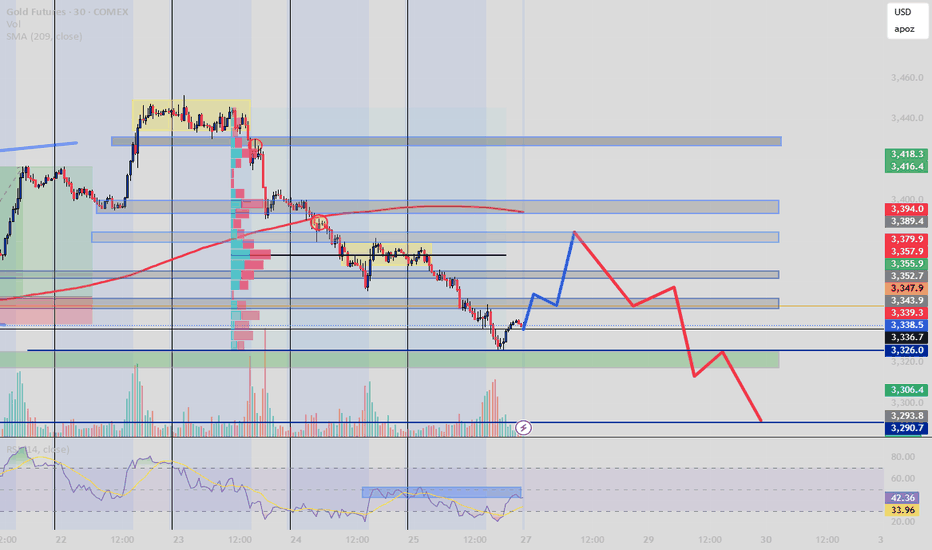
After a clear break of structure and consistent rejection below the 209 EMA, price is retracing toward a key zone of confluence between 3347–3379. This area aligns with: Former demand turned supply (OB) Volume cluster (high activity zone) RSI hidden bearish divergence Fair Value Gap (inefficiency fill target) My expectation: a short-term bullish correction...
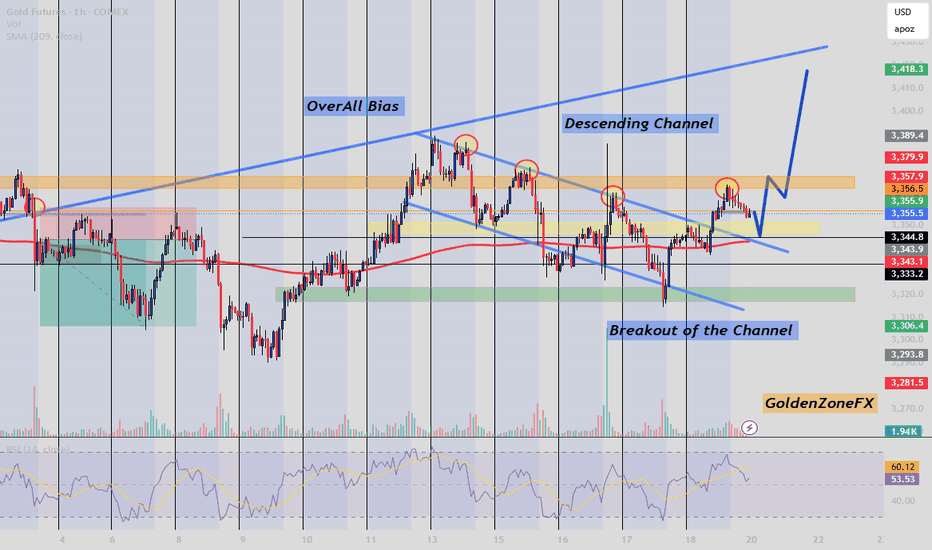
Gold Futures Analysis – Breakout Confirmation & Bullish Continuation Potential After an extended consolidation within a descending channel, Gold has successfully broken out, aligning with the overall bullish bias evident from the broader market structure. Key Observations: Overall Bias: Bullish, supported by higher-timeframe structure and trendline...
Today’s price action on Gold presented a textbook structure shift: Break of Structure occurred after price respected the Demand Zone around the 3,315–3,320 region, showing strong buying interest and a volume spike confirming bullish intent. Price surged past the key resistance near 3,340, breaking above the 200 SMA and reclaiming a prior consolidation zone....
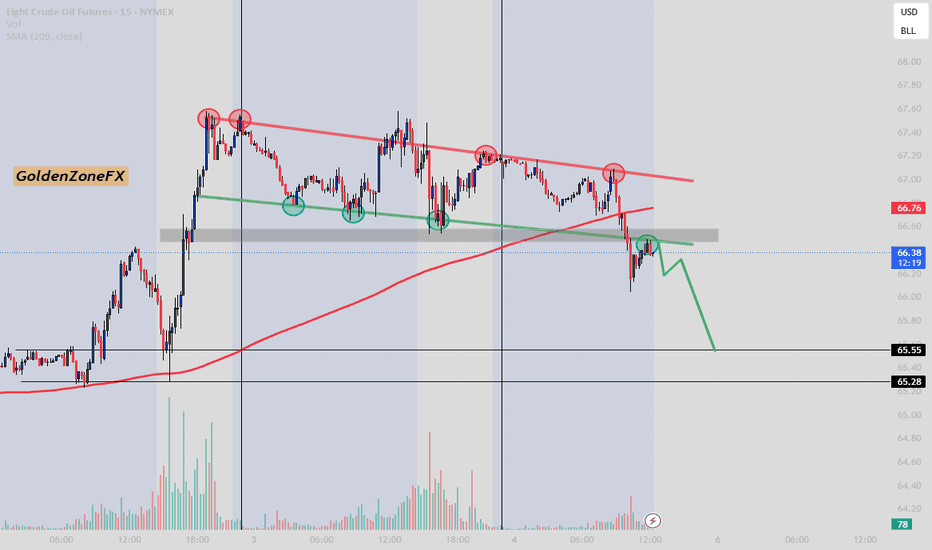
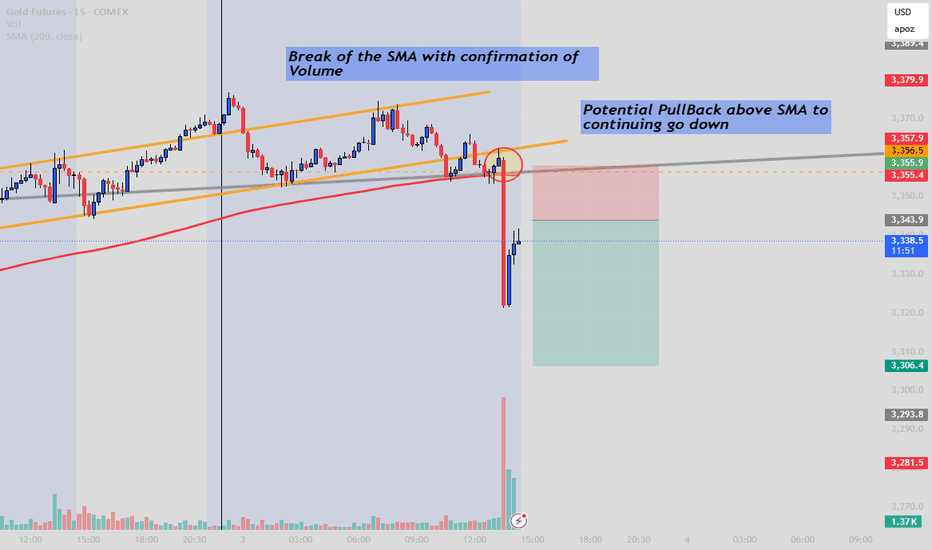
Watching the volume rising is a good confirmation for the Bearish Bias. Follow @GoldenZoneFX For more Content and valuable insights.
There is a breakout of the EMA with confirmation of rising Volume, which indicate a strong short position also with NFP shows strong job claims that's why we anticipated a fall in gold, especially for those who want to enter lastly you should consider waiting for a pullback to catch the second move. Follow GoldenZoneFX For more content and valuable insights.
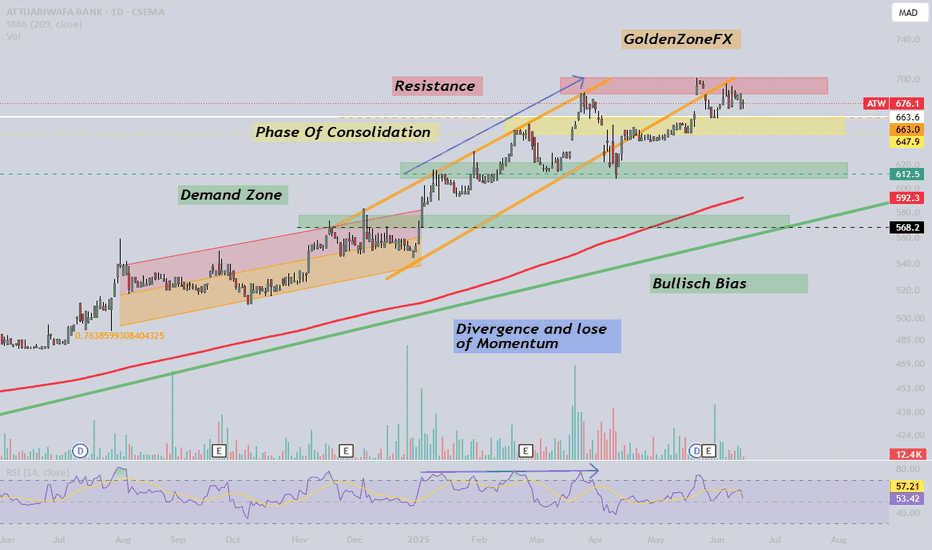
The ATW stock is still following a strong upward trend, but key technical signals are emerging, especially with a RSI divergence. Here's what to watch for: Trend & Key Zones Bullish Channel: The stock is within a solid upward channel, indicating continuous growth. Demand Zone: Around 612.5 MAD, the stock has found strong support in the past. Consolidation...
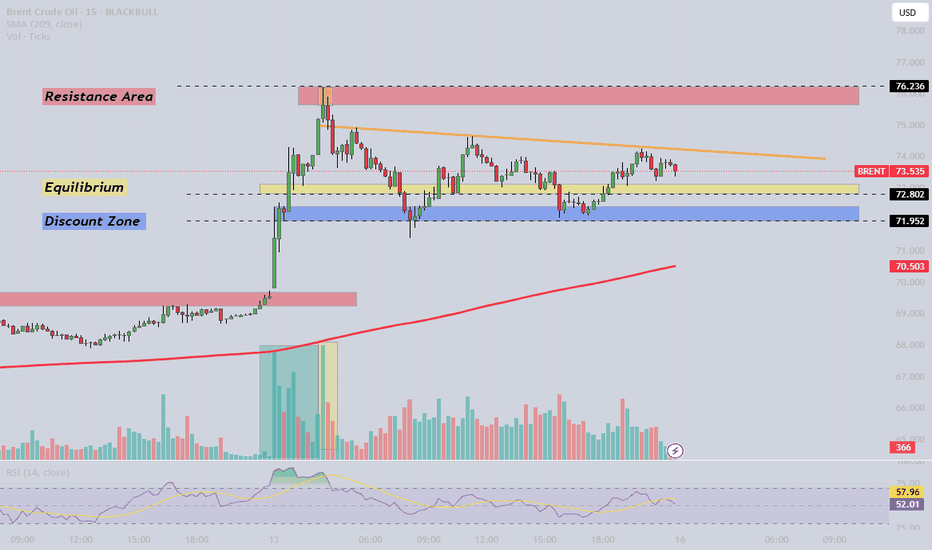
Brent Crude Oil has surged 9% in just one day due to escalating tensions between Iran and Israel, underscoring the volatility in global energy markets. Here’s a breakdown of the key levels and the economic impact: Resistance at 76.236: This remains a strong resistance zone. A breakout could indicate more upside, with oil prices potentially reaching higher...
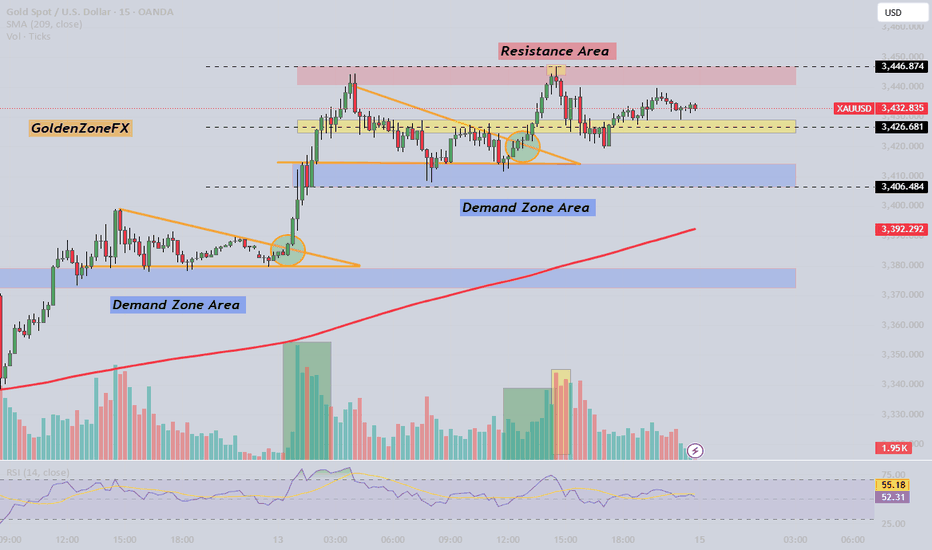
In the wake of growing tensions between Iran and Israel, XAUUSD (Gold) has once again become the focal point for many traders seeking stability. Let’s break down the key technical levels and how global events could shape market behavior in the days ahead. Resistance at 3,446.87 – A Barrier to Watch Gold’s price is currently testing the resistance zone at...
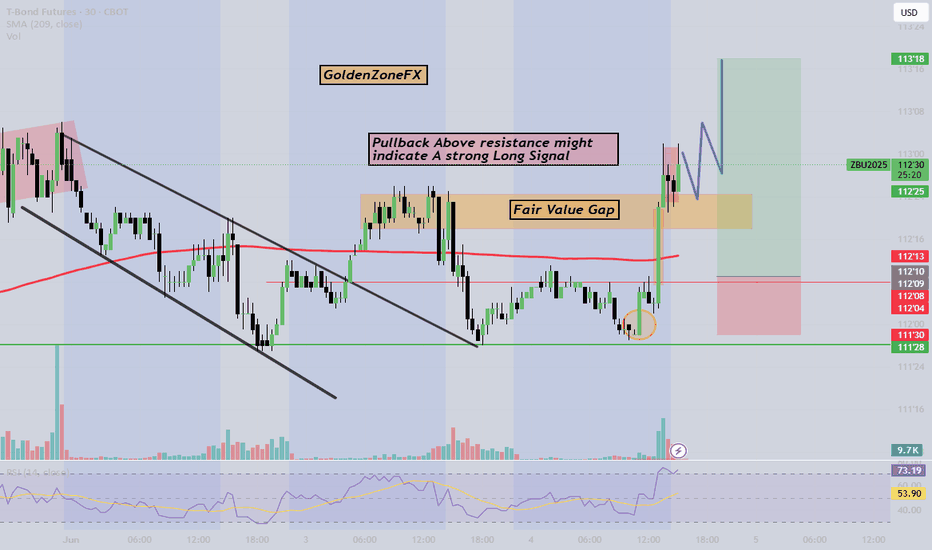
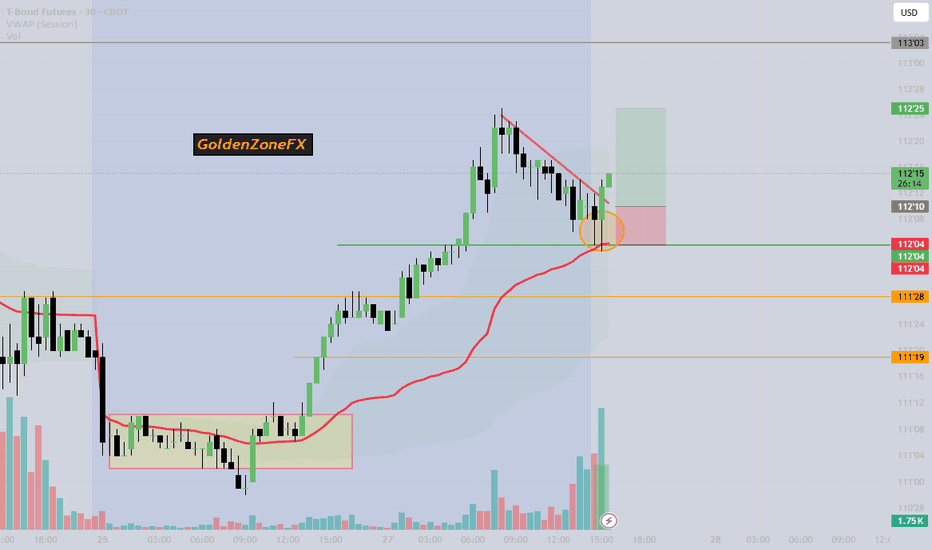
The 30-Year Bond Futures just broke key structure, and smart money seems to be eyeing a precise pullback above the Fair Value Gap Here’s what I’m watching: Clear market structure break - Liquidity sweep before breakout - Pullback aligning with ICT-style premium arrays - Bullish continuation potential into the next imbalance zone This setup reflects...
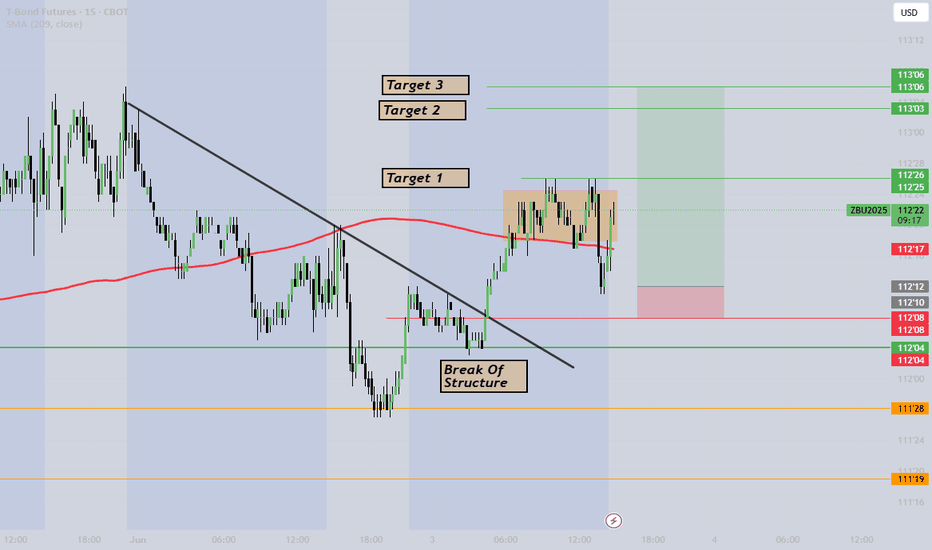
There is a break of a bearish trendline, combined with volume confirmation and wick candles that give us strong bullish reversal pattern also combined with ICT and Price action confirmation that tell us where Smart money going. Follow @GoldenZoneFX For more content and valuable Insights.
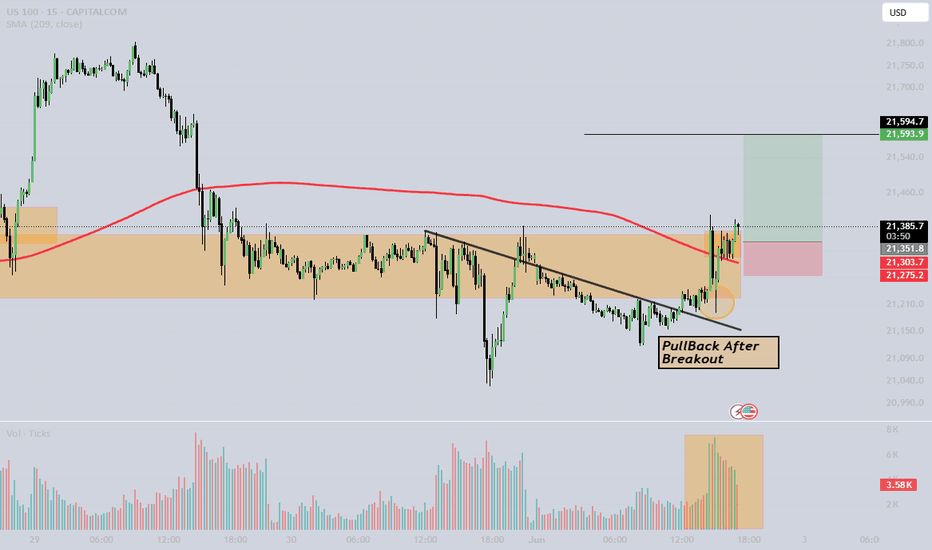
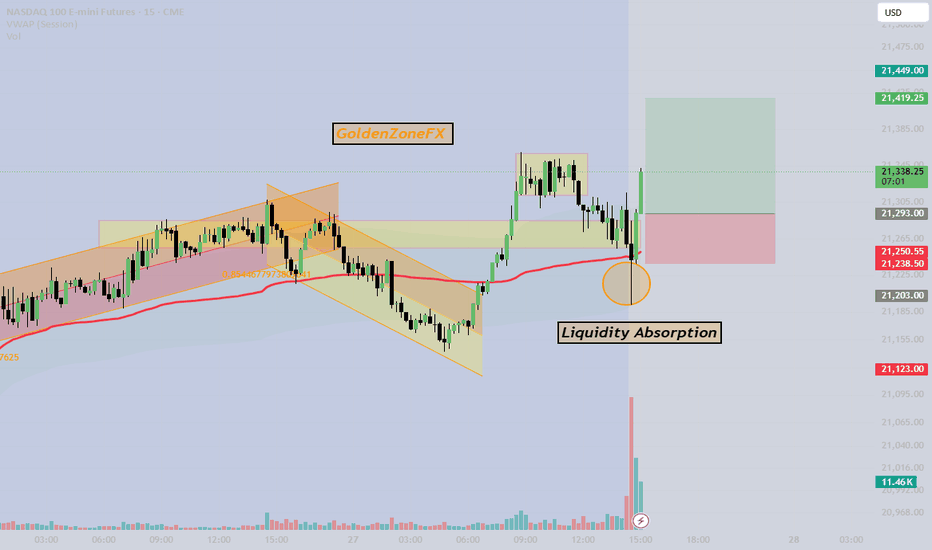
US100 Breaks Bearish Trendline & Pulls Back Above SMA — Strong Long Signal! The US100 has just broken out of its bearish trendline, signaling a potential shift in market momentum from bearish to bullish. What’s more bullish is the recent pullback above the Simple Moving Average (SMA), which now acts as a dynamic support level — a classic confirmation that...
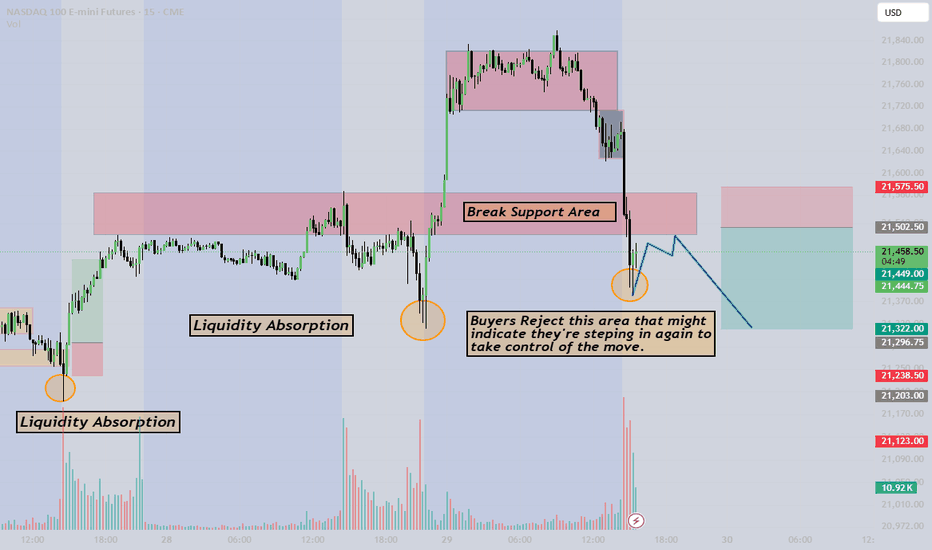
NASDAQ 100 E-mini Futures Sell Signal Confirmation The latest price action in the NASDAQ 100 E-mini Futures chart presents a compelling case for a strong sell position. Key indicators point to a significant bearish shift: Break of Structure (BOS): The price has broken below a critical support level, marking the transition from bullish momentum to bearish...
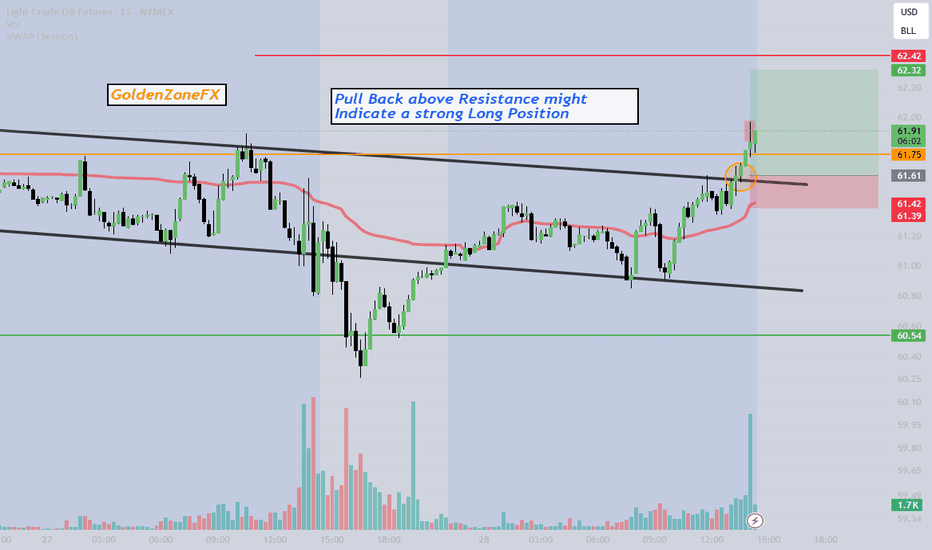
The price has broken above the $61.75 resistance and successfully pulled back to retest it as support, confirming a strong buy opportunity. Key Confirmations: Breakout above resistance: Signals bullish strength. Pullback retest: Former resistance now acting as support. Volume surge: High buying interest reinforces the move. VWAP positioning: ...
The price has successfully broken above previous resistance, confirming bullish strength. The breakout is supported by high volume, signaling institutional participation and strong momentum. Key Technical Signals Resistance Break: Price surpasses a critical level, flipping it into new support. Volume Surge: Increased buying activity confirms commitment from...
In this bullish continuation setup, big players (institutional traders, hedge funds, and market makers) are actively maneuvering around key levels. After price bounces from the Order Block area, these entities aim to manipulate liquidity by triggering stop-loss placements before continuing the trend. How They Operate: Stop-Hunting: Institutions know where...
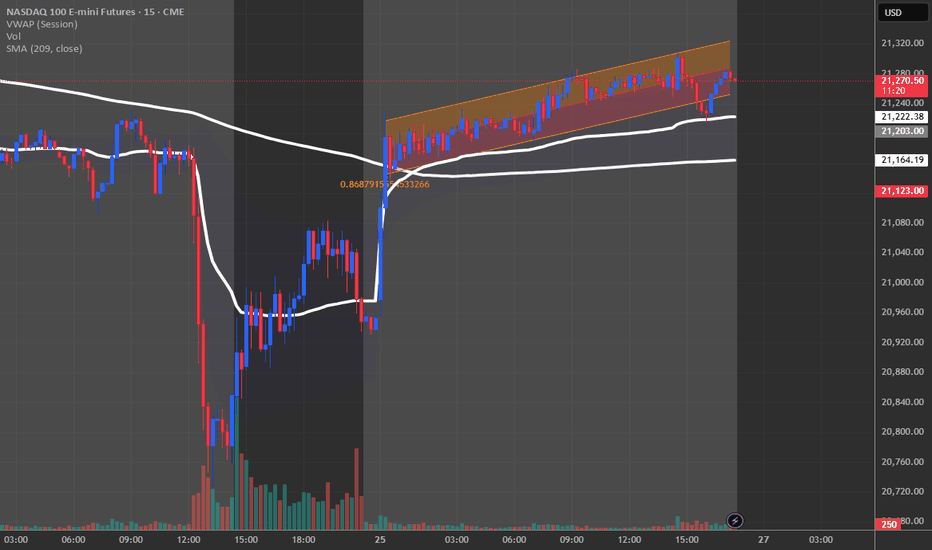
When NQ1 exhibits an aggressive move relative to the VWAP, it typically indicates that large players—such as institutionals and hedge funds—are taking notice. An aggressive break above the VWAP can signal strong bullish momentum, while an aggressive breakdown below it suggests equally forceful bearish pressure. In both instances, the intensity of the move often...
Gold is currently at a key juncture where decisive action may soon unfold. The VWAP stands out as a critical level, acting as both a support and resistance boundary, and its role is pivotal in signaling the intentions of larger market players. The Setup At this point, we're watching for an aggressive move away from the VWAP. An uncompromising breakout upwards...
