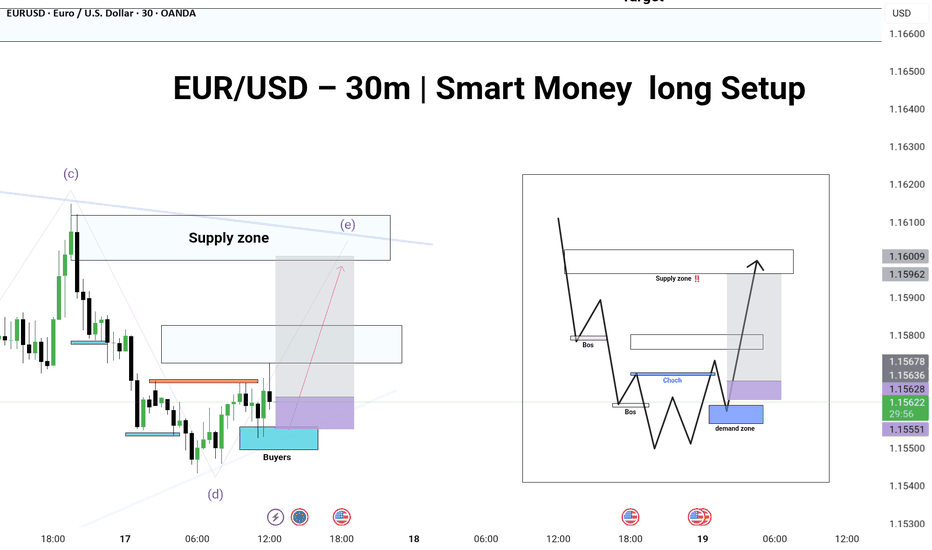
Pair: EUR/USD 🔹 Timeframe: 30-Minutes 🔹 Confluence Strategy: Elliott Wave + Smart Money Concepts (SMC) 🔹 Pattern: Ending Triangle (Wave e) + CHoCH + BOS 🔹 Published on: June 17, 2025 --- 🧠 Analysis Summary: 1. Wave (e) of triangle nearly complete — signs of liquidity grab at the low. 2. CHoCH formed after internal structure break – a bullish signal. 3....
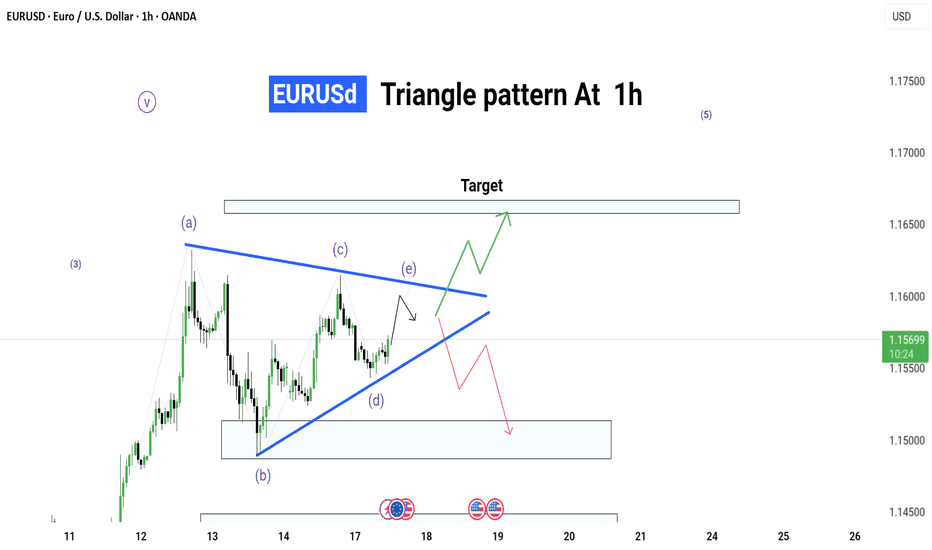
📊 EUR/USD Triangle Pattern – 1H Timeframe 🕐 Date: 17 June 2025 📌 Chart by: GreenfireForex 🔷 Pattern: Contracting Triangle (ABCDE) 🔍 Context: Forming inside Wave (4) – possible breakout before Wave (5) 📈 Upside Potential: Break above triangle → target near 1.16500+ 📉 Downside Risk: If fails to break up → revisit demand zone around 1.15000 --- 🔮 Possible...
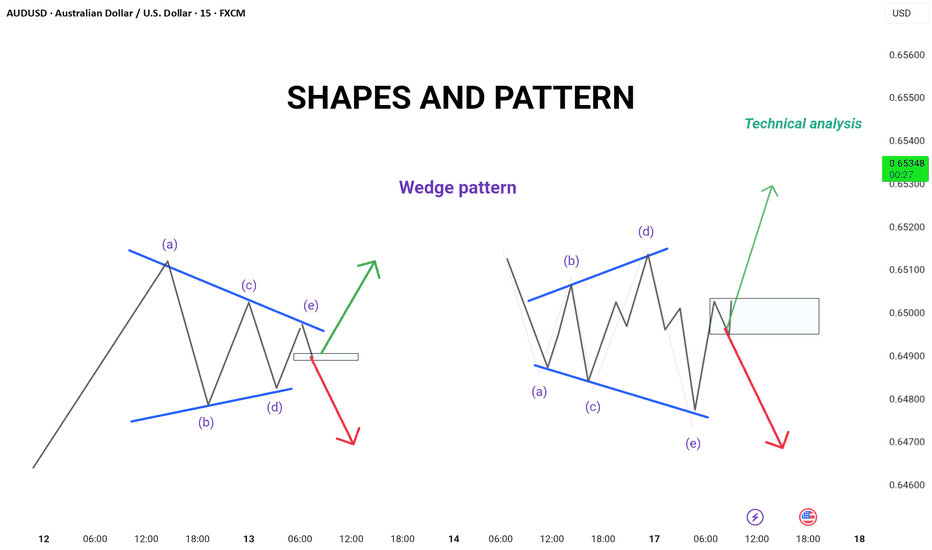
📚 Wedge Pattern – Simple Explanation A wedge pattern is a shape on the chart that looks like a triangle or cone. It tells us that the price is getting ready to break out — either up or down. --- 🔻 Falling Wedge (Bullish) Looks like price is going down, but slowly. Lines move closer together. Usually means the price will go up soon. It's a bullish signal...
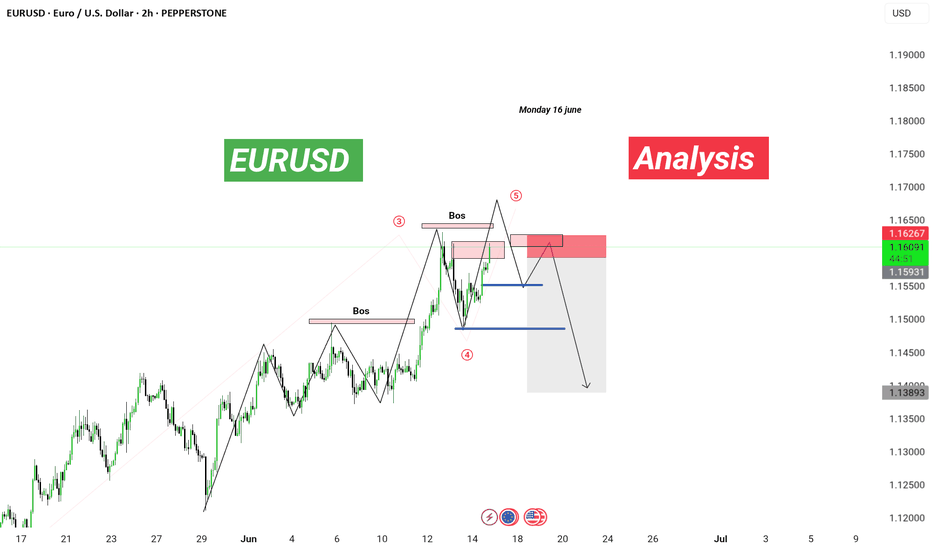
📉 EUR/USD Analysis | 2H Timeframe Wave 5 in play! 🚨 Structure shift confirmed with BOS at key supply zone. Expecting liquidity sweep and a bearish reversal 📉 🧠 Smart Money + Elliott Wave Combo: 🔹 BOS at Wave 3 ✅ 🔹 Wave 4 retracement held 🔹 Anticipating Wave 5 top-out and reversal 🔹 Targeting major demand zones (blue lines) 🔻 Potential Sell Setup Loading… 📆...
📉 Pair: GBP/USD ⏱ Timeframe: 4H 🔶 Orange Line = Major S/R Zone 📌 Confirmed Break + Retest 🎯 Profit Locked | Risk Managed Strategy: Elliott Wave + Parallel Channel + SMC (Break of Structure) 🔶 Status: Completed Wave 5 inside falling wedge Sell executed after orange support break Anticipating accumulation phase > BOS > bullish reversal 📍Key Zones: Demand zone...
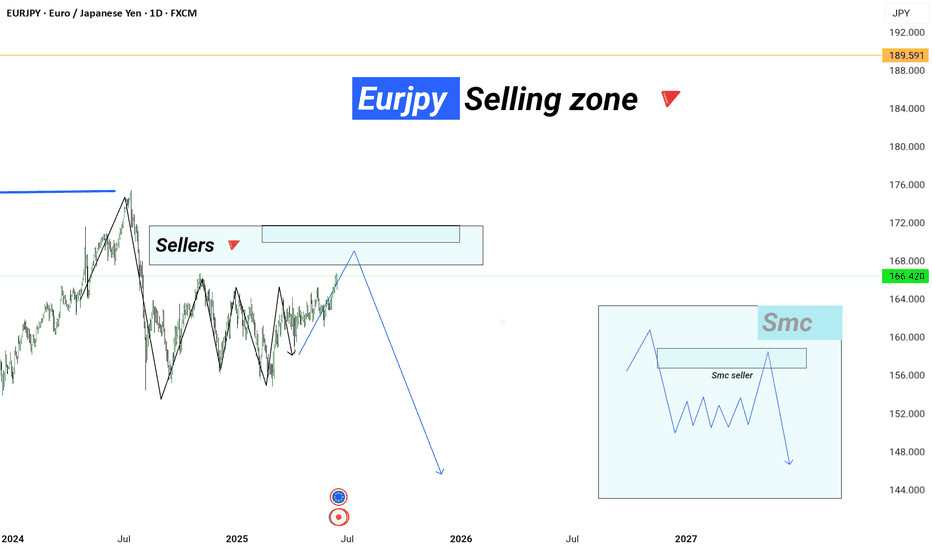
the zone followed by a sharp rejection. --- 🧠 Smart Money Insight: Possible SMC-style reaction anticipated: Liquidity inducement above highs Sharp rejection from seller zone BOS (Break of Structure) for confirmation Right-side inset illustration highlights expected distribution before drop. --- 🔎 --- 🧩 Trading Plan: Wait for price action...
Price is approaching a major higher-timeframe supply zone near 168.000 – 172.000, an area historically respected by institutional sellers. This zone aligns with a previous price rejection and a trendline resistance visible on a multi-year chart. Expecting a possible liquidity grab into the zone followed by a sharp rejection. --- 🧠 Smart Money...
Technical Breakdown: Symmetrical triangle pattern clearly formed with clean ABCDE wave structure. The price has broken out from the upper resistance (trendline), confirming a bullish breakout scenario. Next key area to watch is the supply zone near 145.800 – 146.200, where price may either: Face resistance and retrace, Or break through for...
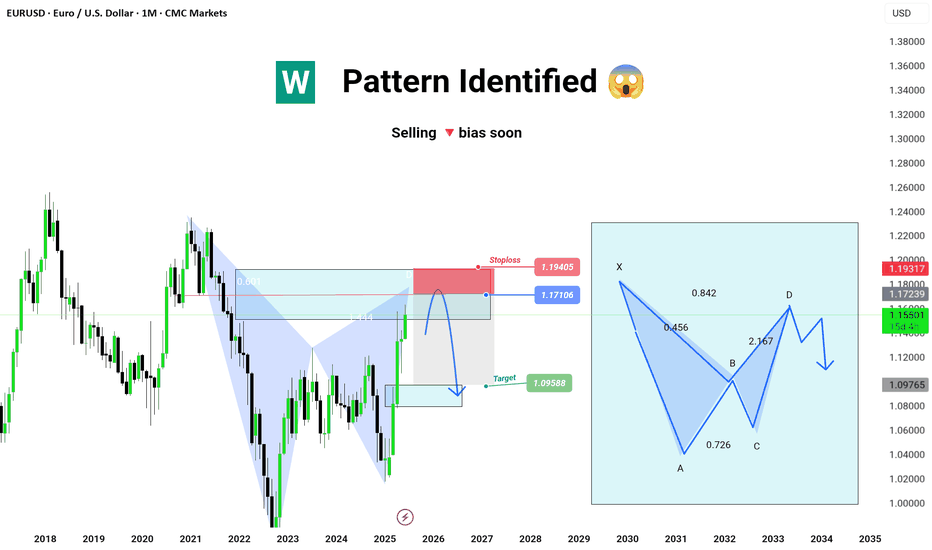
✅ Harmonic Formation (Bearish Potential) ⚠️ Selling Bias forming soon --- 🧩 Pattern Breakdown: A Bearish Harmonic Pattern (likely Butterfly or Deep Crab) has been identified and is now nearing completion at the D point. Current price is approaching key resistance / reversal zone, precisely around the 0.786 - 0.886 fib area (highlighted red). The...
Strategy Used: ✔ Smart Money Concept (SMC) ✔ Elliott Wave Theory ✔ Wedge Pattern Breakout --- 🔍 Chart Overview: The pair has completed a classic falling wedge pattern, hinting at a potential long-term bullish reversal. Wave 5 completion suggests the start of a new cycle or correction (ABC). Currently in a buyer-dominated zone, with momentum pushing towards...
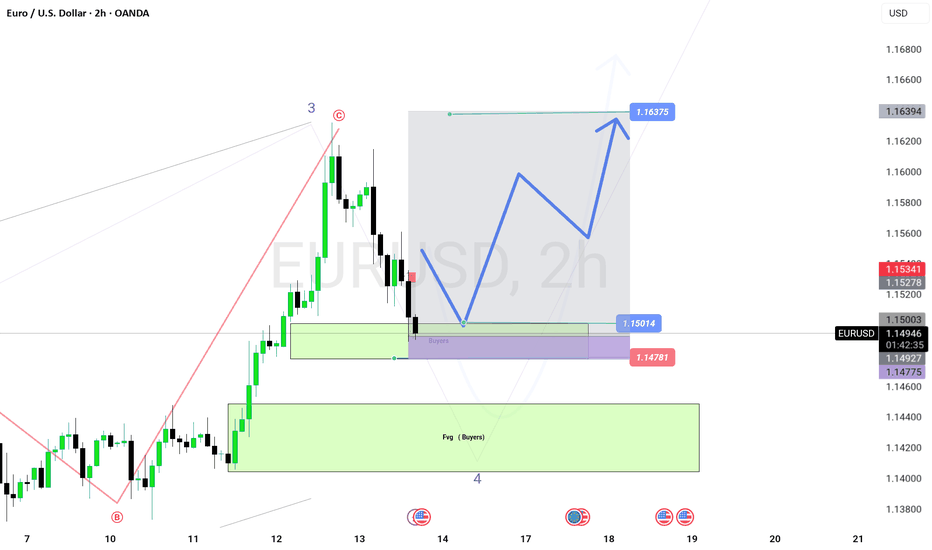
📈 EUR/USD – Wave 4 Buy Opportunity (2H TF) Published by Greenfireforex | June 13, 2025 The EUR/USD pair is completing a corrective Wave 4, retracing into a premium FVG (Fair Value Gap) demand zone between 1.1500–1.1475. Price tapped into a high-probability reversal block just below the psychological level of 1.1500, offering a potential long entry. 🔹...
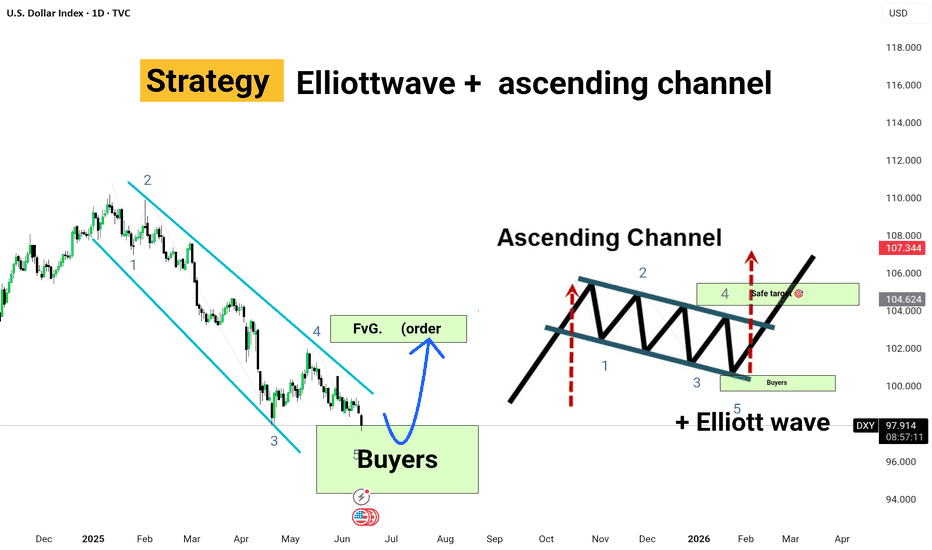
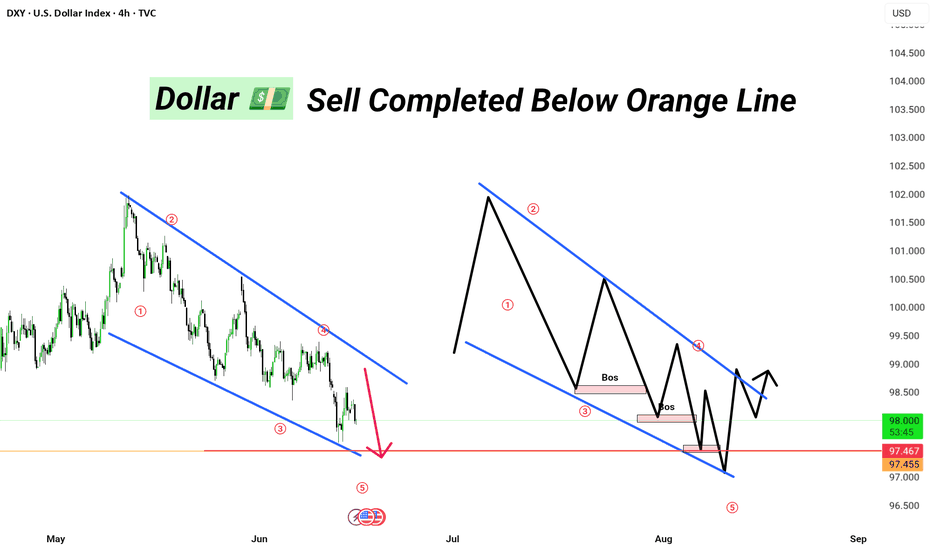
Asset: U.S. Dollar Index (DXY) Timeframe: 1D (Daily Chart) Methodology: Elliott Wave + FVG (Fair Value Gap) + Price Action DXY has completed an impulsive 5-wave bearish structure, now entering a high-probability reversal zone marked by strong buyer interest around the Wave 5 bottom. 📌 Key Insights: Wave 5 approaching demand zone (Buyers' area) Price inside...
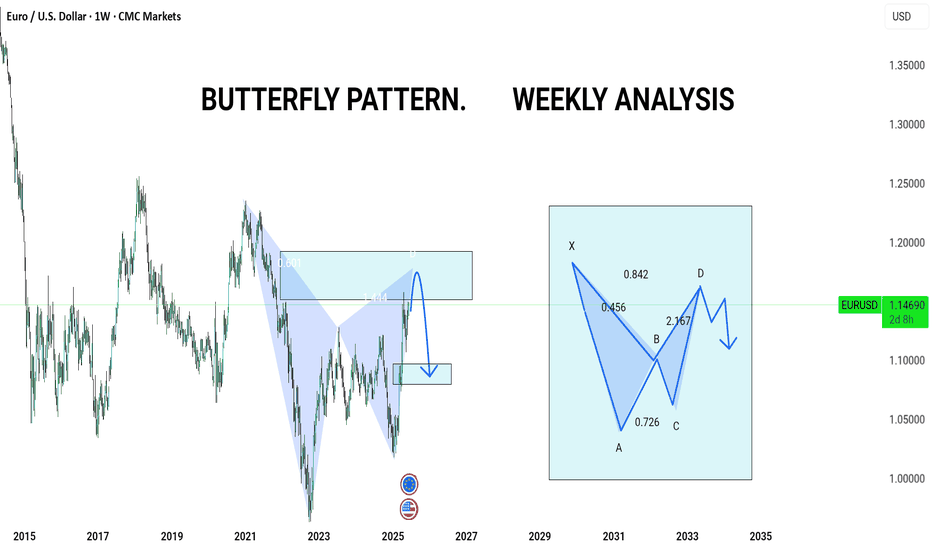
Here is a professional TradingView publish description for your EUR/USD Weekly Butterfly Pattern Analysis: --- 🦋 EUR/USD Weekly Outlook | Harmonic Butterfly Pattern Pair: EUR/USD Timeframe: 1W (Weekly) Strategy: Harmonic Pattern Recognition – Butterfly Pattern Bias: Bearish Reversal Setup --- 🔍 Pattern Analysis: Butterfly Harmonic Pattern completed with...
Pair: US Dollar Index (DXY) Timeframe: 1M (Monthly) Strategy: Smart Money Concept (SMC) + Market Structure + Demand/Supply Zones Bias: Bearish (Mid to Long-Term) Breakdown: Price reacted strongly from the monthly supply zone (110–104), showing signs of exhaustion. Clear CHoCH (Change of Character) visible at the top structure, confirming loss of bullish...
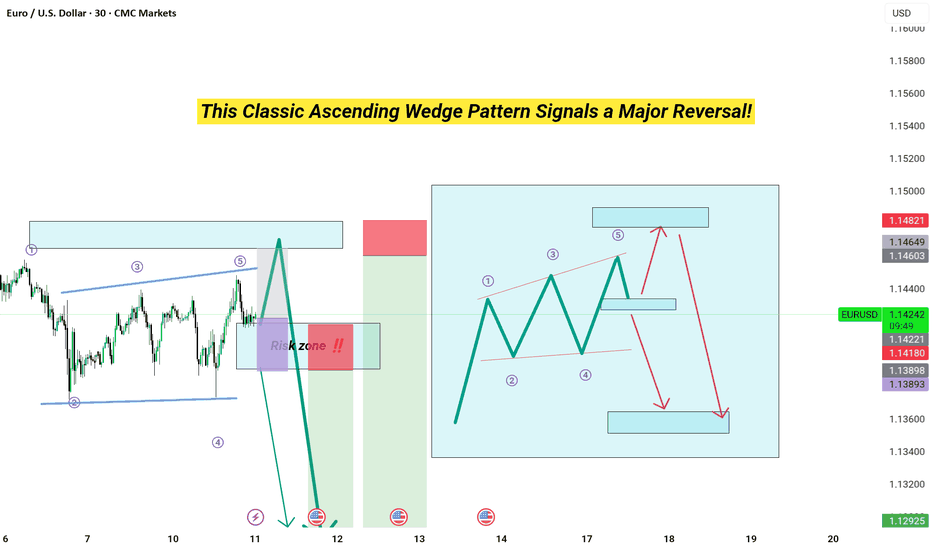
Time': 30 min Technical analysis: Ascending Wedge Pattern 📈: A clear ascending wedge signals a potential bearish reversal. The price has just completed Wave ⑤ at the top trendline, a classic trigger point for sellers. * Elliott Wave Confirmation 🖐️: The wedge contains a perfect 5-wave Elliott structure, reinforcing our bearish bias as the final impulse wave...
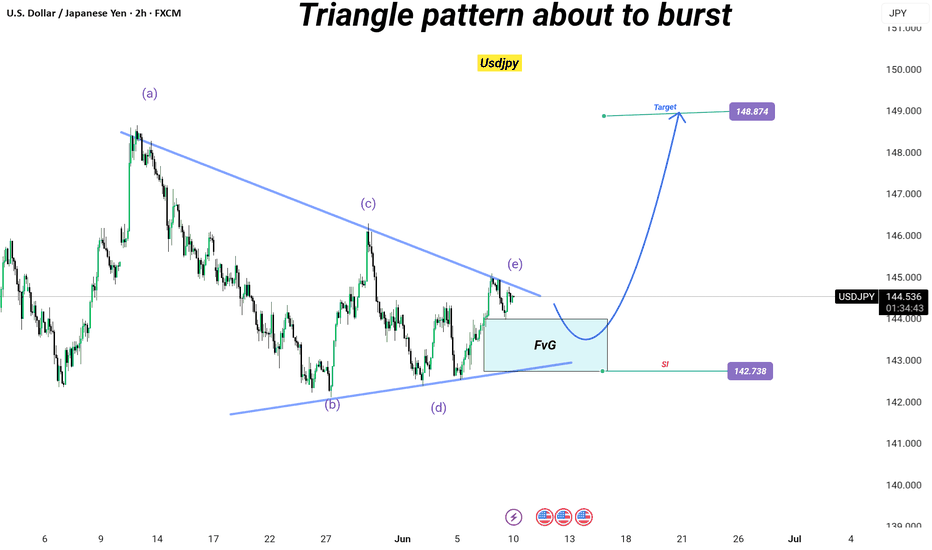
USD/JPY Timeframe: 2H Strategy: Elliott Wave + Triangle Pattern + Fair Value Gap (FvG) Formation: Contracting Triangle – Wave (a) to (e) Risk-Reward: High Conviction Setup Status: On the verge of breakout 🔍 Technical Breakdown: The chart shows a classic contracting triangle pattern with completed internal waves (a)-(b)-(c)-(d)-(e). Price is reacting near wave...
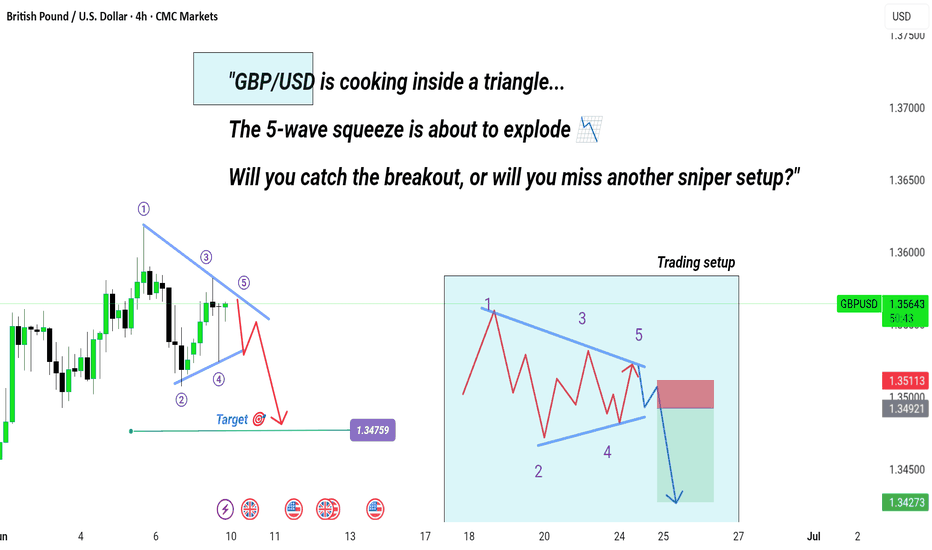
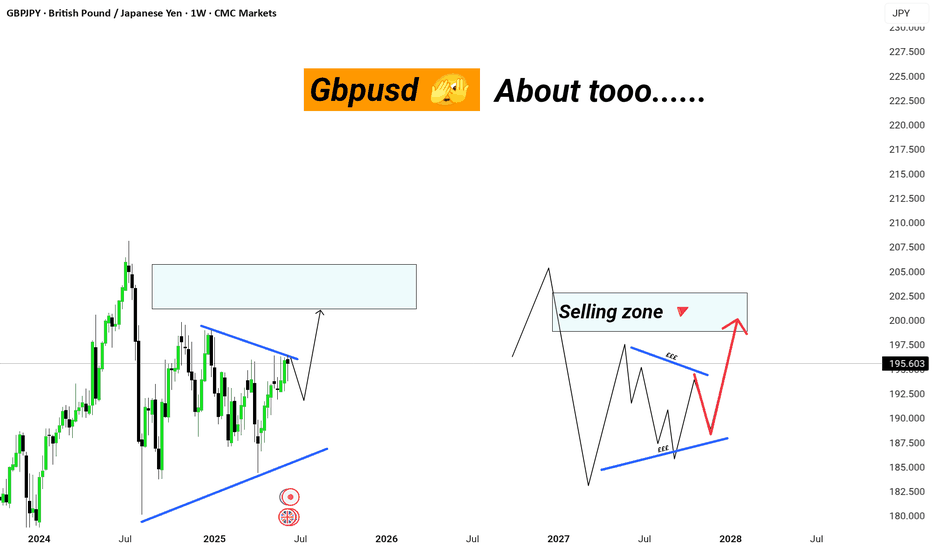
Pair: GBP/USD Timeframe: 4H Strategy: Elliott Wave + Triangle Pattern + Breakout Formation: Contracting Triangle – Wave 1 to 5 Risk-Reward: High Probability Setup Status: Pre-breakout phase 🔍 Technical Breakdown: A clean contracting triangle is forming, completing all 5 internal waves within the structure. Wave 5 looks exhausted and price is rejecting trendline...
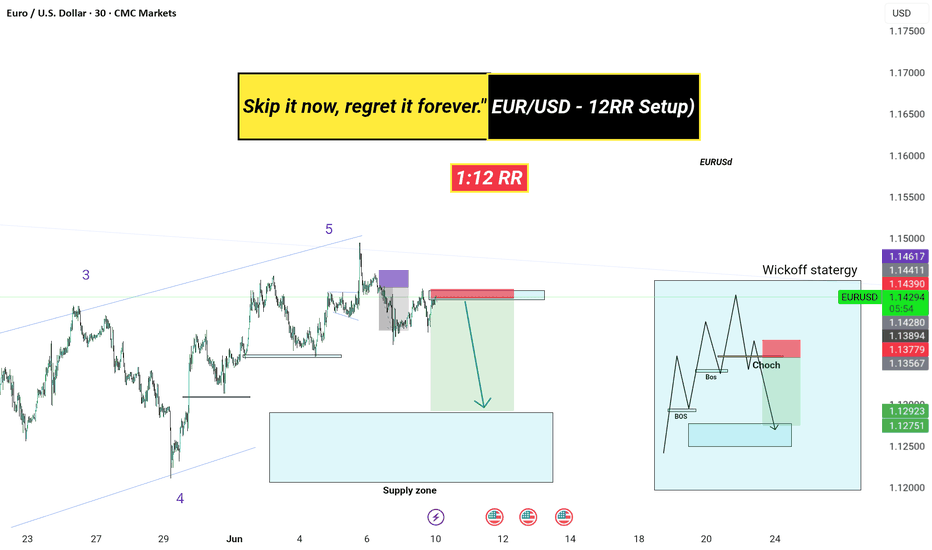
: EUR/USD Timeframe: 30M Strategy: Elliott Wave + Wyckoff Structure Risk-Reward: 1:12 Toolset: Supply Zone, Change of Character (ChoCh), Break of Structure (BoS), Entry Refinement 📈 Analysis Summary: Price completed Wave 5 of the Elliott Wave structure. Clear supply zone rejection near previous high – strong confluence. Break of structure (BoS) confirms...

![USDJPY – 4H . [[ TRIANGLE PATTERN ]] USDJPY: USDJPY – 4H . [[ TRIANGLE PATTERN ]]](https://tradingview.sweetlogin.com/proxy-s3/n/NKf4Jfsw_mid.png)
