Top 5 Most Effective Forex Trading Strategies Used by Professional Traders Forex trading requires not just knowledge, but discipline and a clear strategy. So what are the most effective forex trading strategies that professional traders consistently use to achieve sustainable profits? Let’s explore the 5 most trusted strategies that have stood the test of time –...
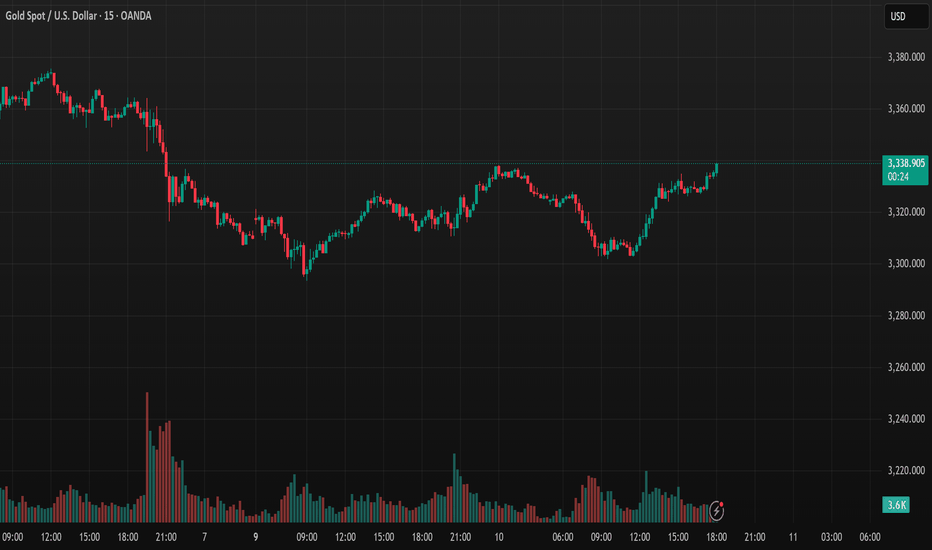
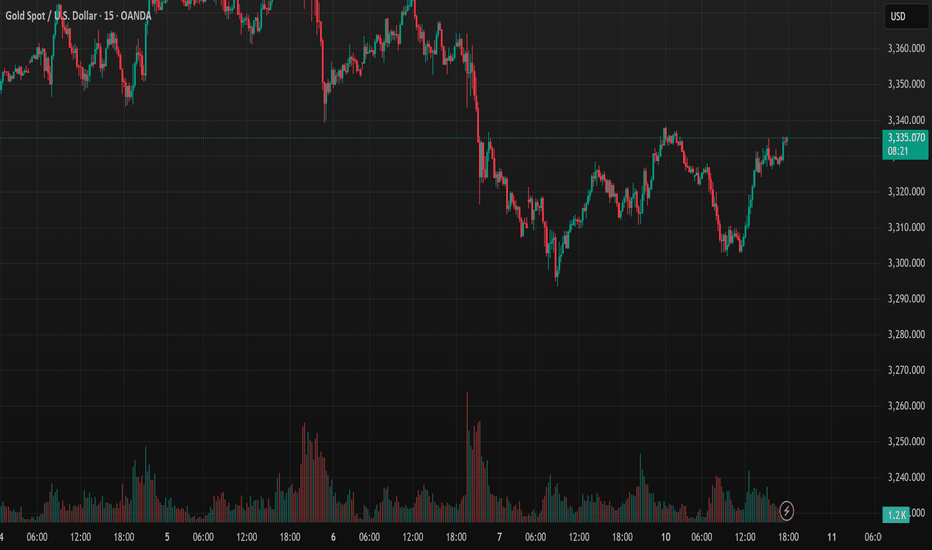
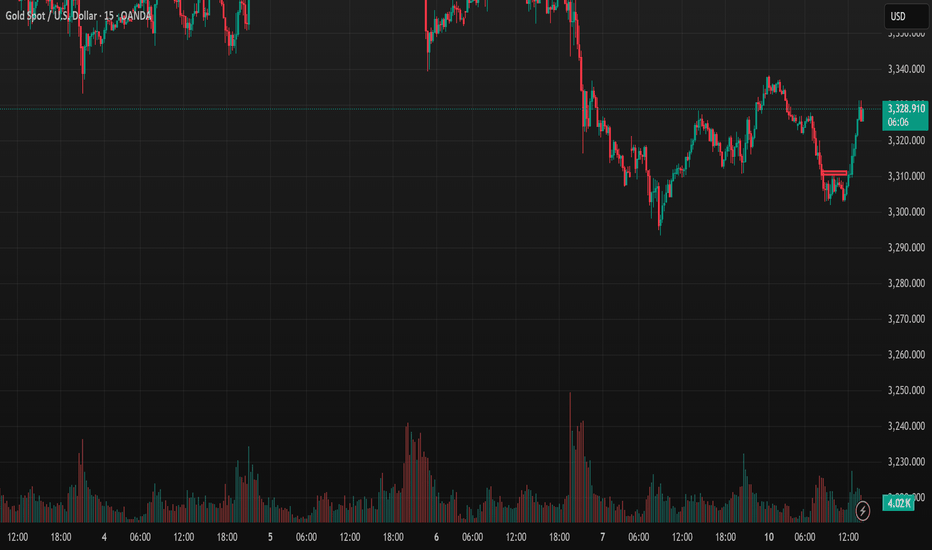
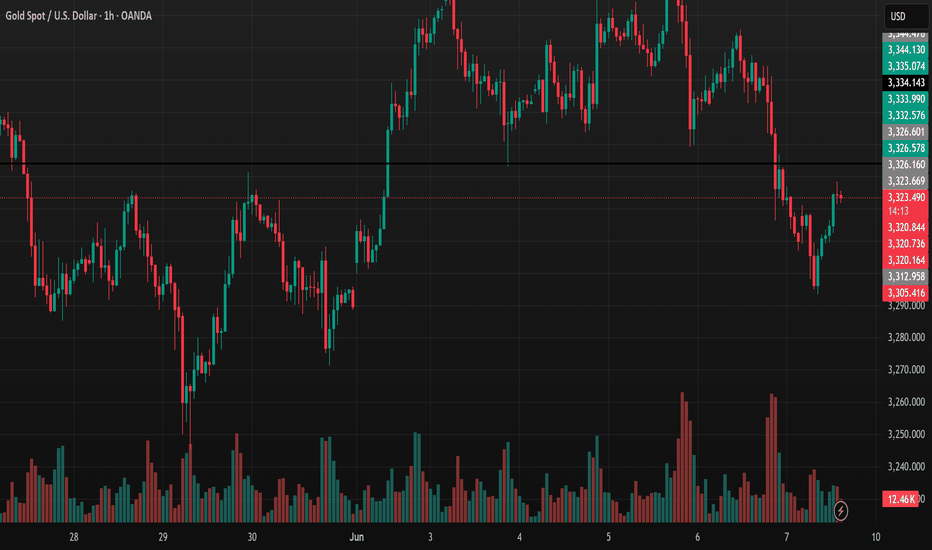
In the early trading session on Tuesday (June 10th), the price of gold XAUUSD dropped sharply from around 3,328 USD/ounce to about 3,305 USD/ounce. Bloomberg pointed out that the price of gold decreased during the early Asian trading session on Tuesday when both sides in the US-China trade talks hinted at a willingness to make concessions. The easing of tensions...
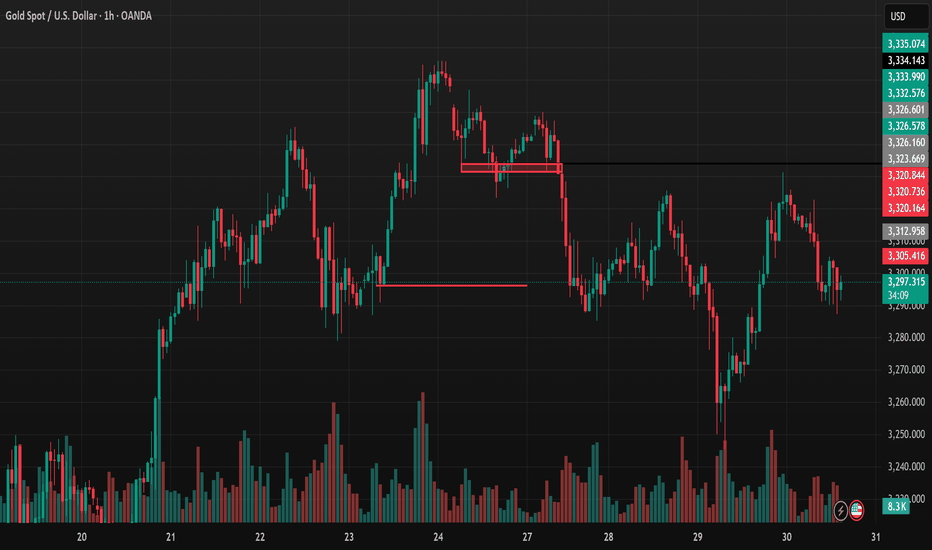
Identify strategies through this video: Key Support and Resistance Levels of XAUUSD Support Levels: 3,300 – 3,292 – 3,250 USD Resistance Levels: 3,336 – 3,346 USD With the current technical backdrop, gold still has short-term bullish potential, but it is essential to closely monitor key support and resistance levels. The gold market remains full of potential, but...
XAUUSD trading (Gold vs. US Dollar) is a popular choice among global traders due to its high liquidity, strong volatility, and profit potential. One of the tools that help traders amplify their returns is financial leverage. However, using leverage also carries significant risks if not managed properly. So, what exactly is leverage in XAUUSD trading? Should you...
How to Use Fibonacci Extension for Effective Profit-Taking in Forex. Fibonacci Extension is a powerful tool for identifying profit-taking levels in Forex, including XAU/USD trading. Here’s a concise, SEO-optimized guide to maximize your gains: 1. Understand Fibonacci Extension Levels The 127.2%, 161.8%, and 261.8% extension levels predict price targets after a...
What is a Fibonacci Sequence? The Fibonacci sequence is a series of numbers where each number is the sum of the two preceding ones, typically starting with 0 and 1 (e.g., 0, 1, 1, 2, 3, 5, 8, 13, 21, ...). In trading, the Fibonacci retracement levels are derived from key ratios (23.6%, 38.2%, 50%, 61.8%, and 100%) based on this sequence. These levels are used to...
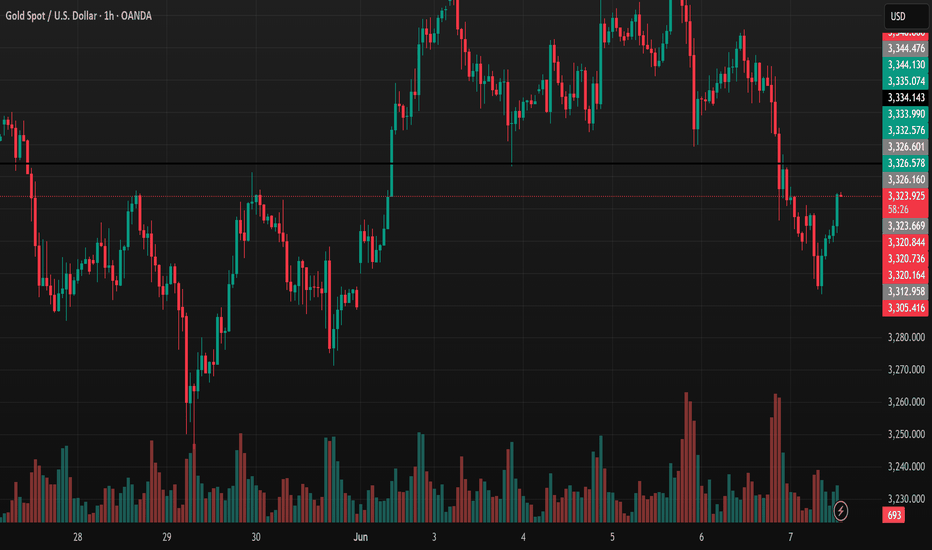
Gold FX:XAUUSD Price XAU/USD Analysis Today: Downtrend Signals, What Opportunities for Investors? Updated at 13:57 on 09/06/2025 (+07) - The 1-hour trading view chart for the XAU/USD (Gold Spot / U.S. Dollar) pair indicates that gold prices are experiencing a significant decline, drawing attention from investors. Let’s dive into a detailed analysis of the...
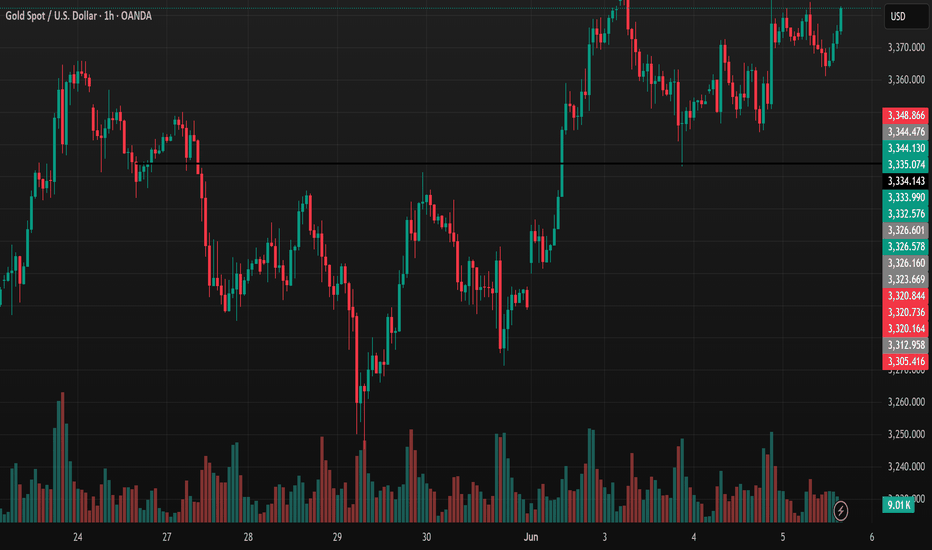
On Friday, gold edged up slightly ahead of key US jobs data (NFP). Optimism over a US-China deal and USD profit-taking are capping gold’s gains. A weak NFP (<100,000) would bolster expectations of a Fed rate cut (54% chance in September), supporting gold, while a strong NFP (>200,000) would pressure it downward. Technically, the market is bullish, with prices...
The Harmonic AB=CD pattern is a powerful technical analysis tool used to predict price reversals in financial markets. Based on Fibonacci ratios, it helps traders identify high-probability entry and exit points. This concise guide is designed for TradingView users to apply the pattern effectively. Pattern Overview - Structure: Four points (A, B, C, D). AB and CD...
Harmonic price patterns are chart patterns based on Fibonacci ratios and market geometry, used to identify potential reversal points in Forex. They rely on Fibonacci levels (e.g., 0.618, 0.786, 1.618) to measure price structures, predicting reversal zones (PRZ - Potential Reversal Zone). Key Features: - Based on Fibonacci ratios. - Geometric structure with 4-5...
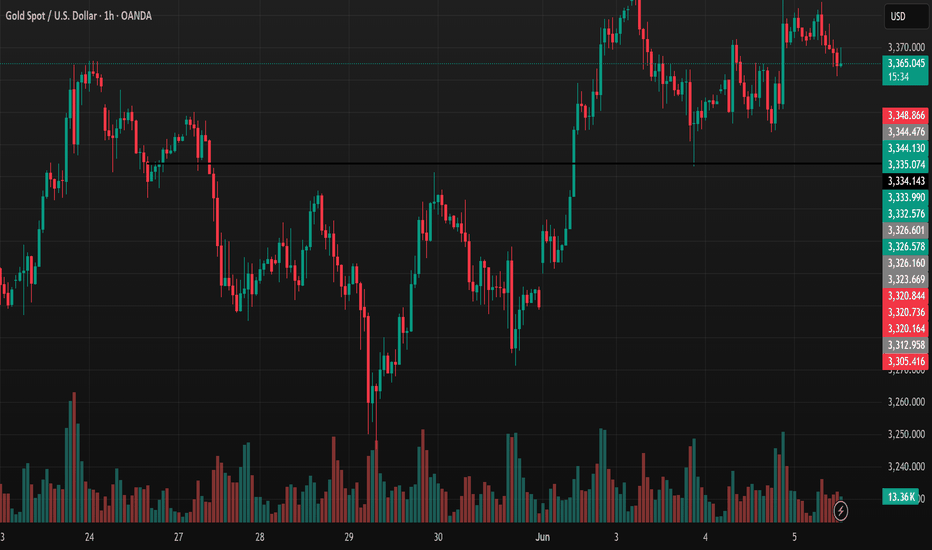
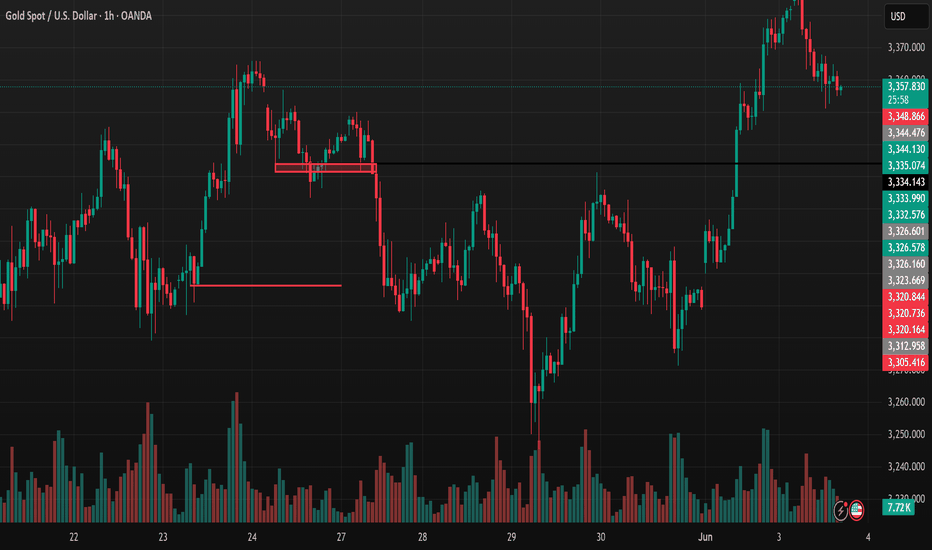
The 1-hour TradingView chart for XAUUSD on 05/06/2025 shows gold prices trending slightly upward, currently trading around 3,373.885 USD/oz, up 0.03% (8.45 USD). Prices experienced significant volatility recently, dropping to a low of around 3,220 USD/oz on 29/05 before surging to a peak of 3,375.315 USD/oz on 04/06, followed by a slight pullback. Trading...
Gold is trading steadily in the early morning session in Asia, supported by weak U.S. economic data released overnight. Service sector activity unexpectedly declined in May, while ADP data showed 37,000 jobs created, marking the slowest private sector hiring pace in over two years. Quasar Elizundia from Pepperstone stated in an email that this data has bolstered...
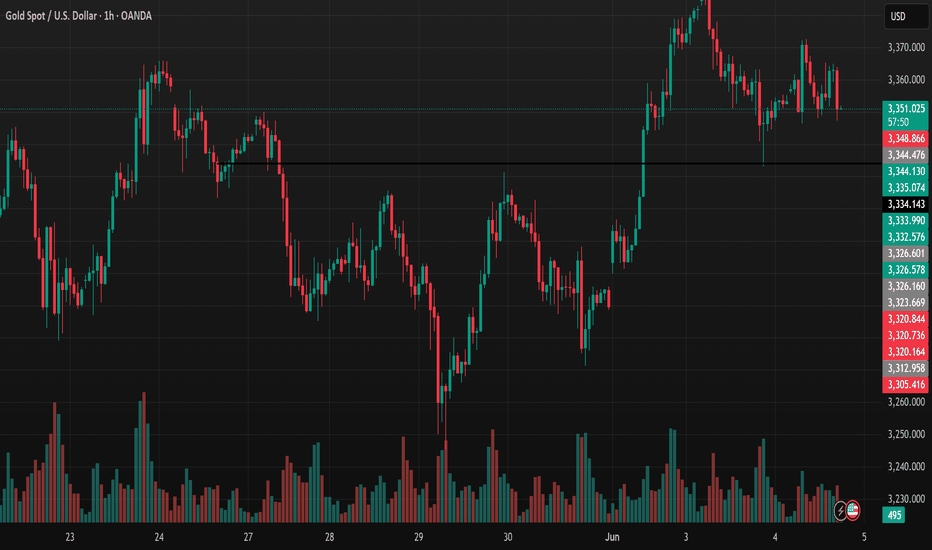
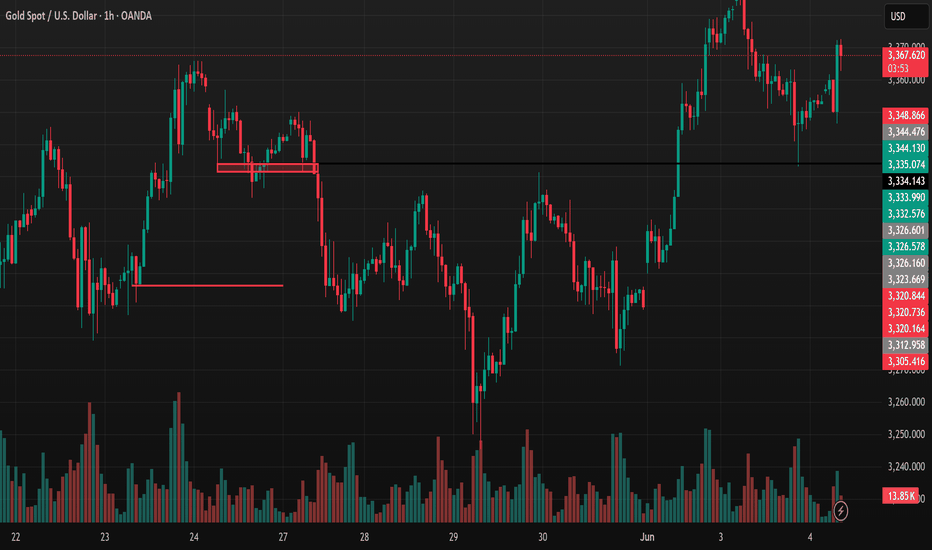
Mainly due to the strengthening U.S. Dollar, gold CAPITALCOM:GOLD prices dropped sharply from a nearly 4-week high, falling almost $30 in a single day on Tuesday, with a slight recovery during the Asian session today, Wednesday, June 4. The Dollar Index rebounded from its lowest level in over a month, reached during early Tuesday trading, and ended the day up...
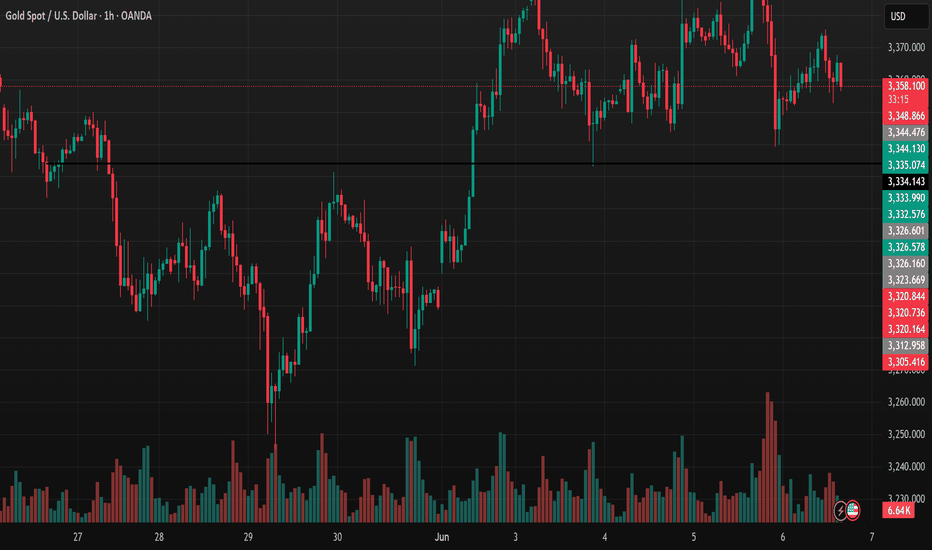
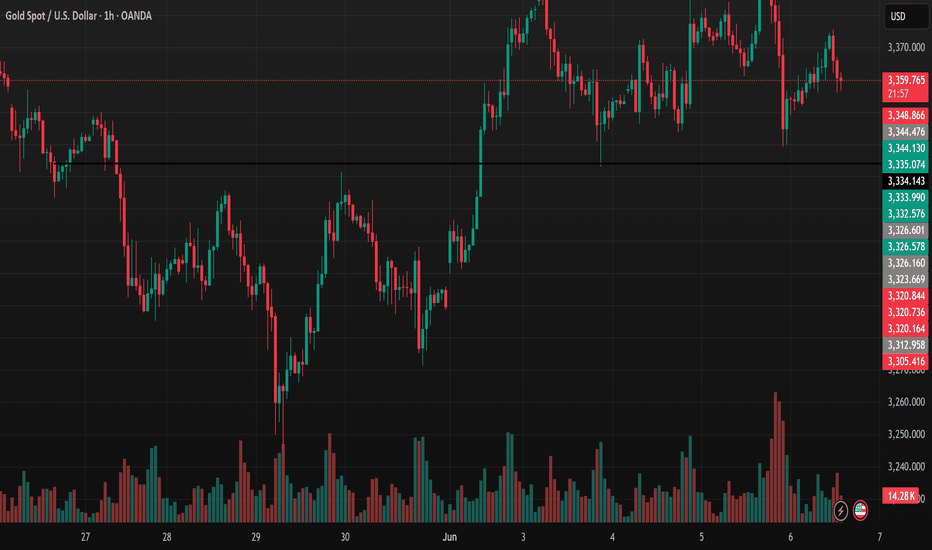
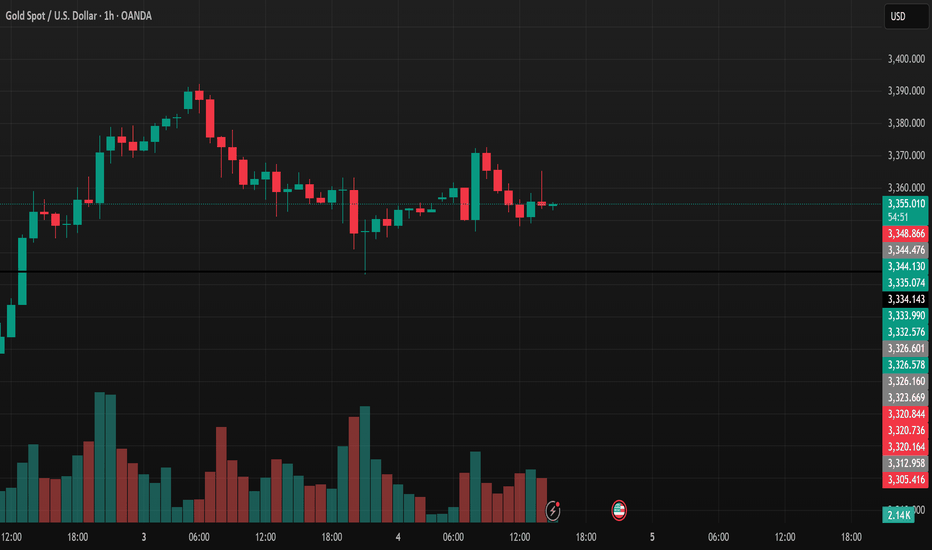
Gold FX:XAUUSD is currently hovering around 3,354 after a sharp drop from the recent high of 3,391. Sellers pushed the price down to the key support zone at 3,334–3,335, but bearish momentum has clearly weakened. The price is moving sideways with small-bodied candles and low volume, indicating the market is “holding its breath” ahead of the European or US...
Gold FX:XAUUSD is currently in a strong uptrend, backed by both technical breakout and positive fundamentals. The price has decisively cleared the key resistance zone of $3,365–$3,370 and is hovering around $3,368. A healthy pullback to retest this zone could offer a high-probability long setup, with the next target projected at $3,470. On the macro side,...
Gold jumped nearly 3% as President Trump announced plans to double tariffs on U.S. steel and aluminum imports to 50% starting June 4, fueling safe-haven demand and weakening the U.S. Dollar. The EU expressed strong regret and warned of potential countermeasures. The rally continued on Tuesday (June 3) as geopolitical tensions escalated. Ukraine launched its...
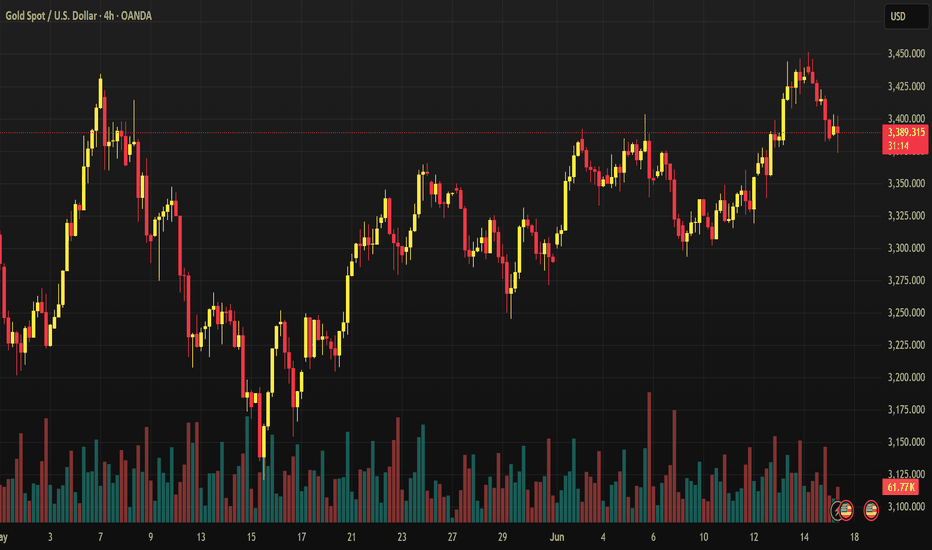
On the monthly chart, XAUUSD is forming an Inside Bar pattern, signaling that the market is compressing ahead of a potential strong move. May’s candle remains within April’s range – a classic setup that often precedes a decisive breakout. On the H4 timeframe, gold has attempted to break above recent highs multiple times but failed, forming a series of lower...
If the upcoming PCE report shows that inflation continues to cool or comes in below expectations (e.g., core PCE under 0.2% m/m), this could reinforce market expectations that the Federal Reserve (Fed) may have room to begin cutting interest rates sooner—potentially as early as September instead of year-end. This would weaken the US dollar and push down...
